

Erector Spinae Muscle to Epicardial Visceral Fat Ratio on Chest CT Predicts the Severity of Coronavirus Disease 2019
- PMID: 39868664
- PMCID: PMC11770476
- DOI: 10.1002/jcsm.13721
Erector Spinae Muscle to Epicardial Visceral Fat Ratio on Chest CT Predicts the Severity of Coronavirus Disease 2019
Abstract
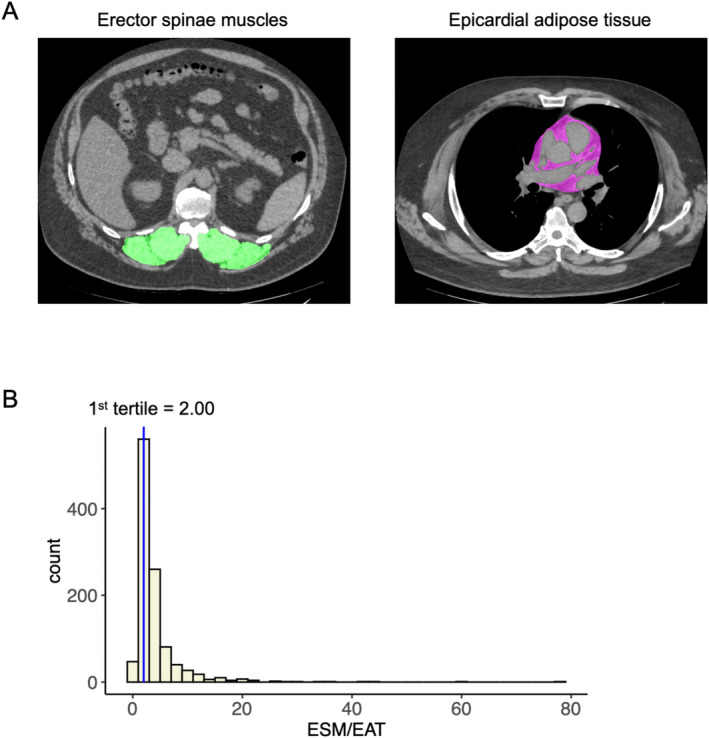
Background: Chest computed tomography (CT) is a valuable tool for diagnosing and predicting the severity of coronavirus disease 2019 (COVID-19) and assessing extrapulmonary organs. Reduced muscle mass and visceral fat accumulation are important features of a body composition phenotype in which obesity and muscle loss coexist, but their relationship with COVID-19 outcomes remains unclear. In this study, we aimed to investigate the association between the erector spinae muscle (ESM) to epicardial adipose tissue (EAT) ratio (ESM/EAT) on chest CT and disease severity in patients with COVID-19.
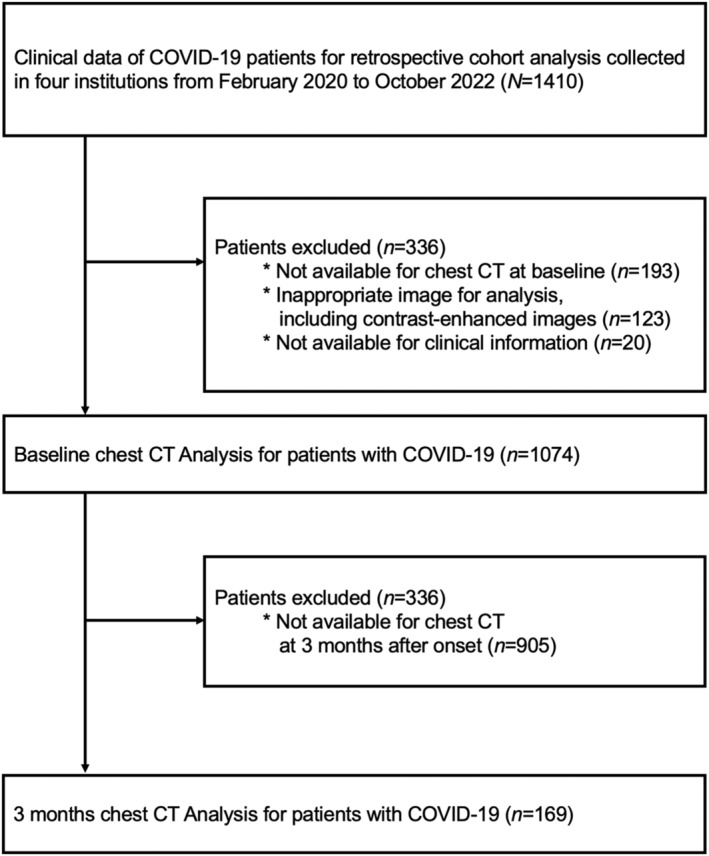
Methods: We analysed data from 1074 COVID-19 patients enrolled in the Japan COVID-19 Task Force database. The primary outcome was the rate of critical outcomes (requiring high-flow oxygen therapy, invasive ventilator support or death). The incidence of critical outcomes was compared between patients with high and low ESM/EAT ratios.
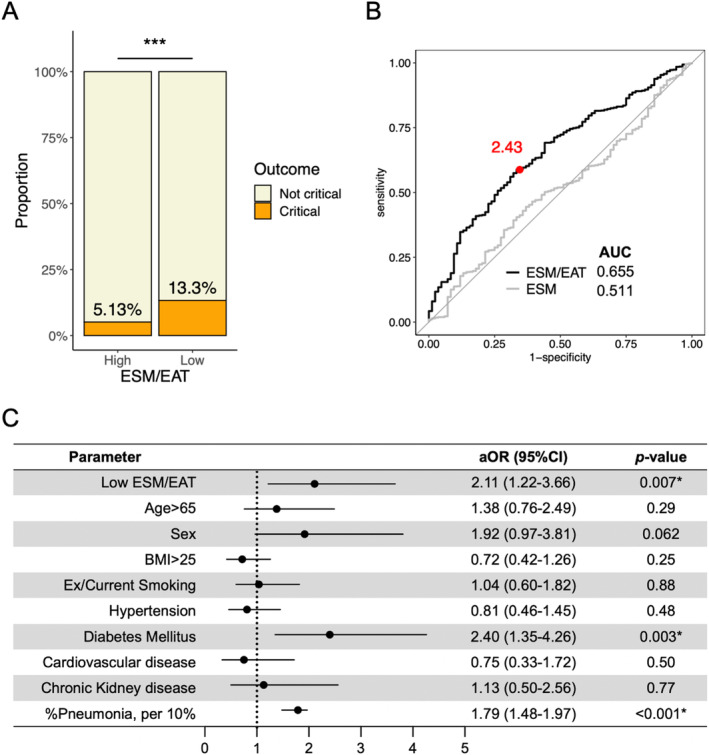
Results: The low ESM/EAT group (n = 353) had a higher incidence of critical outcomes (13.3% vs. 5.13%, p < 0.001) and mortality (2.55% vs. 0.69%, p = 0.019) than the high ESM/EAT group (n = 721). In multivariable analysis, the low ESM/EAT ratio was associated with critical outcomes (adjusted odds ratio [aOR] 2.11, 95% confidence interval [CI] 1.22-3.66) independently of the known COVID-19 severity factors including age, sex, body mass index (BMI), smoking history, lifestyle-related comorbidities and pneumonia volume.
Conclusion: The low ESM/EAT ratio in COVID-19 patients can be obtained on chest CT and used to predict critical outcomes after disease onset, demonstrating the importance of detailed body composition assessments in COVID-19 practice.
Keywords: COVID‐19; computed tomography; epicardial adipose tissue; erector spinae muscles; obesity; sarcopenia.
© 2025 The Author(s). Journal of Cachexia, Sarcopenia and Muscle published by Wiley Periodicals LLC.
Conflict of interest statement
The authors declare no conflicts of interest.
Figures
References
-
- Prado C. M., Lieffers J. R., McCargar L. J., et al., “Prevalence and Clinical Implications of Sarcopenic Obesity in Patients With Solid Tumours of the Respiratory and Gastrointestinal Tracts: A Population‐Based Study,” Lancet Oncology 9 (2008): 629–635. - PubMed
-
- Fukushima T., Maetani T., Chubachi S., et al., “Epicardial Adipose Tissue Measured From Analysis of Adipose Tissue Area Using Chest CT Imaging Is the Best Potential Predictor of COVID‐19 Severity,” Metabolism 150 (2024): 155715. - PubMed
-
- Nakagawara K., Shiraishi Y., Chubachi S., et al., “Integrated Assessment of Computed Tomography Density in Pectoralis and Erector Spinae Muscles as a Prognostic Biomarker for Coronavirus Disease 2019,” Clinical Nutrition 43 (2024): 815–824. - PubMed
-
- Azekawa S., Maetani T., Chubachi S., et al., “CT‐Derived Vertebral Bone Mineral Density Is a Useful Biomarker to Predict COVID‐19 Outcome,” Bone 184 (2024): 117095. - PubMed
MeSH terms
Grants and funding
- JP20nk0101612/Japan Agency for Medical Research and Development (AMED)
- JP20fk0108415/Japan Agency for Medical Research and Development (AMED)
- JP20fk0108452/Japan Agency for Medical Research and Development (AMED)
- JP21jk0210034/Japan Agency for Medical Research and Development (AMED)
- JP21km0405211/Japan Agency for Medical Research and Development (AMED)
- JP21km0405217/Japan Agency for Medical Research and Development (AMED)
- JP21wm0325031/Japan Agency for Medical Research and Development (AMED)
- JP21fk0108553/Japan Agency for Medical Research and Development (AMED)
- JP21fk0108563/Japan Agency for Medical Research and Development (AMED)
- JP21fk0108573/Japan Agency for Medical Research and Development (AMED)
- JP21fk0108431/Japan Agency for Medical Research and Development (AMED)
- JP22fk0108573/Japan Agency for Medical Research and Development (AMED)
- JP22fk0108513/Japan Agency for Medical Research and Development (AMED)
- JP22fk0108510/Japan Agency for Medical Research and Development (AMED)
- JP22wm0325031/Japan Agency for Medical Research and Development (AMED)
- JPMJCR20H2/Japan Science and Technology Agency (JST) CREST
- JPMJPR21R7/Japan Science and Technology Agency (JST) PRESTO
- 20CA2054/Ministry of Health, Labour and Welfare
