. 2025 Mar;12(11):e2407494.
doi: 10.1002/advs.202407494. Epub 2025 Jan 27.

Pharmacological Dissection Identifies Retatrutide Overcomes the Therapeutic Barrier of Obese TNBC Treatments through Suppressing the Interplay between Glycosylation and Ubiquitylation of YAP

Affiliations

Pharmacological Dissection Identifies Retatrutide Overcomes the Therapeutic Barrier of Obese TNBC Treatments through Suppressing the Interplay between Glycosylation and Ubiquitylation of YAP

Xin Cui et al. Adv Sci (Weinh). 2025 Mar.

Abstract

Triple-negative breast cancer (TNBC) in obese patients remains challenging. Recent studies have linked obesity to an increased risk of TNBC and malignancies. Through multiomic analysis and experimental validation, a dysfunctional Eukaryotic Translation Initiation Factor 3 Subunit H (EIF3H)/Yes-associated protein (YAP) proteolytic axis is identified as a pivotal junction mediating the interplay between cancer-associated adipocytes and the response to anti-cancer drugs in TNBC. Mechanistically, cancer-associated adipocytes drive metabolic reprogramming resulting in an upregulated hexosamine biosynthetic pathway (HBP). This aberrant upregulation of HBP promotes YAP O-GlcNAcylation and the subsequent recruitment of EIF3H deubiquitinase, which stabilizes YAP, thus promoting tumor growth and chemotherapy resistance. It is found that Retatrutide, an anti-obesity agent, inhibits HBP and YAP O-GlcNAcylation leading to increased YAP degradation through the deprivation of EIF3H-mediated deubiquitylation of YAP. In preclinical models of obese TNBC, Retatrutide downregulates HBP, decreases YAP protein levels, and consequently decreases tumor size and enhances chemotherapy efficacy. This effect is particularly pronounced in obese mice bearing TNBC tumors. Overall, these findings reveal a critical interplay between adipocyte-mediated metabolic reprogramming and EIF3H-mediated YAP proteolytic control, offering promising therapeutic strategies to mitigate the adverse effects of obesity on TNBC progression.

Keywords: OGT; YAP; adipocyte; deubiquitinase; glycosylation; tumorigenesis.


Conflict of interest statement

The authors declare no conflict of interest.

Figures

Figure 1
Figure 1
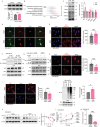
Hippo‐YAP signaling correlates with adipocyte‐initiated breast tumor carcinogenesis and suppresses therapeutic efficacy. A–C) Schematic diagram of eight‐week‐old Female BALB/c mice were fed with a normal chow diet or high‐fat diet (HFD) for 10 weeks. 4T1 breast cancer cells were orthotopically injected into the right fourth mammary gland of the mice (A). Tumor growth curve (B) was plotted (n = 5), and tumor weight (C) was measured at the endpoint (Normal n = 7, Obese n = 6). D) Each tumor was fixed in 4% buffered formaldehyde, paraffin‐embedded, and processed for hematoxylin‐eosin (H&E) staining and Ki67 staining. E) Stimulation of TNBC cell proliferation by adipocyte‐conditioned medium at low density as determined by colony formation assay. Represented figures were presented, and colony formation ratios were calculated (n = 6). F,G) Clonogenic cell survival experiments for ACM/SCM treated MDA‐MB‐231 cells with or without exposure to 500 nm/1 µm Paclitaxel (F) and 5 µm/10 µm Gemcitabine (G) for 24h, as measured by cytotoxicity (n = 6). H) Comparison of ssGSEA score distributions between obese and normal samples, focusing on tumor proliferation and survival pathways in breast tumors. P‐values are derived from Wilcoxon tests. I) Heatmap presents the row‐scaled log2(counts) values of 10 YAP‐conserved genes from obese and normal samples, ordered from left to right by expression level from high (obese) to low (normal). J) Heatmap and hierarchical clustering display the row‐scaled log2 protein expression values of 79 obesity‐associated genes from 105 human breast tumors (columns), arranged from left to right by expression level from high (obese) to low (normal). The log2 relative gene expression scale is depicted on the top left. K) Volcano plots showing the cancer hallmark gene expression changes focusing on tumor proliferation and survival pathways in obese breast cancer patient cohorts. Each circle represents one protein. The log fold change is represented on the x‐axis. The y‐axis shows the FDR adjusted log10 of the p‐value. A p‐value of 0.05 and a fold change of 1 are indicated by red and green lines. L) YAP, TEAD3/4, and WWTR1 expression density in obese and lean breast cancer patients were calculated based on log2 relative protein expression and represented in a violin plot. M,N) Increased Hippo‐YAP signaling pathway activation in obese mice bearing tumor (M) and adipocyte‐conditioned medium cultured MDA‐MB‐231 cells (N) as determined by RT‐PCR (Normal n = 5, Obese n = 4; SCM n = 3, ACM n = 4). Data (mean ± SEM) are representative of at least three independent experiments. *p < 0.05, **p < 0.01, ***p < 0.001, and ****p < 0.0001, by multiple unpaired T‐test.
Figure 2
Figure 2
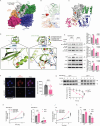
Adipocyte‐associated signaling promotes TNBC malignancy through proteolytic regulation of YAP stabilization. A) Tumor xenografts from obese and lean mice were immunohistochemically stained for YAP. B) YAP protein level was determined and quantified in obese and lean mice bearing tumors (Normal n = 5, Obese n = 4). C–F) Immunofluorescence staining of YAP protein expression in ACM and SCM treated MDA‐MB‐231. Scale bar = 10 µm. Whole cell, nuclei, and cytoplasmic YAP fluorescence intensities were quantified (D‐F) (SCM n = 20, ACM n = 23). G) YAP protein level was determined and quantified in ACM and SCM treated MDA‐MB‐231 breast cancer cells (n = 4). H) MDA‐MB‐231‐shCon and MDA‐MB‐231‐shYAP cells were cultured using adipocytes conditioned medium or stromal‐cell conditioned medium, cell proliferation rate was determined and quantified (n = 4). I) MDA‐MB‐231‐shCon and MDA‐MB‐231‐shYAP cells were pre‐treated with cultured using adipocytes conditioned medium or stromal‐cell conditioned medium for 24 h, and colony formations were determined (n = 6). J,K) Adipocytes conditioned medium cultured MDA‐MB‐231‐shYAP (J) and MDA‐MB‐231‐YAP OE (K) cells were treated with 25 µg ml−1 carboplatin, 500 nm paclitaxel and 5 µm gemcitabine for 24 h, and colony formations were determined (n = 6). L) YAP mRNA levels were determined by RT‐PCR in normal and obese mice bearing tumors (Normal n = 5, Obese n = 4). M,N) MDA‐MB‐231 cells were treated with cycloheximide or MG132, and YAP protein levels were determined (M) and quantified (N) (n = 3). O) Validation of YAP ubiquitylation by co‐immunoprecipitation of endogenous YAP in both ACM and SCM‐treated MDA‐MB‐231 cells (n = 3). P) Validation of EIF3H‐YAP interaction by co‐immunoprecipitation of endogenous EIF3H in both ACM and SCM‐treated MDA‐MB‐231 cells. The YAP‐associated EIF3H was quantified on the right (n = 3). Q) Colocalization between YAP and EIF3H and DAPI was measured by immunofluorescence staining, showing a principal overlap of YAP (green) and EIF3H (red) in both cytosol and nuclei. R,S) Slides of SCM or ACM treated MDA‐MB‐231 cells were incubated with mouse anti‐YAP and rabbit anti‐EIF3H antibodies. Duolink PLA was then performed and red dots indicate the interaction of the two proteins (R). The fluorescence intensities were quantified in (S) (SCM n = 19, ACM n = 12). T) MDA‐MB‐231‐shCon and MDA‐MB‐231‐shEIF3H cells were cultured using adipocytes conditioned medium or stromal‐cell conditioned medium, cell proliferation rate was determined and quantified (n = 4). Data (mean ± SEM) are representative of at least three independent experiments. *p < 0.05, **p < 0.01, ***p < 0.001, and ****p < 0.0001, by multiple unpaired t‐test or two‐way ANOVA followed with Tukey's multiple comparisons test.
Figure 3
Figure 3
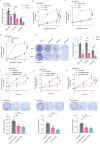
Interplay between glycosylation and ubiquitylation dictates adipocyte induced YAP accumulation. A) EIF3H protein level was determined and quantified in TNBC tumors from obese and normal mice (Normal n = 5, Obese n = 4). B) Comparison of ssGSEA score distributions between obese and normal samples in breast tumors focuses on glycosylation‐related signaling pathways. P‐values are obtained from Wilcoxon tests. C) The protein expression levels of multiple enzymes involved in both O‐glycosylation and N‐glycosylation pathways, including OGT, STT3A, MGAT1, MAN1C1, and MAN2A2, were determined in ACM or SCM treated MDA‐MB‐231 cells (n = 3). D) Colocalization between YAP and OGT and DAPI was detected by immunofluorescence staining, showing a principal overlap of OGT (green) and YAP (red) in the cytosol. E) Slides of SCM or ACM treated MDA‐MB‐231 cells were incubated with mouse anti‐YAP and rabbit anti‐OGT antibodies. Duolink PLA was then performed and red dots indicate the interaction of the two proteins. The red fluorescence was also quantified (SCM n = 27, ACM n = 21). F) Validation of biochemical interaction between YAP and OGT in ACM or SCM‐treated MDA‐MB‐231 cells by co‐immunoprecipitation of endogenous YAP. G) ACM‐conditioned MDA‐MB‐231 cells were treated with OSMI‐1, and both YAP O‐GlcNAcylation and the interaction between YAP and EIF3H were determined by co‐immunoprecipitation. H) ACM‐conditioned MDA‐MB‐231 cells were treated with OSMI‐1 and then incubated with mouse anti‐YAP and rabbit anti‐EIF3H antibodies. Duolink PLA was then performed and red dots indicate the interaction of the two proteins. The red fluorescence was also quantified (Control n = 18, OSMI‐1 n = 24). I) ACM‐conditioned MDA‐MB‐231 cells were treated with OSMI‐1 and Immunofluorescence staining of YAP expression (red) was measured and quantified (Control n = 13, OSMI‐1 n = 16). J) Validation of YAP ubiquitylation by co‐immunoprecipitation of endogenous YAP in OSMI‐1 treated ACM cultured MDA‐MB‐231 cells (n = 3). K) OSMI‐1 treated ACM conditioned MDA‐MB‐231 cells were incubated with cycloheximide and YAP protein turnover was determined (n = 3). L,M) MDA‐MB‐231 cells were cultured using adipocytes conditioned medium and treated with OSMI‐1 for 24 h, CCK8 based cell proliferation (L) (n = 4), and colony formation (M) (n = 6) were determined. Data (mean ± SEM) are representative of at least three independent experiments. *p < 0.05, **p < 0.01, ***p < 0.001, and ****p < 0.0001, by multiple unpaired t‐test or two‐way ANOVA followed with Tukey's multiple comparisons test. OGT, O‐linked N‐acetylglucosamine (GlcNAc) transferase. STT3A, STT3 oligosaccharyltransferase complex catalytic subunit A. MGAT1, alpha‐1,3‐mannosyl‐glycoprotein 2‐beta‐N‐acetylglucosaminyltransferase. MAN1C1, mannosidase alpha class 1C member 1. MAN2A2, mannosidase alpha class 2A member 2.
Figure 4
Figure 4
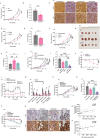
Adipocyte induced metabolic dysregulation leads to enhanced YAP‐O‐GlcNAcylation and subsequently YAP accumulation. A) Comparison of ssGSEA score distributions between obese and normal samples in breast tumors focuses on metabolic processing pathways. P‐values are obtained from Wilcoxon tests. B–E) The Mito stress (B) (n = 4) and mitochondrial substrates oxidation (C‐E) were measured for ACM or SCM‐treated MDA‐MB‐231 cells with a Seahorse XF24 Flux Analyzer. Basal respiration, ATP‐linked respiration, maximal and reserve capacities, non‐mitochondrial respiration for Mito stress and maximal respiration change for mitochondrial substrates oxidation were determined ((C‐D) n = 5, (E) n = 8). F) Hexosamine biosynthesis pathway‐related enzymes, including GFAT, GNA1, OGT, and OGA protein levels, were determined and quantified in ACM and SCM‐treated MDA‐MB‐231 breast cancer cells (n = 3). G) ACM‐conditioned MDA‐MB‐231 cells were treated with GFAT inhibitor DON, and both YAP O‐GlcNAcylation and the interaction between YAP and EIF3H were determined by co‐immunoprecipitation. H) ACM‐conditioned MDA‐MB‐231 cells were treated with GFAT inhibitor DON and then incubated with mouse anti‐YAP and rabbit anti‐OGT antibodies. Duolink PLA was then performed and red dots indicate the interaction of the two proteins. The red fluorescence was also quantified (Control n = 13, DON n = 17). I) ACM‐conditioned MDA‐MB‐231 cells were treated with GFAT inhibitor DON and Immunofluorescence staining of YAP expression (red) was measured and quantified (Control n = 14, DON n = 22). J) GFAT inhibitor DON treated ACM cultured MDA‐MB‐231 cells were incubated with cycloheximide and YAP protein turnover were determined (n = 3). K,L) MDA‐MB‐231 cells were cultured with adipocytes conditioned medium and treated with DON for 24 h, CCK8 based cell proliferation (K) (n = 4) and colony formation (L) (n = 6) were determined. Data (mean ± SEM) are representative of at least three independent experiments. *p < 0.05, **p < 0.01, ***p < 0.001, and ****p < 0.0001, by multiple unpaired t‐test or two‐way ANOVA followed with Tukey's multiple comparisons test. GFAT, Glutamine fructose‐6‐phosphate amidotransferase. GNA1, glucosamine‐phosphate N‐acetyltransferase 1. OGT, O‐linked N‐acetylglucosamine (GlcNAc) transferase. OGA, O‐GlcNAcase.
Figure 5
Figure 5
3D Structural modeling and functional studies reveal how glycosylation and ubiquitylation orchestrate adipocyte‐induced YAP accumulation. A–C) Molecular docking simulations elucidate the interaction between the YAP fragment spanning amino acid residues Q46 – E100 and OGT amino acid residues T315 – K1028. (A) a surface model of YAP (Gray) juxtaposed with OGT domains (TPRs in green, N‐Cat in blue, Int‐D in pink, and C‐Cat in orange), (B) An enlarged depiction highlighting the predicted interacting residues. (C) Display of YAP in ribbon rendering, with OGT represented as a surface, offering comprehensive insights into their molecular interaction. D) The structural model, derived from molecular docking simulations, elucidates the intermolecular interactions between the YAP (Q46‐E100) TEAD domain and EIF3H (S34‐L150) amino acid residues, particularly within the JAB/MP domain. The left enlarged region reveals the predicted interacting residues between YAP and EIF3H in the absence of glycosylation on YAP, while the right panel demonstrates an augmented interaction between YAP and EIF3H upon the addition of a glycan moiety on Thr83 of YAP. Notably, the presence of Galactose and N‐acetylmuramic acid on Thr83 facilitates the formation of three hydrogen bonds with EIF3H, as depicted. E) The interaction between YAP with EIF3H and OGT by coimmunoprecipitation of ectopic V5‐YAPWT and V5‐tagged YAPT83A mutant in ACM‐treated MDA‐MB‐231 cells was determined. The O‐GlcNAcylation status of V5‐YAPWT and V5‐tagged YAPT83A mutant were also determined (n = 3). F) ACM‐conditioned MDA‐MB‐231‐YAPWT and MDA‐MB‐231‐YAPT83A cells were incubated with mouse anti‐YAP and rabbit anti‐EIF3H antibodies. Duolink PLA was then performed and red dots indicate the interaction of the two proteins. The red fluorescence was also quantified (YAPWT n = 14, YAPT83A n = 24). G) MDA‐MB‐231‐YAPWT and MDA‐MB‐231‐YAPT83A cells were incubated with cycloheximide, and YAP protein turnover was determined (n = 3). H–K) MDA‐MB‐231 cells (H‐I) and 4T1 cells (J‐K) with stably expressing V5‐YAPWT and V5‐tagged YAPT83A mutant were cultured using adipocytes conditioned medium or stromal‐cell conditioned medium, CCK8‐based cell proliferation (H and J) (n = 4), and colony formation (I and K) (n = 6) was determined. Data (mean ± SEM) are representative of at least three independent experiments. *p < 0.05, **p < 0.01, ***p < 0.001, and ****p < 0.0001, by multiple unpaired T‐test or two‐way ANOVA followed with Tukey's multiple comparisons test.
Figure 6
Figure 6
Pharmacological dissection identifies suppressing HBP‐OGT‐YAP axis resensitizes adipocyte associated TNBC cells in response chemotherapeutic agents. A) MDA‐MB‐231‐Control and MDA‐MB‐231‐EIF3H KO cells were cultured with ACM medium and exposed to 25 µg ml−1 Carboplatin, 5 µm Gemcitabine, and 500 nm Paclitaxel for 24 h, colony formation was determined (n = 6). B–E) MDA‐MB‐231‐Vector control, MDA‐MB‐231‐YAPWT, and MDA‐MB‐231‐YAPT83A cells were cultured with ACM medium and exposed to 25 µg ml−1 Carboplatin, 5 µm Gemcitabine, and 500 nm Paclitaxel for 24 h, cell proliferation rate (B‐D) (n = 4) and clonogenic survival (E) (n = 6) was determined and quantified. F–K) CCK8 based cell proliferation rates and colony formation were assessed after treating ACM cultured MDA‐MB‐231 cells with 1 µm OSMI‐1 or DON, and additionally with 25 µg ml−1 Carboplatin (F and I), 500 nm Paclitaxel (G and J), or 5 µm Gemcitabine (H and K) for 24 h ((F‐H) n = 4, (I‐K) n = 6). Data (mean ± SEM) are representative of at least three independent experiments. *p < 0.05, **p < 0.01, ***p < 0.001, and ****p < 0.0001, by multiple unpaired t‐test or two‐way ANOVA followed with Tukey's multiple comparisons test.
Figure 7
Figure 7
Retatrutide enhances chemosensitivity in obese TNBC models by modulating metabolic barriers to treatment. A,B) 4T1‐shCon and 4T1‐shEIF3H breast cancer cells were orthotopically injected into the right fourth mammary gland of the HFD‐fed BALB/c wild‐type (WT) mice. The tumor growth curve was plotted (A), and tumor weight was measured at the end point (B) (n = 5). C) Tumors were fixed in 4% buffered formaldehyde, paraffin‐embedded, and processed for EIF3H and YAP staining. D,E) 4T1 cells were orthotopically injected into the right fourth mammary fat pad in HFD‐fed BALB/c mice and allowed to grow around 100 mm3, followed by injection of OSMI‐1 (5 mg kg−1, i.p.) two times/week. Phosphate‐buffered saline (PBS) was used in control mouse group. Tumor growth (D) and tumor weight (E) were plotted (n = 5). F–H) 4T1 control, 4T1‐YAPWT and 4T1‐YAPT83A tumors were orthotopically injected and harvested 35 days after tumor challenge in HFD fed mice and analyzed. The tumor growth curve was plotted (F), and tumor weight (G‐H) was measured at the endpoint (n = 5). I,J) 4T1‐YAPWT and 4T1‐YAPT83A cells were injected into the right fourth mammary fat pad in HFD‐fed BALB/c mice and allowed to grow around 100 mm3, followed by injection of gemcitabine (5 mg kg−1, i.p.) for two times/week. PBS was used in control groups. Tumor growth (I) was plotted, and tumor weight (J) was measured at the endpoints (n = 5). K–M) 4T1 cells were orthotopically injected into the right fourth mammary fat pad in HFD‐fed mice and allowed to grow around 100 mm3, followed by injection of Retatrutide (5 mg kg−1, i.p.) for two times/week. Mice body weights were monitored (K) and Control or Retatrutide‐treated 4T1 tumors were harvested, digested and assayed for mitochondrial respiration (L‐M) (n = 5). N–P) MDA‐MB‐231 cells were orthotopically injected into the right fourth mammary fat pad in HFD fed nude mice and allowed to grow around 100 mm3, followed by injection of gemcitabine (5 mg kg−1, i.p.) and Retatrutide (5 mg kg−1, i.p.) for two times/week. PBS were used in control groups. Tumor growth (N) was plotted, tumor weight was measured (O), and mice body weight was monitored (P) (n = 5). Q–S) Representative staining of YAP and OGT in obese and non‐obese human TNBC tissue sections (n = 17). The analysis using ImageJ shows a positive correlation between adipocyte size and YAP expression (R) as well as YAP and OGT (S). Data (mean ± SEM) are representative of at least three independent experiments. *p < 0.05, **p < 0.01, ***p < 0.001, and ****p < 0.0001, by multiple unpaired t‐test or one‐way or two‐way ANOVA followed with Tukey's multiple comparisons test.
Figure 8
Figure 8
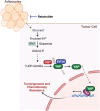
PTM Regulation of YAP in Obesity‐Driven Chemoresistance and the Impact of Retatrutide in TNBC. Increased levels of glucose and glutamine in obese states enhance the activity of GFAT and subsequently the hexosamine biosynthesis pathway (HBP), leading to elevated UDP‐GlcNAc levels. Higher UDP‐GlcNAc levels boost the activity of O‐GlcNAc transferase (OGT), which facilitates the O‐GlcNAcylation of YAP. Enhanced O‐GlcNAcylation leads to reduced ubiquitylation of YAP, by facilitating the interactions with deubiquitinase EIF3H. Consequently, stabilized YAP accumulates and translocates to the nucleus, where it promotes gene transcription that supports tumorigenesis and chemoresistance. The metabolic weight loss drug Retatrutide alters the metabolic environment, reducing the levels of substrates necessary for YAP O‐GlcNAcylation. This reprogramming diminishes YAP's stabilization, thereby enhancing the sensitivity of tumor cells to chemotherapy.

References

    1. Dent R., Trudeau M., Pritchard K. I., Hanna W. M., Kahn H. K., Sawka C. A., Lickley L. A., Rawlinson E., Sun P., Narod S. A., Clin. Cancer Res. 2007, 13, 4429. - PubMed
    1. Agarwal G., Nanda G., Lal P., Mishra A., Agarwal A., Agrawal V., Krishnani N., World J. Surg. 2016, 40, 1362. - PubMed
    1. Calle E. E., Rodriguez C., Walker‐Thurmond K., Thun M. J., N. Engl. J. Med. 2003, 348, 1625. - PubMed
    1. Calle E. E., Kaaks R., Nat. Rev. Cancer 2004, 4, 579. - PubMed
    1. Renehan A. G., Tyson M., Egger M., Heller R. F., Zwahlen M., Lancet 2008, 371, 569. - PubMed

LinkOut - more resources