. 2025 Mar 4;13(3):e0268924.
doi: 10.1128/spectrum.02689-24. Epub 2025 Jan 27.

Fluorofurimazine, a novel NanoLuc substrate, enhances real-time tracking of influenza A virus infection without altering pathogenicity in mice

Affiliations

Fluorofurimazine, a novel NanoLuc substrate, enhances real-time tracking of influenza A virus infection without altering pathogenicity in mice

Steven Smith et al. Microbiol Spectr. .

Abstract

Bioluminescence imaging (BLI) using engineered bioluminescent viruses has emerged as a powerful tool for real-time, noninvasive monitoring of viral replication in living animals. While traditional luciferase-based systems, such as firefly luciferase, have been widely used, the NanoLuc luciferase system offers distinct advantages, including its significantly smaller gene size, increased brightness, and independence from ATP as a cofactor, allowing for extracellular detection. However, the utility of NanoLuc has been limited by its traditional substrate, furimazine, which exhibits poor water solubility and potential cytotoxicity. In this study, we assessed fluorofurimazine (FFz), a novel substrate with improved water solubility and bioavailability, for tracking influenza A virus (IAV) replication in mice. Our findings demonstrate that FFz substantially enhances detection sensitivity in both respiratory organs and brain tissue without increasing toxicity, enabling more precise and sustained monitoring of IAV replication. In vitro, FFz generated higher photon flux at lower concentrations compared to furimazine, translating into superior in vivo sensitivity with reduced toxicity. Crucially, FFz did not alter the pathogenicity of IAV in mice, even at sublethal infectious doses, reinforcing its suitability for use in BLI-based viral pathogenicity studies. These results suggest that combining FFz with NanoLuc provides a more effective and less toxic approach for real-time tracking of viral infections in preclinical models.

Importance: Monitoring viral infections in living animals is a valuable approach for understanding how viruses replicate and cause disease. This study focuses on bioluminescent influenza A virus infection in a mouse model and evaluates fluorofurimazine, a new substrate that enhances bioluminescence imaging. Fluorofurimazine allows researchers to monitor viral spread more effectively than the traditional substrate, furimazine, which is often toxic and less reliable. It offers better sensitivity and lower toxicity, enabling longer and more accurate tracking of viral replication in the lungs and even the brain. Importantly, fluorofurimazine does not alter the pathogenicity of the virus, providing an unaltered representation of the infection process. This advancement has the potential to significantly improve how scientists study bioluminescent viral infections and evaluate antiviral drugs and vaccines, making it a valuable tool for research on influenza and other respiratory viruses.

Keywords: NanoLuc; bioluminescence; brain; fluorofurimazine; furimazine; influenza A virus; respiratory system; toxicity.


Conflict of interest statement

The authors declare no conflict of interest.

Figures

Fig 1
Fig 1
Comparison of detection sensitivity for bioluminescent influenza A virus in vitro using furimazine and FFz. (A) Luminescence measurement using a plate reader. 104 PFU of bioluminescent IAV were mixed with an equal volume of furimazine or FFz at the final concentration, as indicated (n = 3) (B) Photon flux measurement in the IVIS 200 spectrum with 1-, 60-, and 330-second exposures. Tenfold serially diluted bioluminescent IAV were mixed with an equal volume of furimazine or FFz at the final concentration (n = 3). (C) Photon fluxes from each well in Fig. 1B were quantified using Living Image software and plotted as mean ± SD (n = 3). (D) Photon fluxes (330-second exposure) with 1e4 PFU of bioluminescent IAV from the tested wells in Fig. 1B were compared using one-way ANOVA with Sidak’s multiple comparisons test (n = 3). For all panels, data are reported as mean ± SD. ****P < 0.0001; *P < 0.05; ns, not significant.
Fig 2
Fig 2
Time-dependent decay of the flux and signal-to-noise ratio from bioluminescent influenza A virus using furimazine and FFz on the in vivo imaging system (IVIS). (A) Decay of the photon flux over time from 106 PFU of bioluminescent IAV, measured every minute from each well in a 96-well plate using IVIS and normalized to the flux signal at the initial 1-minute time point (n = 3). (B) Signal-to-noise ratio of 106 PFU of bioluminescent IAV, measured every minute from each well (n = 3). (C) Signal-to-noise ratio at 5 minutes for 106 PFU of bioluminescent IAV (n = 3). For all panels, data are reported as mean ± SD (n = 3). ****P < 0.0001; **P < 0.01; ns, not significant.
Fig 3
Fig 3
Cytotoxicity of furimazine and FFz in A549 cells. (A) Cytotoxicity assessment in human lung epithelial cells (A549). Cells were treated with two-fold serial dilutions of furimazine or FFz at the indicated final concentrations. After a 2-day incubation at 37°C, cytotoxicity was observed under an inverted microscope by comparing the treated cells with mock-treated controls. Representative images from triplicate experiments are shown. (B) Sigmoidal four-parameter logistic model analysis for determining the median lethal concentration (LC50) of furimazine and FFz in A549 cells. Data are presented as mean ± SD (n = 3). When administered to 6- to 8-week-old female mice at doses of 0.5 mM furimazine and 0.375 mM FFz, the compounds are expected to be diluted approximately tenfold, resulting in final concentrations of 0.05 mM furimazine (gray dashed line) and 0.0375 mM FFz (teal dashed line). The corresponding cell viabilities at these concentrations are 79% and 98%, respectively. The best-fit LC50 values for furimazine and FFz are 0.081 mM and 0.25 mM, respectively.
Fig 4
Fig 4
Optimization of FFz for detecting bioluminescent influenza A virus in mice. (A) Representative bioluminescent images of mice infected with 200 PFU of bioluminescent IAV, taken at 5 and 6 DPI, using retro-orbital administration of 0.05 mM furimazine, 0.015 mM FFz, and 0.0375 mM FFz (n = 3 per substrate conditions). (B) Photon flux signals at 5 and 6 DPI. Note that one mouse from the 0.0375 mM FFz group at 6 DPI was excluded due to signal saturation caused by nose bleeding following retro-orbital administration of the substrate. (C) Comparison of exposure times: 10, 60, and 330 seconds. A mouse infected with 200 PFU of bioluminescent IAV at 4 DPI was imaged continuously at each exposure time. Strong background noise was observed at the 10-second exposure, which was reduced at the 60-second exposure. Total flux was measured from the region of interest in the left lung using Living Image software (version 4.8). The sum of flux over time was then calculated by multiplying the total flux by the respective exposure time. (D) Background noise from respiratory organs: nasal turbinates, trachea, and lung, using 0.05 mM furimazine or 0.0375 mM FFz. Mock-infected mice were imaged with each substrate for 10-, 60-, and 330-second exposures (n = 6 for 0.05 mM furimazine; n = 28 for 0.0375 mM FFz). (E) Background noise measured during the 330-second exposure in (D) was compared between the two groups. (F) A constant bioluminescent source (XPM-2 Phantom mouse) was exposed for 0.2 seconds across different fields of view: 22.8 cm2, 13.4 cm2, and 6.6 cm2. Representative images from three separate exposures are shown. (G) Quantified photon flux for each field of view was normalized to the flux value obtained from the 6.6 cm2 field of view (n = 3). For all panels, data are reported as mean ± SD. ****P < 0.0001; *P < 0.05; ns, not significant.
Fig 5
Fig 5
Impact of in vivo bioluminescent imaging using furimazine and FFz on influenza A virus pathogenicity in mice. (A) Survival curves comparing mice subjected to no bioluminescent imaging, imaging with furimazine (0.05 mM), or FFz (0.0375 mM) via retro-orbital administration during lethal infection (2,000 or 200 PFU) and sublethal infection (20 PFU) (n = 4). No significant differences in survival rates were observed across the groups (log-rank test). The 50% mouse lethal dose (MLD50) was consistently 63 PFU. (B) BW changes relative to initial BW compared among substrate conditions for both lethal and sublethal infections (n = 4). Data are presented as mean ± SD. Statistical analysis was performed using two-way ANOVA with Sidak’s multiple comparisons test. **P < 0.01; *P < 0.05; ns, not significant.
Fig 6
Fig 6
Comparison of furimazine and FFz in bioluminescent imaging of influenza A virus-infected mice. (A) Bioluminescent imaging of mice infected with bioluminescent IAV at 20, 200, or 2,000 PFU from 2 to 8 DPI, expressed as radiance (photons/sec/cm²/sr). Each column of representative images was taken longitudinally from the same mouse (n = 4 per group). Mice losing more than 25% of their initial BW were euthanized after bioluminescent imaging. (B) Relative photon flux in each respiratory organ was calculated by normalizing bioluminescent photon flux to the mean flux from mock-infected mice, as shown in Fig. 4E. The relative flux measured with 0.0375 mM FFz was higher than with 0.05 mM furimazine. Consistent with our previous study (1), the relative flux of furimazine and FFz increased more than tenfold (tangerine-colored line) in all lethal dose groups (200 and 2,000 PFU), whereas in the sublethal dose group (20 PFU), the relative flux remained below tenfold across the nasal turbinates, trachea, and lung. Data are shown as median ±95% CI. Statistical analysis was performed using the Wilcoxon signed-rank test. **P < 0.01; *P < 0.05. (C) Nonparametric Spearman correlations for relative flux between furimazine and FFz across different infectious dose groups and respiratory organs. The number of data points for comparison: 19 for each of the nasal turbinates, trachea, and lung.
Fig 7
Fig 7
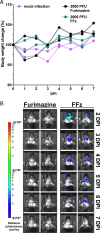
Comparison of furimazine and FFz in bioluminescent imaging of influenza A virus in the mouse brain. (A) Mice were intracerebrally infected with 2,000 PFU of bioluminescent IAV on the left side of the cranium. BW was monitored and compared between mock-infected mice and those infected and imaged using either furimazine or FFz (n = 2). BW data are presented for individual mice. (B) Bioluminescent imaging from a dorsal view, showing the replication of bioluminescent IAV following intracerebral infection from 2 to 7 DPI, expressed as radiance (p/sec/cm²/sr). Each column of images was taken longitudinally from the same mouse (n = 2).

References

    1. Kim JH, Bryant H, Fiedler E, Cao T, Rayner JO. 2022. Real-time tracking of bioluminescent influenza A virus infection in mice. Sci Rep 12:3152. doi:10.1038/s41598-022-06667-w - DOI - PMC - PubMed
    1. Czakó R, Vogel L, Lamirande EW, Bock KW, Moore IN, Ellebedy AH, Ahmed R, Mehle A, Subbarao K. 2017. In vivo imaging of influenza virus infection in immunized mice. mBio 8:e00714-17. doi:10.1128/mBio.00714-17 - DOI - PMC - PubMed
    1. Heaton NS, Leyva-Grado VH, Tan GS, Eggink D, Hai R, Palese P. 2013. In vivo bioluminescent imaging of influenza A virus infection and characterization of novel cross-protective monoclonal antibodies. J Virol 87:8272–8281. doi:10.1128/JVI.00969-13 - DOI - PMC - PubMed
    1. Karlsson EA, Meliopoulos VA, Savage C, Livingston B, Mehle A, Schultz-Cherry S. 2015. Visualizing real-time influenza virus infection, transmission and protection in ferrets. Nat Commun 6:6378. doi:10.1038/ncomms7378 - DOI - PMC - PubMed
    1. Tran V, Moser LA, Poole DS, Mehle A. 2013. Highly sensitive real-time in vivo imaging of an influenza reporter virus reveals dynamics of replication and spread. J Virol 87:13321–13329. doi:10.1128/JVI.02381-13 - DOI - PMC - PubMed

LinkOut - more resources