. 2025 Mar 4;13(3):e0088524.
doi: 10.1128/spectrum.00885-24. Epub 2025 Jan 27.

Ectopic overexpression of Plasmodium falciparum DNA-/RNA-binding Alba proteins misregulates virulence gene homeostasis during asexual blood development

Affiliations

Ectopic overexpression of Plasmodium falciparum DNA-/RNA-binding Alba proteins misregulates virulence gene homeostasis during asexual blood development

Dimple Acharya et al. Microbiol Spectr. .

Abstract

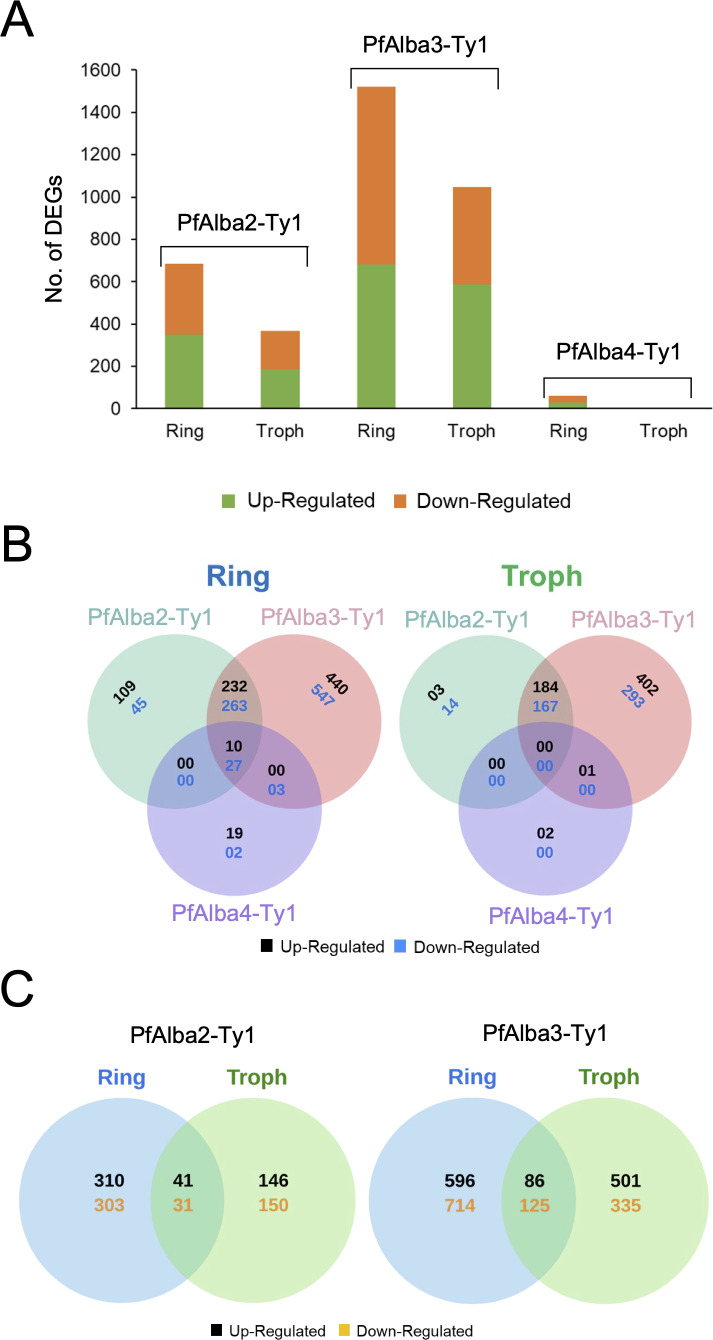
Alba domain-containing proteins are ubiquitously found in archaea and eukaryotes. By binding to either DNA, RNA, or DNA:RNA hybrids, these proteins function in genome stabilization, chromatin organization, gene regulation, and/or translational modulation. In the malaria parasite Plasmodium falciparum, six Alba domain proteins PfAlba1-6 have been described, of which PfAlba1 has emerged as a "master regulator" of translation during parasite intra-erythrocytic development (IED). Given that a tight control of gene expression is especially important during IED, when malaria pathogenesis manifests, in this study, we focus on three other P. falciparum Albas, PfAlba2-4. Because genetic manipulation of the genomic loci of PfAlba2-4 was unsuccessful, we overexpressed each of these proteins from an episome under a strong constitutive promoter. We observed that PfAlba2 or PfAlba3 overexpression strongly reduced parasite growth and impacted IED stage transitions. In contrast, elevated levels of PfAlba4 were well-tolerated by the parasite. In keeping with this, differential gene expression analysis using RNA-seq of PfAlba2 or PfAlba3 overexpressing strains revealed a significant misregulation of mRNAs encoding virulence factors, such as those related to erythrocyte invasion; a general repression of var gene expression was also apparent. PfAlba4 overexpression, on the other hand, did not significantly perturb the steady-state transcriptome of IED stages and appeared to enhance var mRNA levels. Moreover, distinct sets of genes were targeted by each PfAlba for regulation. Taken together, this study highlights the nonredundant roles of PfAlba proteins in the P. falciparum IED, emphasizing their importance in subtelomeric chromatin biology and RNA regulation.IMPORTANCEThe malaria parasite Plasmodium falciparum tightly controls the expression of its genes at the epigenetic, transcriptional, post-transcriptional, and translational levels to synthesize essential proteins, including virulence factors, in a timely and spatially coordinated manner. A family of six proteins implicated in this process is called PfAlba, characterized by the presence of the DNA-, RNA- or DNA:RNA hybrid-binding Alba domain. To better understand the cellular pathways regulated by this protein family, we overexpressed three PfAlbas during P. falciparum intra-erythrocytic growth and found that high levels of PfAlba2 and PfAlba3 were detrimental to parasite development. This was accompanied by significant changes in the parasite's transcriptome, either with regards to mRNA steady-state levels or expression timing. PfAlba4 overexpression, on the other hand, was well-tolerated by the parasite. Overall, our results delineate specific pathways targeted by individual PfAlbas for regulation and link PfAlba2/PfAlba3 to mutually exclusive expression of the virulence-promoting surface antigen PfEMP1.

Keywords: Alba domain; DNA-binding proteins; Plasmodium falciparum; RNA-binding proteins; RNA-seq; gene regulation; transcriptomics.


Conflict of interest statement

The authors declare no conflict of interest.

Figures

Fig 1
Fig 1
C-terminally tagged PfAlba2-Ty1, PfAlba3-Ty1, and PfAlba4-Ty1 were successfully expressed from an episome in P. falciparum asexual blood stages. (A) Schematic representation of the domain organization of the six Alba proteins of P. falciparum. (B) 3D7 parasites transfected with the pLN-PfAlba2-Ty1, pLN-PfAlba3-Ty1, or pLN-PfAlba4-Ty1 plasmids were grown in the presence of 5 mg/mL of blasticidin-S (BS), their genomic DNA harvested, and used with the indicated primers in PCRs to confirm the uptake of the episome. Primer pairs targeted either the genomic Alba locus (p1 +p2) or different regions of the episome (p3 +p4 and p5 +p6) as shown in the scheme (top panel), which is not drawn to scale. The DNA size marker corresponds to the GeneRuler 1 kb Plus DNA Ladder (Fermentas, Thermo Fisher Scientific). (C) PfAlba2-Ty1, PfAlba3-Ty1, or PfAlba4-Ty1 proteins were detected in protein lysates prepared from the indicated transfectant lines by Western blotting with mouse anti-Ty1 antibodies. PfHsp70 served as a loading control. (D) Immunofluorescence assays (IFAs) were used to determine the localization of PfAlba2-Ty1, PfAlba3-Ty1, and PfAlba4-Ty1 in ring (R), trophozoite (T), and schizont (S) stages of the indicated transfectant lines. Antibodies used included rabbit anti-Ty1 (red). Nuclei were labeled with DAPI (blue). Scale bar represents 5 µM. All of the cultures used for Western blotting and IFAs contained 5 µg/mL of blasticidin-S.
Fig 2
Fig 2
Overexpression of PfAlba2 or PfAlba3 adversely affects intra-erythrocytic growth of P. falciparum. (A) The growth of 3D7 + empty vector, 3D7 + PfAlba2-Ty1, 3D7 + PfAlba3-Ty1, and 3D7 + PfAlba4-Ty1 parasites was measured by flow cytometry for 5 days in the presence of the indicated concentrations of BS (in μg/mL). The y-axis denotes the percentage parasitemia at each time point. Data represent the means of a minimum of three independent experiments ± SEM (error bars). Red arrows indicate growth profiles of the strains at 10 µg/mL BS concentration. (B) The ~48-h IED cycle of the Alba-overexpressing lines was monitored by flow cytometry. The y-axis denotes the percentage of ring or schizont stages at each time point. Data represent the means of a minimum of three independent experiments ± SEM (error bars).
Fig 3
Fig 3
Transcriptomic data quality assessment by sample clustering demarcates the 3D7 + PfAlba2-ty1 and 3D7 + PfAlba3-Ty1 data sets from controls. (A) Schematic representation of the transcriptomics experiment. 3D7 + empty vector, 3D7 + PfAlba2-Ty1, 3D7 + PfAlba3-Ty1, or 3D7 + PfAlba4-Ty1 parasites were grown in white blood cell (WBC)-free blood to ring (8–10 hpi) or trophozoite (28–30 hpi) stages in the presence of 5 µg/mL of blasticidin-S, total RNA harvested, and mRNA enriched and analyzed by strand-specific RNA-seq. Differential gene expression in the Alba-overexpressing lines relative to 3D7 and empty vector transfectants was quantified by DESeq2 analysis. (B) Principal component analysis of normalized read counts of 3D7, 3D7 + empty vector, 3D7 + PfAlba2-Ty1, 3D7 + PfAlba3-Ty1, and 3D7 + PfAlba4-Ty1 ring and trophozoite stage trancriptomes. Meaningful clustering of samples is indicated by dashed lines. (C) Pearson correlation coefficient R analysis of the normalized read counts from RNA-seq analysis of ring (R) and trophozoite (T) stage samples of the 3D7, 3D7 + empty vector, 3D7 + PfAlba2-Ty1, 3D7 + PfAlba3-Ty1, and 3D7 + PfAlba4-Ty1 strains. The color scale indicates the value of the R from 0 to 1. (D) Hours post-infection estimates for the transcriptomic data were obtained by passing the normalized RNA-seq data through the maximum likelihood algorithm developed by Lemieux et al. (53). The left panel shows the HPI estimates within 95% confidence intervals, while the right panel displays the actual likelihoods determined for each sample over the 48-h IED cycle.
Fig 4
Fig 4
PfAlba2 and PfAlba3 overexpression causes significant perturbations to the blood stage transcriptome. (A) Bar graph showing the total number of differentially expressed genes (DEGs) that are up- or downregulated in the indicated transgenic P. falciparum strain relative to controls. (B) Venn diagrams were used to represent the overlap in DEGs between the various Alba-overexpressing strains during ring and trophozoite stages. (C) Venn diagrams were used to represent the overlap in DEGs between ring and trophozoite stages of either 3D7 + PfAlba2-Ty1 or 3D7 + PfAlba3-Ty1 parasites. Troph = Trophozoite.
Fig 5
Fig 5
Mistiming of key cellular developmental processes is linked to PfAlba3 overexpression. (A & B) Volcano plot of differentially expressed genes in (A) ring and (B) trophozoite stages of 3D7 + PfAlba3-Ty1 as compared to controls. Genes with |log2FC| > 1.5 and FDR < 0.05 values were considered to be differentially expressed (green dots). Pink dots indicate genes with |log2FC| > 1.5 but FDR > 0.05, purple dots indicate genes with |log2FC| < 1.5 but FDR < 0.05, and gray dots denote genes that are not changed significantly upon PfAlba3 overexpression. FC = fold change; FDR = false discovery rate. (C & D) Gene Ontology (GO) enrichment analysis in three categories, Cellular Component, Molecular Function, and Biological Process, for significantly up and downregulated genes in the (C) ring and (D) trophozoite stages of 3D7 + PfAlba3-Ty1 parasites. GO enrichment was performed after removing genes belonging to multigene families such as var and rifin. The number of genes enriched for each GO term relative to background is indicated on the right side of the y-axis, while the -log10(padj) of each GO term is represented on the left side of the y-axis. Note that p-adj is the same as FDR.
Fig 6
Fig 6
Global var transcriptional repression is apparent in the PfAlba2- and PfAlba3-overexpressing parasites. (A) var gene transcriptional profile in ring stages was assessed by RNA-seq of P. falciparum 3D7 transfected with either PfAlba2-Ty1, PfAlba3-Ty1, or PfAlba4-Ty1 expression plasmids. Empty vector (pLN-Ty1) transfectants served as a control. The steady-state mRNA levels of all 60 var genes is indicated in reads per kilobase of transcript per million or RPKM (y-axis). Two replicates for each sample were analyzed. (B) Total mRNA levels (in RPKM) of the var gene family was calculated for two ring-stage RNA-seq replicates of each indicated strain. Data represent the mean + STDEV.

Similar articles

Cited by

References

    1. Foth BJ, Zhang N, Mok S, Preiser PR, Bozdech Z. 2008. Quantitative protein expression profiling reveals extensive post-transcriptional regulation and post-translational modifications in schizont-stage malaria parasites. Genome Biol 9:R177. doi:10.1186/gb-2008-9-12-r177 - DOI - PMC - PubMed
    1. Wei C, Xiao T, Zhang P, Wang Z, Chen X, Zhang L, Yao M, Chen R, Wang H. 2014. Deep profiling of the novel intermediate-size noncoding RNAs in intraerythrocytic Plasmodium falciparum. PLoS One 9:e92946. doi:10.1371/journal.pone.0092946 - DOI - PMC - PubMed
    1. Bozdech Z, Llinás M, Pulliam BL, Wong ED, Zhu J, DeRisi JL. 2003. The transcriptome of the intraerythrocytic developmental cycle of Plasmodium falciparum. PLoS Biol 1:E5. doi:10.1371/journal.pbio.0000005 - DOI - PMC - PubMed
    1. Le Roch KG, Johnson JR, Florens L, Zhou Y, Santrosyan A, Grainger M, Yan SF, Williamson KC, Holder AA, Carucci DJ, Yates JR III, Winzeler EA. 2004. Global analysis of transcript and protein levels across the Plasmodium falciparum life cycle. Genome Res 14:2308–2318. doi:10.1101/gr.2523904 - DOI - PMC - PubMed
    1. Caro F, Ahyong V, Betegon M, DeRisi JL. 2014. Genome-wide regulatory dynamics of translation in the Plasmodium falciparum asexual blood stages. Elife 3:e04106. doi:10.7554/eLife.04106 - DOI - PMC - PubMed

MeSH terms

LinkOut - more resources