

Distinct Ocular Surface Microbiome in Keratoconus Patients Correlate With Local Immune Dysregulation
- PMID: 39869087
- PMCID: PMC11771523
- DOI: 10.1167/iovs.66.1.60
Distinct Ocular Surface Microbiome in Keratoconus Patients Correlate With Local Immune Dysregulation
Abstract
Purpose: Keratoconus (KC) is characterized by irregular astigmatism along with corneal stromal weakness and is associated with altered immune status. Tissue resident microbiomes are known to influence the immune status in other organs, but such a nexus has not been described in ocular conditions. Therefore, we examined the ocular surface microbiome of patients with KC and correlated it to the immune cell and tear molecular factor profiles.
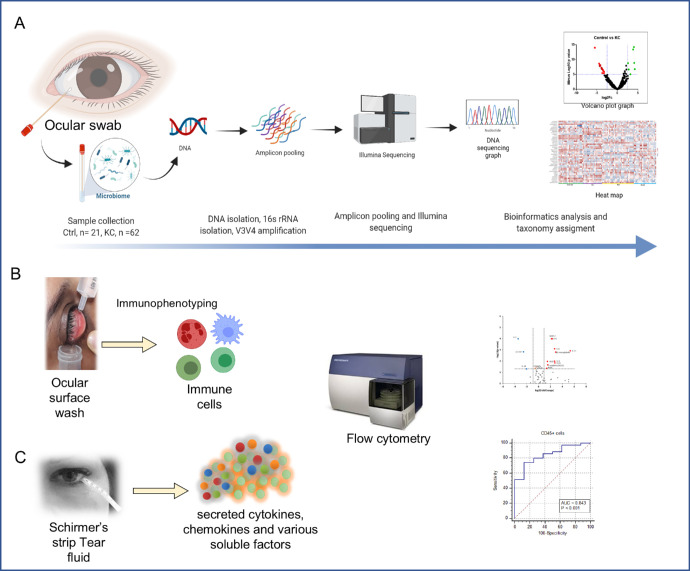
Methods: Sixty-two patients with KC and 21 healthy controls underwent corneal topography analysis and eye examination followed by a collection of Schirmer's strip, ocular surface wash, and ocular surface swabs. Microbiomes were analyzed by extracting DNA from the swabs followed by 16S rRNA gene V3-V4 amplicon sequencing and analyzed using QIIME. Fifty-two molecular factors from Schirmer's strip tear extracts and 11 immune cells from ocular wash were measured using multiplex ELISA and flow cytometry. Alpha diversity, linear discriminant analysis effect size (LEfSe), relative abundance and receiver operating characteristic - area under the curve (ROC-AUC) analysis were performed. Unsupervised clustering at the genus level with clinical parameters, soluble factors, and immune cells was performed.
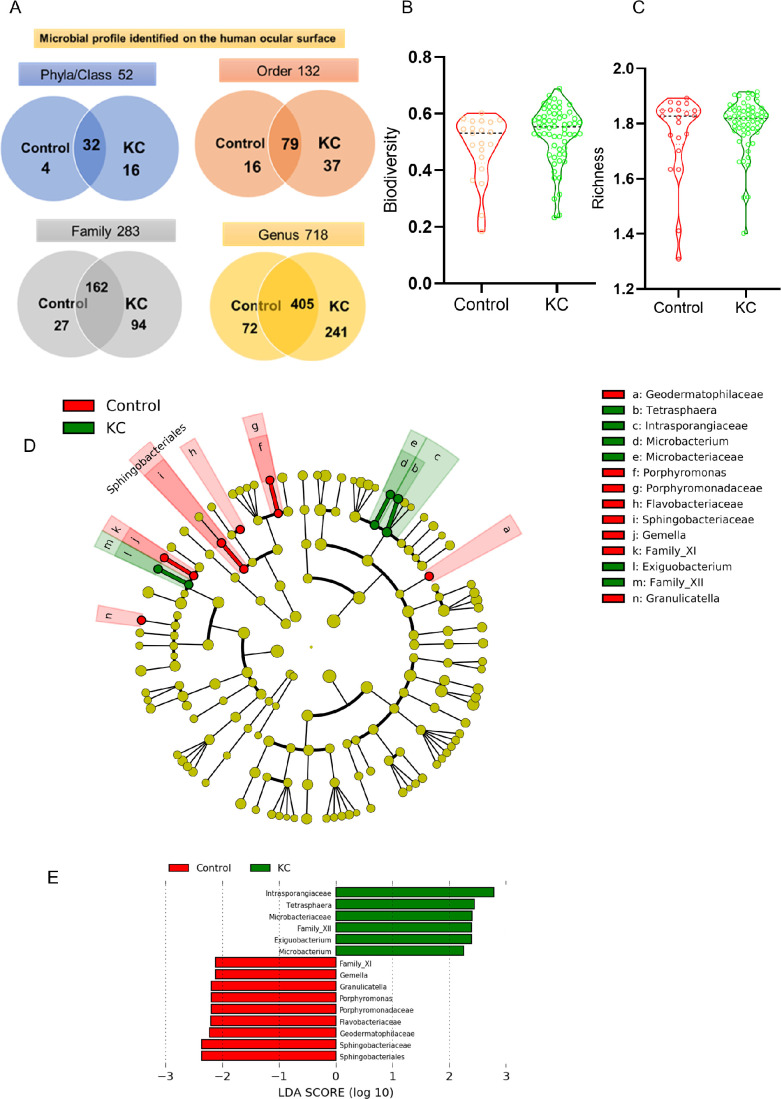
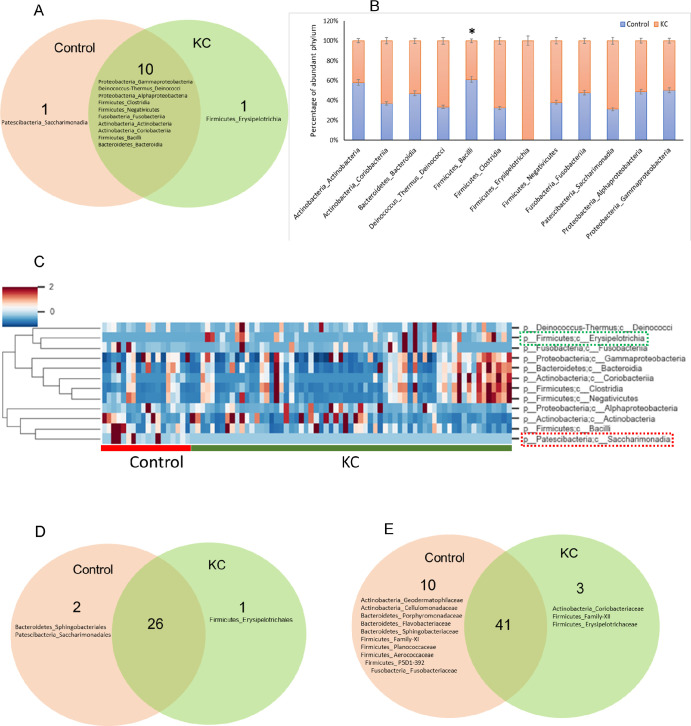
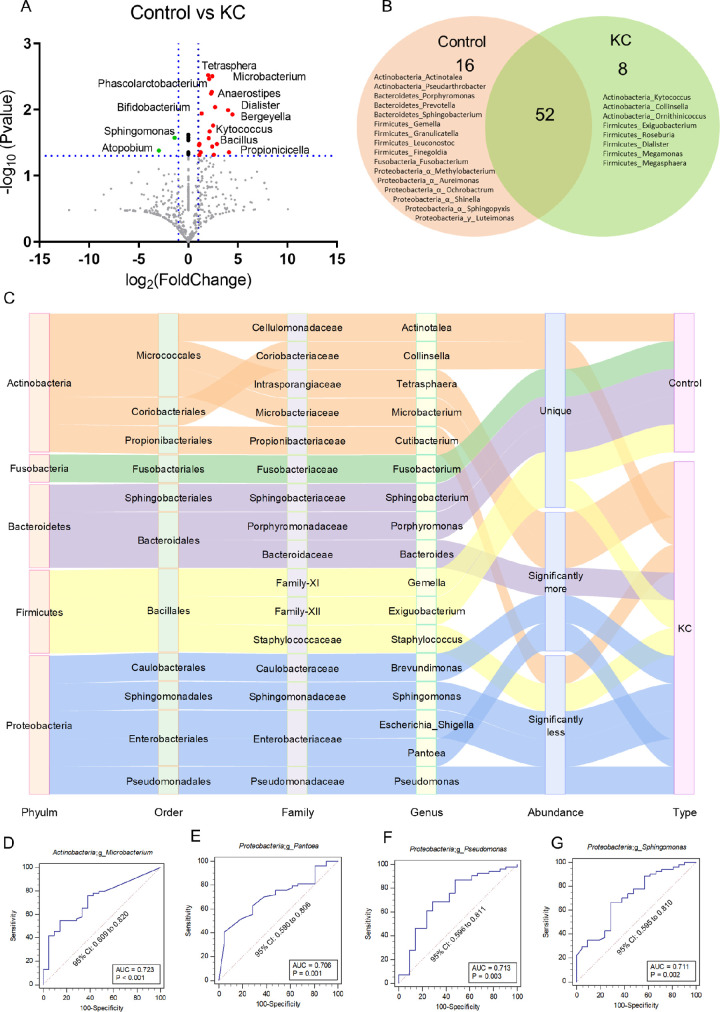
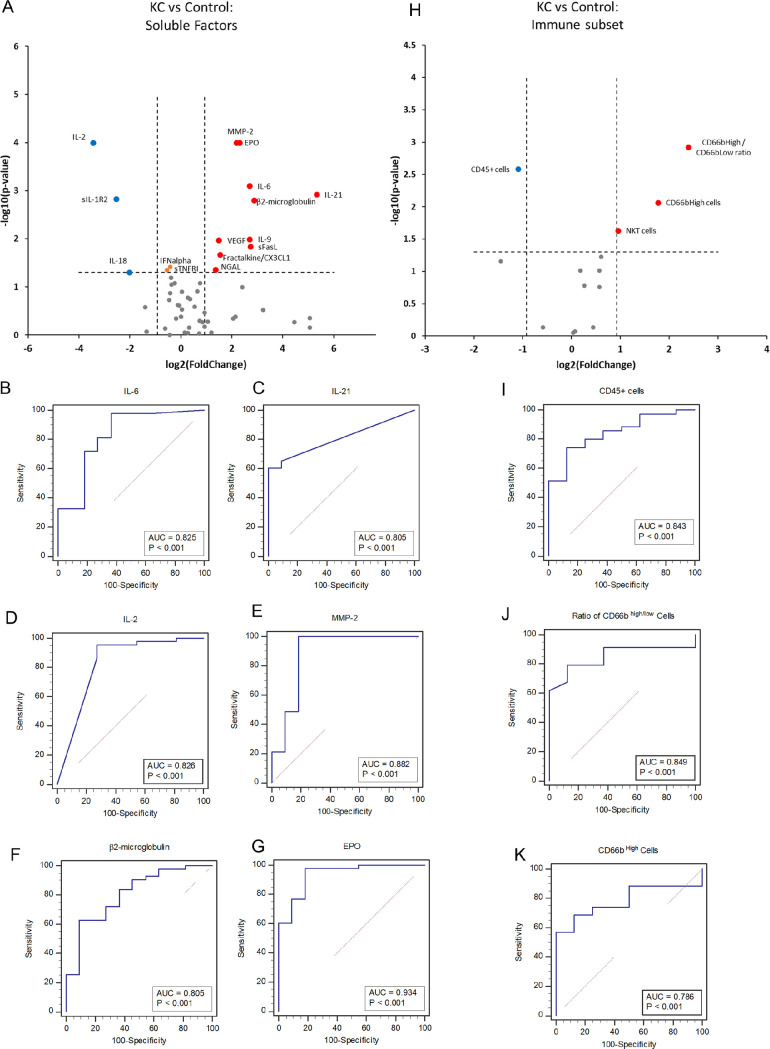
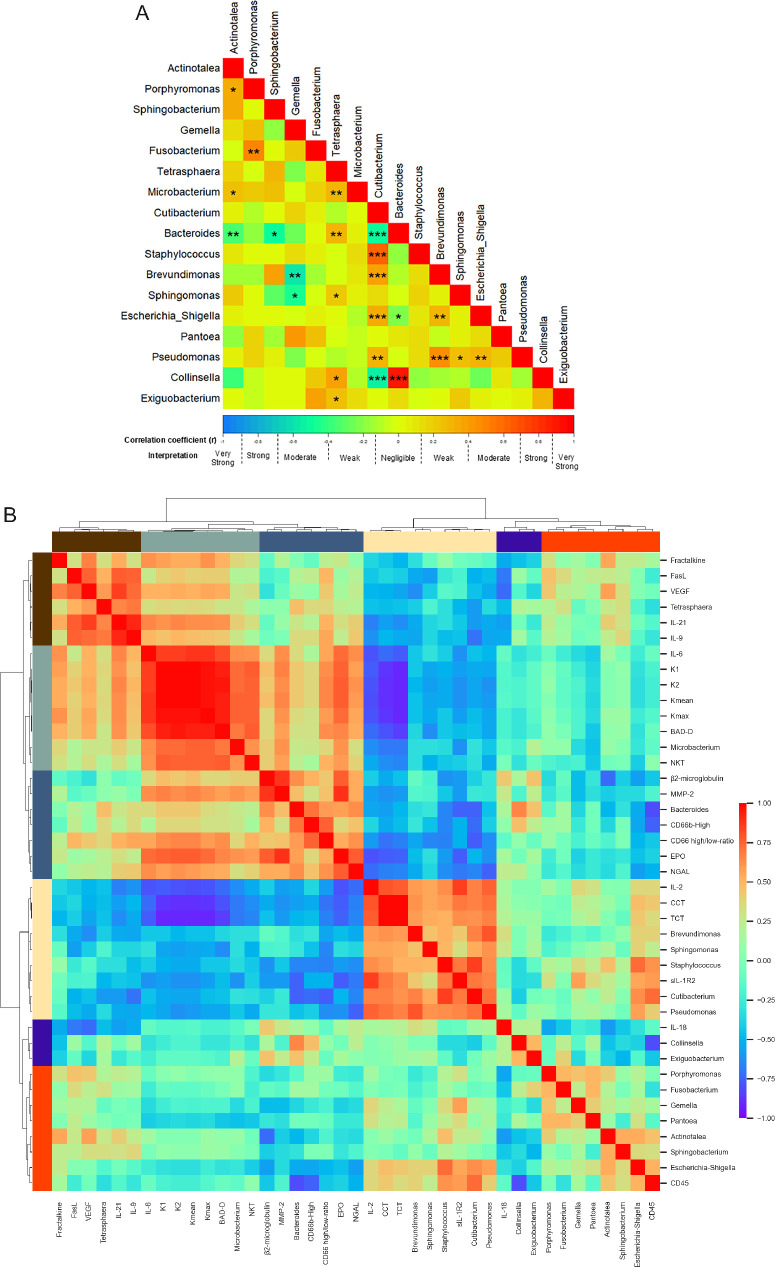
Results: Fifty-two phyla/class, 132 order, 283 family, and 718 genera were identified in our cohort. Alpha diversity indices were comparable between patients with KC and the healthy controls. Dominant phyla across groups were Actinobacteria, Proteobacteria, Firmicutes, and Bacteroidetes. Alphaproteobacteria increased in KC eyes whereas Actinobacteria, Firmicutes_Bacilli reduced compared with the healthy controls. We found a significant positive correlation of Microbacterium, Cutibacterium, and Brevundimonas genera abundance with keratometry and corneal thickness. Levels of IL-21, IL-9, Fractalkine, and VEGF positively correlated with Tetrasphaera (P < 0.05). β2-microglobulin and CD66bhigh cells correlated with Bacteroides (P < 0.05). CD45+ cells correlated with Escherichia_Shigella (P < 0.02).
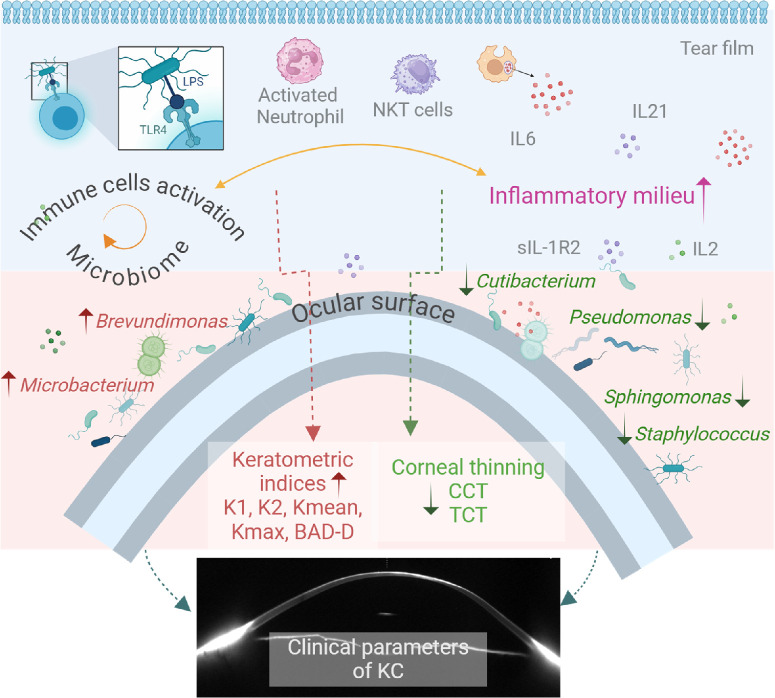
Conclusions: We discovered a unique microbiome signature of KC which correlated to disease grades and secreted molecular factors and immune cells. Therefore, the altered microbiome on the ocular surface may drive immune dysregulation in KC and provide scope for potential interventions in the future.
Conflict of interest statement
Disclosure:
Figures
Similar articles
-
Keratoconus patients exhibit a distinct ocular surface immune cell and inflammatory profile.Sci Rep. 2021 Oct 22;11(1):20891. doi: 10.1038/s41598-021-99805-9. Sci Rep. 2021. PMID: 34686755 Free PMC article.
-
Corneal bacterial microbiome in patients with keratoconus using next-generation sequencing-based 16S rRNA gene analysis.Exp Eye Res. 2023 Mar;228:109402. doi: 10.1016/j.exer.2023.109402. Epub 2023 Jan 31. Exp Eye Res. 2023. PMID: 36736649
-
Elevated expression of matrix metalloproteinase-9 and inflammatory cytokines in keratoconus patients is inhibited by cyclosporine A.Invest Ophthalmol Vis Sci. 2015 Feb 3;56(2):738-50. doi: 10.1167/iovs.14-14831. Invest Ophthalmol Vis Sci. 2015. PMID: 25648341 Clinical Trial.
-
Alterations in the conjunctival surface bacterial microbiome in bacterial keratitis patients.Exp Eye Res. 2021 Feb;203:108418. doi: 10.1016/j.exer.2020.108418. Epub 2020 Dec 23. Exp Eye Res. 2021. PMID: 33359511
-
Characterising the tear bacterial microbiome in young adults.Exp Eye Res. 2022 Jun;219:109080. doi: 10.1016/j.exer.2022.109080. Epub 2022 Apr 17. Exp Eye Res. 2022. PMID: 35443208
Cited by
-
Keratoconus: The Local Manifestation of a Systemic Disease?J Clin Med. 2025 Jun 28;14(13):4587. doi: 10.3390/jcm14134587. J Clin Med. 2025. PMID: 40648961 Free PMC article. Review.
References
-
- Santodomingo-Rubido J, Carracedo G, Suzaki A, Villa-Collar C, Vincent SJ, Wolffsohn JS.. Keratoconus: an updated review. Cont Lens Anterior Eye. 2022; 45: 101559. - PubMed
-
- Gomes JA, Tan D, Rapuano CJ, et al. .. Global consensus on keratoconus and ectatic diseases. Cornea. 2015; 34: 359–369. - PubMed
MeSH terms
Substances
LinkOut - more resources
Full Text Sources
Research Materials
Miscellaneous
