

Correlation among blastocoel fluid DNA level, apoptotic genes expression and preimplantation aneuploidy
- PMID: 39869096
- PMCID: PMC11825185
- DOI: 10.1530/RAF-24-0097
Correlation among blastocoel fluid DNA level, apoptotic genes expression and preimplantation aneuploidy
Abstract
Graphical abstract: The chromosomal status of Day 5 blastocysts was determined based on trophectoderm biopsy for all 24 chromosomes by array comparative genomic hybridization (array-CGH). The blastocoel fluid (BF) was extruded and amplified, and DNA concentration was read by a Qubit fluorometer. Apoptotic gene expression (TNFRSF10B, CASP2, BAX and CASP3) was analyzed by real-time quantitative PCR (RT-qPCR). Our findings suggest BF-DNA may be released in the blastocoel cavity of aneuploidy blastocysts under the influence of the apoptosis mechanism, and it appears that quantifying BF-DNA has the potential to aid in the selection of viable embryos.
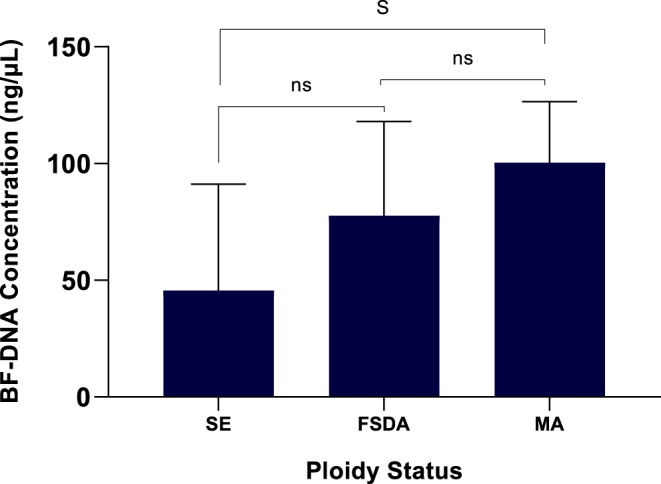
Abstract: It is believed that aneuploid embryos release cell-free DNA (cfDNA) into the blastocyst cavity during the self-correction process through the apoptotic mechanism. This study aimed to develop less invasive methods for predicting ploidy status by investigating how ploidy status affects blastocoel fluid DNA (BF-DNA) levels and apoptotic gene expression as indicators of embryo viability. Human blastocysts were classified into three groups; survivable embryo (SE), fatal single and double aneuploidy (FSDA) and multiple aneuploidy (MA) using array comparative genomic hybridization (array-CGH) by trophectoderm biopsy. Following BF aspiration and whole genome amplification, BF-DNA level was quantified. Apoptotic activity was assessed by measuring the genes TNFRSF10B, CASP2, BAX and CASP3 using real-time quantitative PCR. Day-5 intracytoplasmic sperm injection blastocysts were scored according to the Gardner and Schoolcraft system. BF-DNA levels were significantly higher in the MA vs SE group (P = 0.01), while these were not statistically significant differences between the MA and FSDA groups or between the FSDA and SE groups, P = 0.17 and P = 0.38, respectively. TNFRSF10B, CASP2 and CASP3 were overexpressed in the MA and FSDA groups compared to SE, while BAX was downregulated. We found a significant correlation between the amount of BF-DNA and apoptosis marker genes. No significant correlation was found between embryo morphology score and BF-DNA level, BF volume or apoptosis marker gene expression levels. We observed that the correlation between apoptotic activity and BF-DNA levels is influenced by the embryo's ploidy status. These findings suggest that BF-DNA level evaluation can be applicable in selecting viable embryos for transfer.
Lay summary: Preimplantation genetic testing helps doctors choose healthy human embryos for transfer during fertility treatments, but it can be expensive, invasive and time-consuming. Recently, scientists have found a less invasive way to study embryos by looking at DNA in a fluid inside the embryo's cavity. This fluid may give us clues about how embryos try to fix problems with their chromosomes through a natural process of cell death. Our study shows that the amount of DNA in this fluid and the activity of some genes are influenced by chromosomal problems in the embryo. We also discovered that just looking at an embryo under a microscope is not enough to evaluate its genetic health. Our findings suggest that measuring the DNA in this fluid may be a promising approach for picking the best embryos for transfer.
Keywords: aneuploidy; apoptosis; blastocoel fluid; cell-free DNA; gene expression.
Conflict of interest statement
The authors declare that there is no conflict of interest that could be perceived as prejudicing the impartiality of the research reported.
Figures


Similar articles
-
Deoxyribonucleic acid detection in blastocoelic fluid: a new predictor of embryo ploidy and viable pregnancy.Fertil Steril. 2019 Jan;111(1):77-85. doi: 10.1016/j.fertnstert.2018.09.016. Epub 2018 Dec 5. Fertil Steril. 2019. PMID: 30528055
-
Evaluation of utilization of amplified blastocoel fluid DNA gel electrophoresis band intensity as an additional minimally invasive approach in embryo selection: A cross-sectional study.Int J Reprod Biomed. 2024 Jan 10;22(11):907-918. doi: 10.18502/ijrm.v22i11.17823. eCollection 2024 Nov. Int J Reprod Biomed. 2024. PMID: 39866585 Free PMC article.
-
Apoptotic qPCR gene expression array analysis demonstrates proof-of-concept for rapid blastocoel fluid-conditioned media molecular prediction.J Assist Reprod Genet. 2022 Jul;39(7):1515-1522. doi: 10.1007/s10815-022-02510-3. Epub 2022 May 11. J Assist Reprod Genet. 2022. PMID: 35543804 Free PMC article.
-
Non-invasive preimplantation genetic testing (niPGT): the next revolution in reproductive genetics?Hum Reprod Update. 2020 Jan 1;26(1):16-42. doi: 10.1093/humupd/dmz033. Hum Reprod Update. 2020. PMID: 31774124 Review.
-
Blastocoel fluid as an alternative source of DNA for minimally invasive PGT and biomarker of embryo competence.Reprod Biomed Online. 2024 Oct;49(4):104322. doi: 10.1016/j.rbmo.2024.104322. Epub 2024 Jun 11. Reprod Biomed Online. 2024. PMID: 39121560 Review.
References
MeSH terms
Substances
LinkOut - more resources
Full Text Sources
Research Materials
Miscellaneous
