. 2025 Jan 27;21(1):e1012831.
doi: 10.1371/journal.ppat.1012831. eCollection 2025 Jan.

The transcriptional and translational landscape of HCoV-OC43 infection

Affiliations

The transcriptional and translational landscape of HCoV-OC43 infection

Stefan Bresson et al. PLoS Pathog. .

Abstract

The coronavirus HCoV-OC43 circulates continuously in the human population and is a frequent cause of the common cold. Here, we generated a high-resolution atlas of the transcriptional and translational landscape of OC43 during a time course following infection of human lung fibroblasts. Using ribosome profiling, we quantified the relative expression of the canonical open reading frames (ORFs) and identified previously unannotated ORFs. These included several potential short upstream ORFs and a putative ORF nested inside the M gene. In parallel, we analyzed the cellular response to infection. Endoplasmic reticulum (ER) stress response genes were transcriptionally and translationally induced beginning 12 and 18 hours post infection, respectively. By contrast, conventional antiviral genes mostly remained quiescent. At the same time points, we observed accumulation and increased translation of noncoding transcripts normally targeted by nonsense mediated decay (NMD), suggesting NMD is suppressed during the course of infection. This work provides resources for deeper understanding of OC43 gene expression and the cellular responses during infection.


Conflict of interest statement

The authors declare no competing interests.

Figures

Fig 1
Fig 1. Experimental design and overview of viral transcription.
(a) Overall design of the study. MRC-5 lung fibroblast cells were infected with OC43 virus at 33°C at a MOI of 7. RNA samples were collected prior to infection (−1) and at 1.5, 3, 6, 9, 12, 18, 24, and 30 hours post infection (hpi). Supernatants were also collected to assay for virion release (not shown). At most timepoints, samples were also prepared for cycloheximide (CHX)-based Riboseq. Harringtonine (HAR)-based Riboseq samples were prepared only from uninfected cells and 6 hpi. Alternatively, cells were inoculated with heat-inactivated virus, and RNA samples were analyzed at 3, 6, and 18 hpi. (b) The relative proportion of human and viral RNA throughout the course of infection. H.I. = heat inactivated. (c) Plot showing the expression kinetics of viral gRNA throughout the time course. (d) Estimated virion release per cell per hour quantified using RT-qPCR for the viral genome. Error bars show standard deviation of the mean (n = 3). (e) Genome coverage tracks showing RNAseq reads across the OC43 genome. The numbers to the right indicate the scale in RPM. The structure of the full-length genomic RNA is shown below. A TRS-Body (TRS-B) is present just upstream of each of the seven ORFs in the 3ʹ end of the genome. The leader TRS (TRS-L) is located at the 5ʹ end of the genome. Left: The 5ʹ end of the genome is enlarged for clarity. (f) Coronavirus transcription/replication cycle. The template switch event is represented by the curved grey line, and the resulting junction sites are identified by sequence reads spanning the junction. (g) Schematic representation of the canonical (+)sgRNAs. The leader sequence is shown in black.
Fig 2
Fig 2. OC43 replication kinetics and subgenomic RNA expression.
(a) Reproducibility of sgRNA mapping for two 30 hpi timepoints. Each dot represents the normalized read counts of a junction in replicates 1 (x-axis) and 2 (y-axis). Noncanonical transcript junctions are shown in grey. (b) Plots showing the expression kinetics of genomic RNA and individual sgRNAs throughout the time course. Lines show the average across 3–4 replicates. (c) Histogram indicating the relative abundance of full-length genomic RNA and the seven sgRNAs at each time point. (d) Sequence context of the transcription junction site for the canonical sgRNA species. Green residues are complementary to the TRS-L, and red residues show mismatches with the TRS-L. Yellow triangles indicate the junction site. (e) The consensus TRS-B sequence. (f) Schematic representation of the 5ʹ UTR regions for each canonical sgRNA. (g) Sashimi plots mapping discontinuous transcription events at 30 hpi. Leader-body canonical junctions are shown in blue, leader-body noncanonical junctions are shown in green, and body-body noncanonical junctions are shown in red.
Fig 3
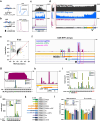
Fig 3. OC43 translation and protein expression.
(a and b) Schematic outline of CHX- and HAR-based ribosome profiling. See text for details. Right: Polysome profiles following treatment with either CHX or HAR. With CHX treatment most ribosomes are found in polysomes, whereas after 10m HAR treatment to specifically block at initiation only monosomes remain. Polysome profiles were generated from uninfected cells. (c) Distribution of CHX RPFs (blue) and HAR RPFs (pink) across the viral N gene at 6 hpi. Total RNA (black) is included as a control. (d) A log-scale representation of CHX RPFs across the entire viral genome. The scale bar below the annotation highlights the regions displayed in (f). (e) Comparison between RNA abundance and translational output for viral and cellular genes. (f) Distribution of HAR RPFs across the sgRNA region of the genome. Prominent peaks are annotated according to their probable function. (g) A close-up view of the HAR RPF peak internal to the M gene. The inferred P-site mapping is shown below. Below: the codon and amino acid sequence for the full length M gene and the putative truncation variant. (h) A close-up view of the HAR RPF peaks across the NS5A and E genes. (i and j) P-site mapping for CHX RPFs across the first NS5A uORF (i) and E uORF (j). Inset: Summed read-frame frequencies across the entire uORF. Error bars show standard deviation of the mean (n = 4). Below: the codon and amino acid sequence for each uORF. (k) Schematic outline of the viral 5ʹUTR-luciferase reporter constructs. Each construct included the indicated viral 5ʹUTR and first 18 nt of the corresponding viral CDS fused to firefly luciferase (FLuc). (l) Bar graph showing the RNA abundance (left) and luciferase activity (right) for each reporter construct. Each FLuc construct was cotransfected with Renilla luciferase (RLuc) for normalization. Error bars show the standard error around the mean (n = 3). Asterisks show statistically significant difference relative to the NS2A reporter: * p < 0.05, ** p < 0.01.
Fig 4
Fig 4. Changes to the host transcriptome and translatome during infection.
(a) Principal component analysis (PCA) for different replicates and timepoints. (b) Heatmap showing the changes in RNA abundance throughout the time course. The heatmap shows the most significantly upregulated transcripts (by p-value). (c) GO enrichment analysis of the top 300 upregulated genes at 30 hpi. The size of each circle is proportional to the number of genes and the color shows the statistical significance. (d) Heatmap showing the changes in RNA abundance, translation, and translation efficiency (TE) across all genes associated with ER-related GO terms in (c). (e) Changes in mRNA abundance and translation during the infection time course for two ER stress genes. Error bars show the standard deviation around the mean (n = 3–4). Asterisks show statistically significant difference between uninfected and infected samples: * p < 0.05, ** p < 0.01, *** p < 0.001.
Fig 5
Fig 5. Cellular NMD targets are stabilized and translated during infection.
(a) Volcano plot showing translationally upregulated and downregulated mRNAs at 30 hpi. (b) Ribosome density (blue) and RNA abundance (grey) across EIF4A2. Numbers to the right indicate the scale in RPM. Note that EIF4A2 incorporates an unannotated exon (dashed red box) that includes a premature termination codon (PTC). (c) Changes in RNA abundance of the spliced and unspliced isoforms of EIF4A2. Error bars show standard deviation around the mean (n = 3–4). (d) Volcano plot showing translationally upregulated (red) or downregulated (blue) lncRNAs at 30 hpi. (e) Ribosome density (blue) and RNA abundance (grey) across SNHG1. Numbers to the right indicate the scale in RPM. The location of the first termination codon is indicated as PTC. (f) Changes in RNA abundance of the spliced and unspliced isoforms of SNGH1. Error bars show standard deviation around the mean (n = 3–4). Asterisks show statistically significant difference between the spliced and unspliced isoform: * p < 0.05, ** p < 0.01, *** p < 0.001.

References

    1. Forni D, Cagliani R, Clerici M, Sironi M. Molecular evolution of human coronavirus genomes. Trends Microbiol. 2017;25(1):35–48. doi: 10.1016/j.tim.2016.09.001 PMCID: PMC7111218 - DOI - PMC - PubMed
    1. Hartenian E, Nandakumar D, Lari A, Ly M, Tucker JM, Glaunsinger BA. The molecular virology of coronaviruses. J Biol Chem. 2020;295(37):12910–34. doi: 10.1074/jbc.REV120.013930 PMCID: PMC7489918 - DOI - PMC - PubMed
    1. Kim D, Kim S, Park J, Chang HR, Chang J, Ahn J, et al.. A high-resolution temporal atlas of the SARS-CoV-2 translatome and transcriptome. Nat Commun. 2021;12(1):5120. doi: 10.1038/s41467-021-25361-5 PMCID: PMC8387416 - DOI - PMC - PubMed
    1. Finkel Y, Mizrahi O, Nachshon A, Weingarten-Gabbay S, Morgenstern D, Yahalom-Ronen Y, et al.. The coding capacity of SARS-CoV-2. Nature. 2021;589(7840):125–30. doi: 10.1038/s41586-020-2739-1 - DOI - PubMed
    1. Irigoyen N, Firth AE, Jones JD, Chung BY-W, Siddell SG, Brierley I. High-resolution analysis of coronavirus gene expression by RNA sequencing and ribosome profiling. PLoS Pathog. 2016;12(2):e1005473. doi: 10.1371/journal.ppat.1005473 PMCID: PMC4769073 - DOI - PMC - PubMed