. 2025 Jan 27;20(1):e0316676.
doi: 10.1371/journal.pone.0316676. eCollection 2025.

Effect of intra- and inter-specific plant interactions on the rhizosphere microbiome of a single target plant at different densities

Affiliations

Effect of intra- and inter-specific plant interactions on the rhizosphere microbiome of a single target plant at different densities

Derek R Newberger et al. PLoS One. .

Abstract

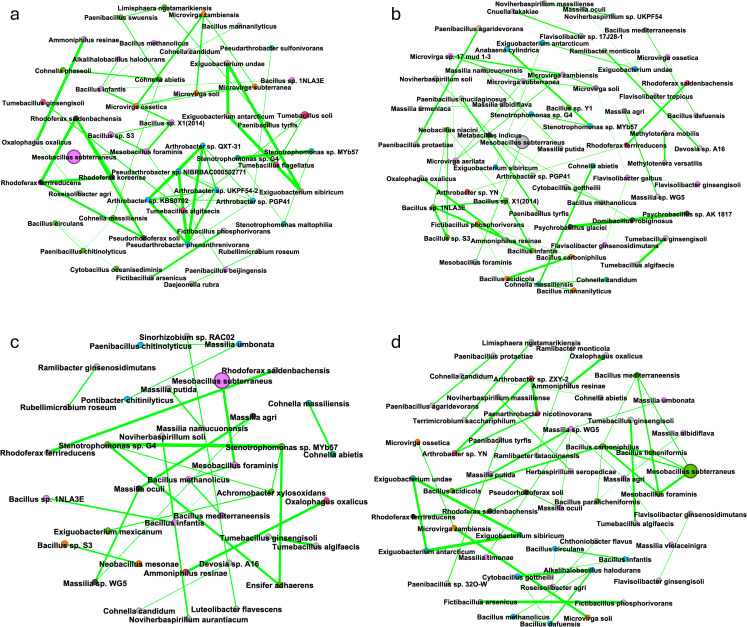
Root and rhizosphere studies often focus on analyzing single-plant microbiomes, with the literature containing minimum empirical information about the shared rhizosphere microbiome of multiple plants. Here, the rhizosphere of individual plants was analyzed in a microcosm study containing different combinations and densities (1-3 plants, 24 plants, and 48 plants) of cover crops: Medicago sativa, Brassica sp., and Fescue sp. Rhizobacterial beta diversity was reduced by increasing plant density for all plant mixtures. Interestingly, plant density had a significant influence over beta diversity while plant diversity was found to be a less important factor since it did not have a significant change. Regardless of plant neighbor identity or density, a low number of rhizobacteria were strongly associated with each target species. Nonetheless, a few bacterial taxa were shown to have conditional associations such as being enriched within only high plant densities, which may alleviate plant competition between these species. Also, we found evidence of bacterial sharing of nitrogen fixers from alfalfa to fescue. Although rhizosphere bacterial networks had overlapping bacterial modules, the modules showing the largest percentage of the network changed depending on plant neighbor. In summary, this study found that for the most part plants maintained their rhizosphere microbiome despite escalating plant-plant competition.


Conflict of interest statement

The authors have declared that no competing interests exist.

Figures

Fig 1
Fig 1. Differential abundance comparisons between an individual plant (alfalfa, brassica, and fescue) rhizosphere and rhizospheres of plants grown in medium density (24 plants) and high density (48 plants) monocultures.
On the horizontal axis, the first letter denotes plant species (A: alfalfa, B: brassica, F: fescue) and number denotes the total number of plants per treatment (1 plant, 24 plants, and 48 plants). Blue denotes a negative log2 fold change ratio (decrease in abundance), while red denotes a positive log2 fold change ratio (increase in abundance).
Fig 2
Fig 2. Differential abundance comparisons of alfalfa rhizospheres when grown alone (1 plant) versus in medium density (24 plants) and high density (48 plants) polycultures.
On the horizontal axis, the first letter denotes plant species (A: alfalfa rhizosphere), the lowercase letter denotes neighboring plant species (Ab: alfalfa rhizosphere with neighboring brassica, Af: alfalfa rhizosphere with neighboring fescue, Abf: alfalfa rhizosphere with neighboring brassica and fescue). Number denotes the total number of plants per treatment (1 plant, 24 plants, and 48 plants). For example, Ab24 denotes alfalfa rhizosphere, with brassica as a plant neighbor, and 24 plants total with 12 being alfalfa and 12 being brassica. Blue denotes a negative log2 fold change ratio (decrease in abundance), while red denotes a positive log2 fold change ratio (increase in abundance).
Fig 3
Fig 3. Bacteriome network of alfalfa in monoculture and plant mixtures.
(a) Alfalfa monoculture (1 plant, 24 plants, 48 plants). (b) Alfalfa-brassica plant mixture (2 plants, 24 plants, 48 plants). (c) Alfalfa-fescue plant mixture (2 plants, 24 plants, 48 plants). (d) Alfalfa-brassica-fescue plant mixture (3 plants, 24 plants, 48 plants). Module color denotes module size (largest to smallest: lavender, lime green, sky blue, dark grey, orange, salmon, teal, grey); dot size denotes relative abundance; green edge denotes a positive correlation; red edge would denote a negative correlation if present.
Fig 4
Fig 4. Differential abundance comparison of the rhizosphere of a brassica plant grown alone and brassica’s rhizosphere grown in medium density (24 plants) and high density (48 plants) polycultures.
On the horizontal axis, the first letter denotes plant species (B: brassica rhizosphere), the lowercase letter denotes neighboring plant species (Ba: brassica rhizosphere with neighboring alfalfa, Bf: brassica rhizosphere with neighboring fescue, Baf: brassica rhizosphere with neighboring alfalfa and fescue). Number denotes the total number of plants per treatment (1 plant, 24 plants, and 48 plants). For example, Ba24 denotes brassica rhizosphere, with alfalfa as a plant neighbor, and 24 plants total with 12 being brassica and 12 being alfalfa. Blue denotes a negative log2 fold change ratio (decrease in abundance), while red denotes a positive log2 fold change ratio (increase in abundance).
Fig 5
Fig 5. Bacteriome network of brassica in monoculture and plant mixtures.
(a) Brassica monoculture (1 plant, 24 plants, 48 plants). (b) Brassica-alfalfa plant mixture (2 plants, 24 plants, 48 plants). (c) Brassica-fescue plant mixture (2 plants, 24 plants, 48 plants). (d) Brassica-alfalfa-fescue plant mixture (3 plants, 24 plants, 48 plants). Module color denotes module size (largest to smallest: lavender, lime green, sky blue, dark grey, orange, salmon, teal, grey), size of the dot denotes relative abundance; green edge denotes a positive correlation, and red edge denotes a negative correlation.
Fig 6
Fig 6. Differential abundance comparison of the rhizosphere of a fescue plant grown alone and fescue’s rhizosphere grown in medium density (24 plants) and high density (48 plants) polycultures.
On the horizontal axis, the first letter denotes plant species (F: fescue rhizosphere), the lowercase letter denotes neighboring plant species (Fa: fescue rhizosphere with neighboring alfalfa, Fb: fescue rhizosphere with neighboring brassica, Fab: fescue rhizosphere with neighboring alfalfa and brassica). Number denotes the total number of plants per treatment (1 plant, 24 plants, and 48 plants). For example, Fa24 denotes fescue rhizosphere, with alfalfa as a plant neighbor, and 24 plants total with 12 being fescue and 12 being alfalfa. Blue denotes a negative log2 fold change ratio (decrease in abundance), while red denotes a positive log2 fold change ratio (increase in abundance).
Fig 7
Fig 7. Bacteriome network of brassica in monoculture and plant mixtures.
(a) Fescue monoculture (1 plant, 24 plants, 48 plants). (b) Fescue-alfalfa plant mixture (2 plants, 24 plants, 48 plants). (c) Fescue-brassica plant mixture (2 plants, 24 plants, 48 plants). (d) Fescue-alfalfa-brassica plant mixture (3 plants, 24 plants, 48 plants). Module color denotes module size (largest to smallest: lavender, lime green, sky blue, dark grey, orange, salmon, teal, grey), size of the dot denotes relative abundance; green edge denotes a positive correlation, and a red edge would denote a negative correlation if present.

Similar articles

References

    1. Goh C-H, Veliz Vallejos DF, Nicotra AB, Mathesius U. The impact of beneficial plant-associated microbes on plant phenotypic plasticity. J Chem Ecol. 2013;39(7):826–39. doi: 10.1007/s10886-013-0326-8 - DOI - PMC - PubMed
    1. Berendsen RL, Pieterse CMJ, Bakker PAHM. The rhizosphere microbiome and plant health. Trends Plant Sci. 2012;17(8):478–86. doi: 10.1016/j.tplants.2012.04.001 - DOI - PubMed
    1. DiLegge MJ, Manter DK, Vivanco JM. Soil microbiome disruption reveals specific and general plant-bacterial relationships in three agroecosystem soils. PLoS One. 2022;17(11):e0277529. doi: 10.1371/journal.pone.0277529 - DOI - PMC - PubMed
    1. Lyu D, Zajonc J, Pagé A, Tanney CAS, Shah A, Monjezi N, et al.. Plant holobiont theory: the phytomicrobiome plays a central role in evolution and success. Microorganisms. 2021;9(4):675. doi: 10.3390/microorganisms9040675 - DOI - PMC - PubMed
    1. Wallenstein MD. Managing and manipulating the rhizosphere microbiome for plant health: a systems approach. Rhizosphere. 2017;3:230–2. doi: 10.1016/j.rhisph.2017.04.004 - DOI

LinkOut - more resources