

Alternative approaches for monitoring and evaluation of lymphatic filariasis following mass drug treatment with ivermectin, diethylcarbamazine and albendazole in East New Britain Province, Papua New Guinea
- PMID: 39869653
- PMCID: PMC11798438
- DOI: 10.1371/journal.pntd.0012128
Alternative approaches for monitoring and evaluation of lymphatic filariasis following mass drug treatment with ivermectin, diethylcarbamazine and albendazole in East New Britain Province, Papua New Guinea
Abstract
Background: WHO recommends two annual rounds of mass drug administration (MDA) with ivermectin, diethylcarbamazine, and albendazole (IDA) for lymphatic filariasis (LF) elimination in treatment naïve areas that are not co-endemic for onchocerciasis such as Papua New Guinea (PNG). Whether two rounds of MDA are necessary or sufficient and the optimal sampling strategies and endpoints for stopping MDA remain undefined.
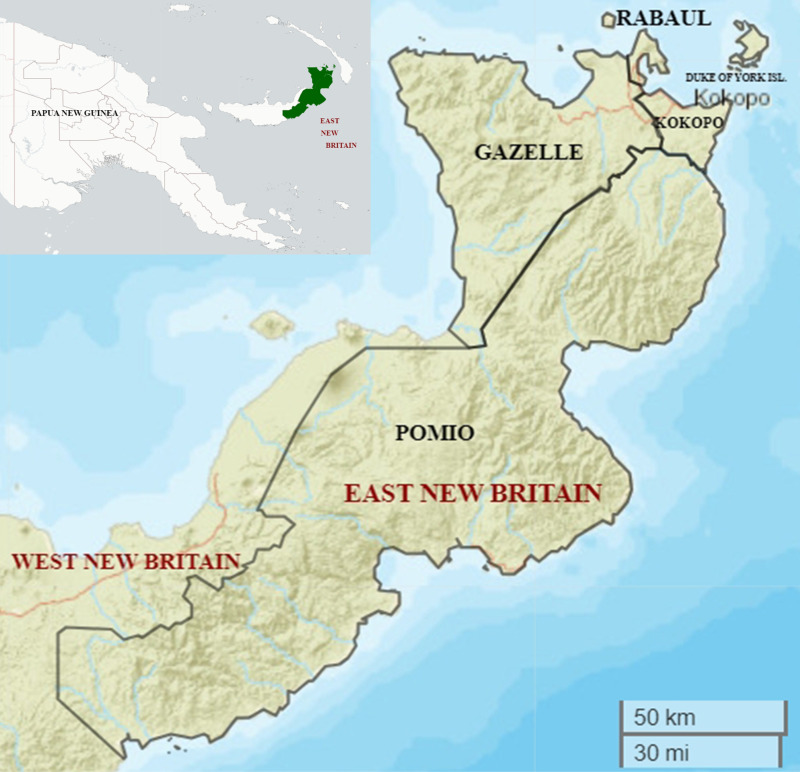
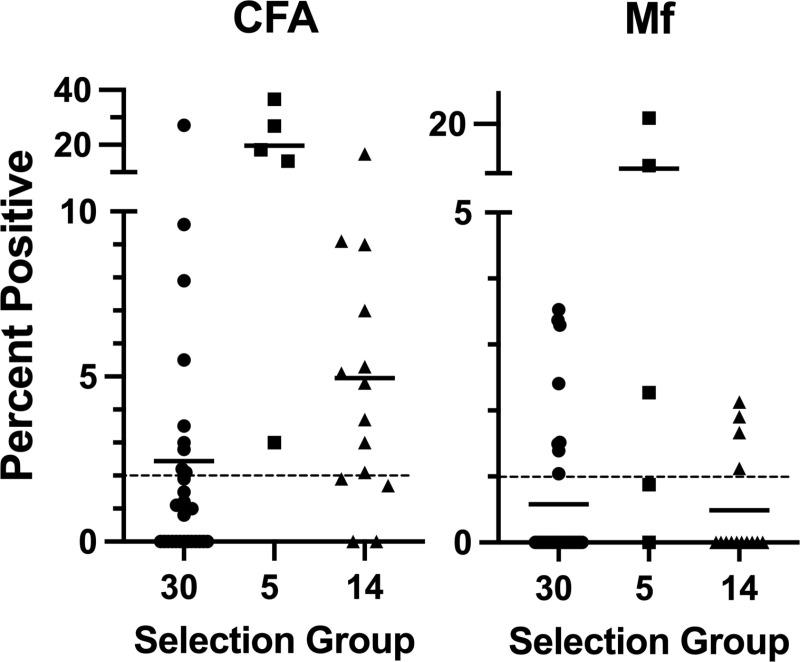
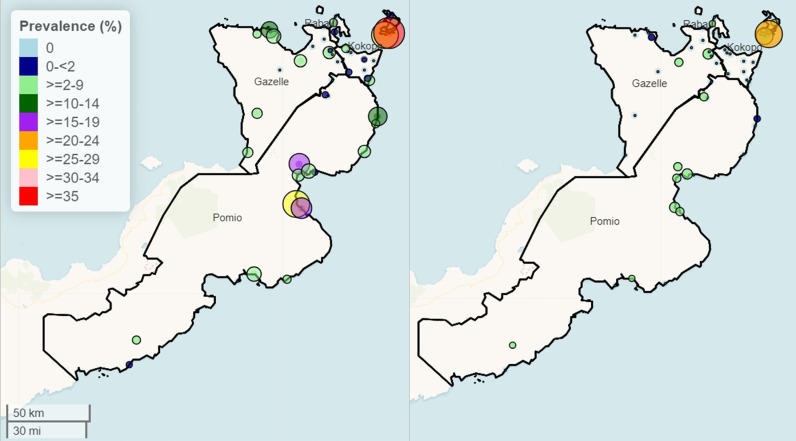
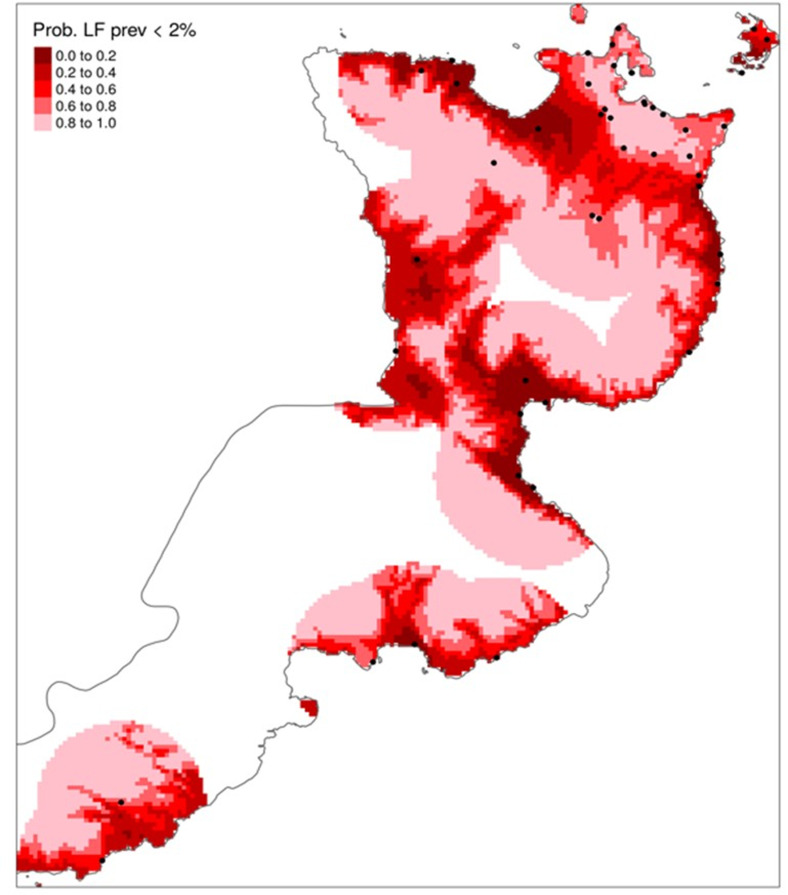
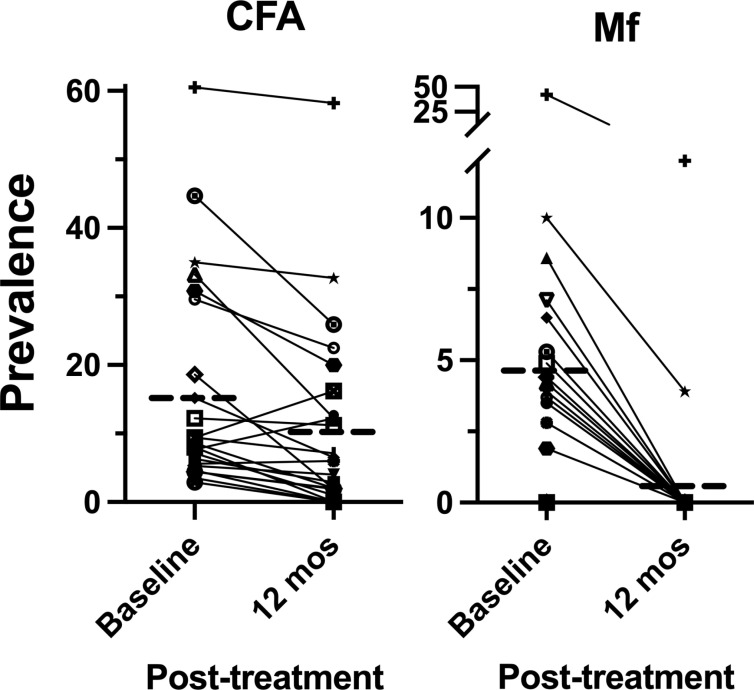
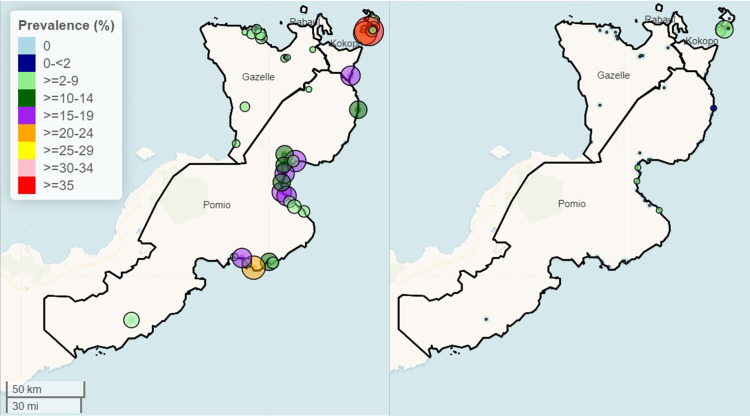
Methods and findings: Two cross-sectional studies were conducted at baseline (N = 49 clusters or villages) and 12 months after mass drug administration (MDA) with IDA (N = 47 villages) to assess lymphatic filariasis (LF) by circulating filarial antigenemia (CFA) and microfilariae (Mf). Before MDA, children aged 6-9 years (N~50) and those ≥ 10 years (N~50) in each village were randomly sampled. Before MDA, the population mean prevalence of LF in East New Britain Province (ENBP), Papua New Guinea, was estimated using population proportionate sampling (PPS, N = 30) to be 59/2,561 (2.3%) CFA positive and 14/2,561 (0.6%) Mf positive. No children were Mf positive. However, LF infection was highly heterogeneous; 8 villages (26.7%) had a CFA prevalence >2%, and 7 villages (23.3%) had an Mf prevalence >1%. To identify sentinel villages with LF in areas under-sampled by PPS, 19 additional villages suspected to have LF were sampled, with 15 (79%) having >2% CFA prevalence and 7 (38%) >1% Mf (range 1-22%). Twenty-four villages were evaluated before and after MDA in age-matched adults ( ≥ 18 years). Treatment reduced CFA prevalence by 34% and Mf prevalence by 90%. Post-MDA model-based geostatistics efficiently selected an additional 23 villages, of which 20 (87%) had a CFA prevalence > 2%. None of these villages had >1% Mf. Post-MDA, two of four districts had no villages with >1% Mf.
Conclusions: Model-based geostatistics was more effective than PPS in sampling high-risk LF sites in a heterogeneous area. Low LF prevalence and partial reduction of CFA limit children's effectiveness as sentinels. A single round of high-coverage MDA with IDA achieved elimination targets in low-prevalence villages in PNG. Higher-prevalence areas will need additional MDA rounds, which could be targeted to smaller evaluation units to cut costs.
Trial registration: Clinicaltrials.gov NCT04124250.
Copyright: This is an open access article, free of all copyright, and may be freely reproduced, distributed, transmitted, modified, built upon, or otherwise used by anyone for any lawful purpose. The work is made available under the Creative Commons CC0 public domain dedication.
Conflict of interest statement
The authors have declared that no competing interests exist.
Figures
Similar articles
-
Safety and efficacy of mass drug administration with a single-dose triple-drug regimen of albendazole + diethylcarbamazine + ivermectin for lymphatic filariasis in Papua New Guinea: An open-label, cluster-randomised trial.PLoS Negl Trop Dis. 2022 Feb 9;16(2):e0010096. doi: 10.1371/journal.pntd.0010096. eCollection 2022 Feb. PLoS Negl Trop Dis. 2022. PMID: 35139070 Free PMC article. Clinical Trial.
-
Safety and effectiveness of triple-drug therapy with ivermectin, diethylcarbamazine, and albendazole in reducing lymphatic filariasis prevalence and clearing circulating filarial antigens in Mombasa, Kenya.Infect Dis Poverty. 2025 Feb 24;14(1):11. doi: 10.1186/s40249-025-01282-z. Infect Dis Poverty. 2025. PMID: 39994719 Free PMC article.
-
Epidemiological monitoring survey to assess the impact of mass drug administration with triple-drug regimen in lymphatic filariasis elimination programme in an endemic district in Southern India.PLoS Negl Trop Dis. 2025 Aug 1;19(8):e0013368. doi: 10.1371/journal.pntd.0013368. eCollection 2025 Aug. PLoS Negl Trop Dis. 2025. PMID: 40748890 Free PMC article.
-
Albendazole alone or in combination with microfilaricidal drugs for lymphatic filariasis.Cochrane Database Syst Rev. 2019 Jan 8;1(1):CD003753. doi: 10.1002/14651858.CD003753.pub4. Cochrane Database Syst Rev. 2019. PMID: 30620051 Free PMC article.
-
Model-based analysis of trial data: microfilaria and worm-productivity loss after diethylcarbamazine-albendazole or ivermectin-albendazole combination therapy against Wuchereria bancrofti.Trop Med Int Health. 2006 May;11(5):718-28. doi: 10.1111/j.1365-3156.2006.01606.x. Trop Med Int Health. 2006. PMID: 16640625 Review.
Cited by
-
Evaluation of Microfilaremic Individuals after Mass Drug Treatment with Ivermectin, Diethylcarbamazine, and Albendazole for Lymphatic Filariasis in Papua New Guinea.Am J Trop Med Hyg. 2025 Mar 25;112(6):1235-1239. doi: 10.4269/ajtmh.24-0382. Print 2025 Jun 4. Am J Trop Med Hyg. 2025. PMID: 40132219 Free PMC article.
References
-
- WHO. Progress Report 2000-2009 and Strategic Plan 2010-2020. WHO; 2010.
-
- WHO. Lymphatic filariasis: Key facts 2020. Available from: https://www.who.int/news-room/fact-sheets/detail/lymphaticfilariasis#:~:....
-
- Lymphatic filariasis - managing morbidity and preventing disability: an aide-mémoire for national programme managers. 2nd edition. Geneva: World Health Organization; 2021.
Publication types
MeSH terms
Substances
Associated data
LinkOut - more resources
Full Text Sources
Medical
