. 2025 Feb 4;122(5):e2415042122.
doi: 10.1073/pnas.2415042122. Epub 2025 Jan 27.

Chronic stress-induced cholesterol metabolism abnormalities promote ESCC tumorigenesis and predict neoadjuvant therapy response

Affiliations

Chronic stress-induced cholesterol metabolism abnormalities promote ESCC tumorigenesis and predict neoadjuvant therapy response

Ting Wang et al. Proc Natl Acad Sci U S A. .

Abstract

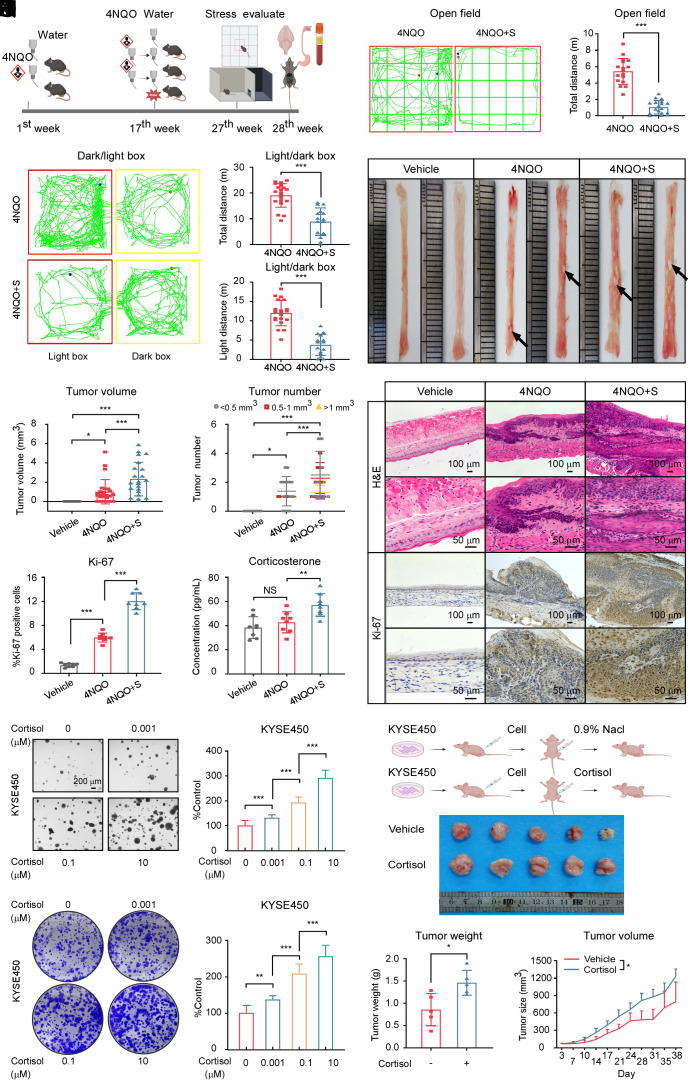
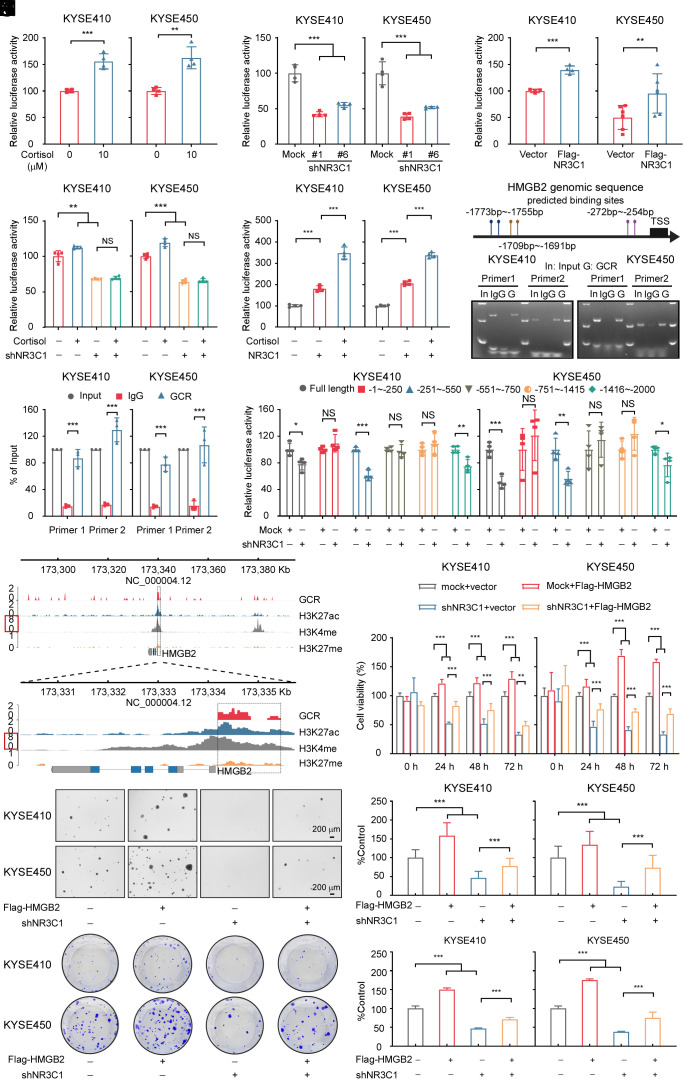
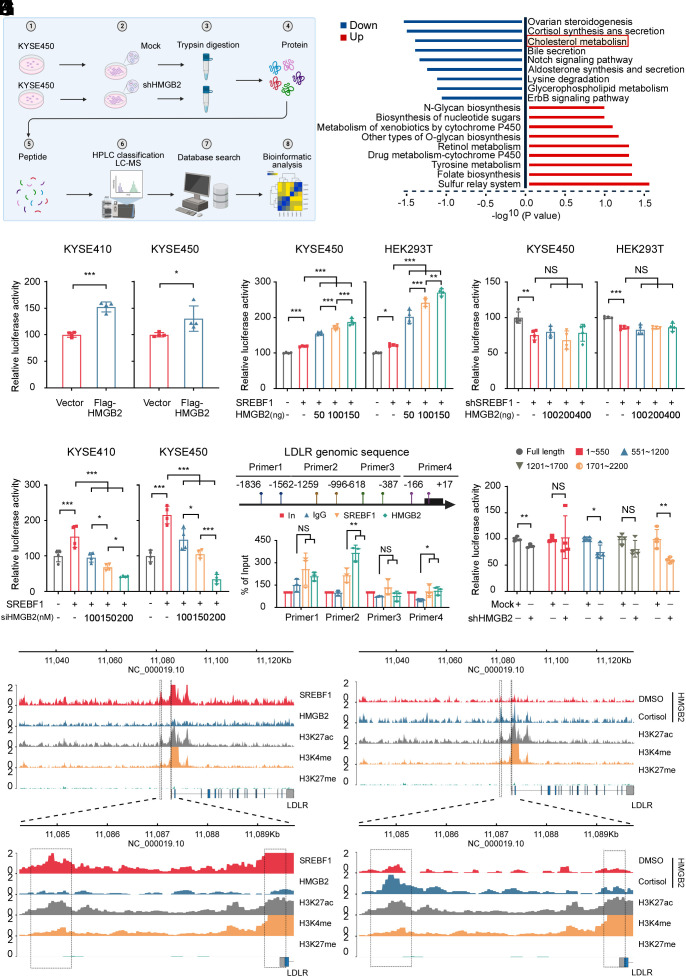
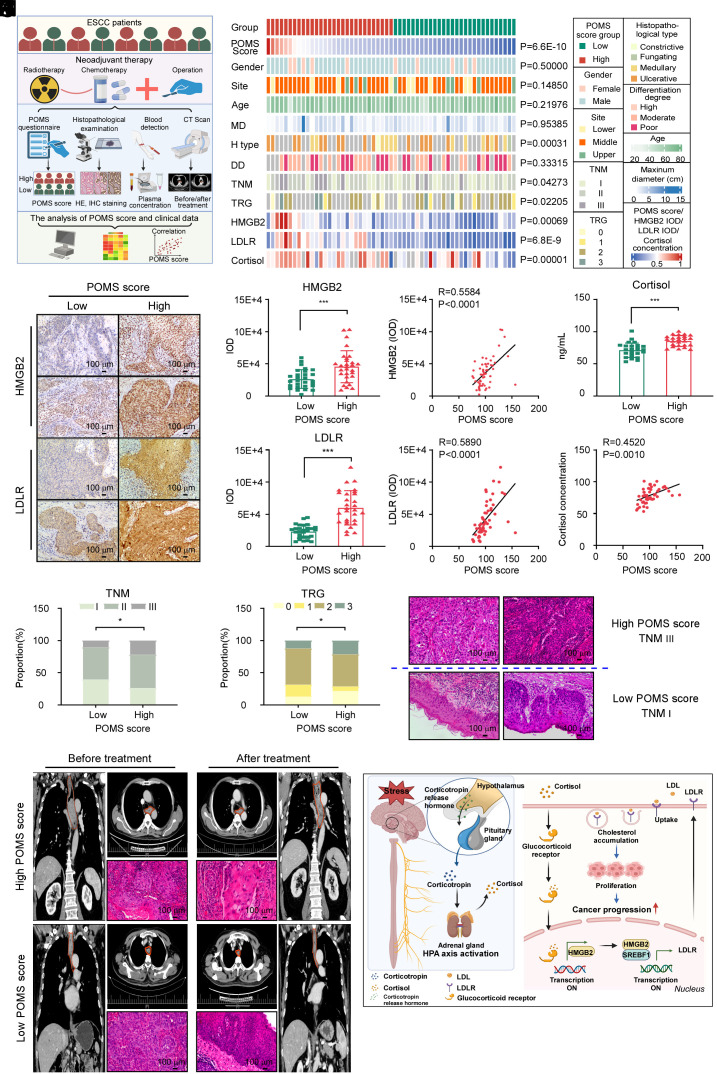
Recent studies have demonstrated that chronic stress can enhance the development of multiple human diseases, including cancer. However, the role of chronic stress in esophageal carcinogenesis and its underlying molecular mechanisms remain unclear. This study uncovered that dysregulated cholesterol metabolism significantly promotes esophageal carcinogenesis under chronic stress conditions. Our findings indicate that the persistent elevation of glucocorticoids induced by chronic stress stimulates cholesterol uptake, contributing to esophageal carcinogenesis. The activated glucocorticoid receptor (GCR) enrichment at the promoter region of High Mobility Group Box 2 (HMGB2) facilitates its transcription. As a transcription coactivator, HMGB2 enhances Sterol Regulatory Element Binding Transcription Factor 1 (SREBF1) transcription and regulates cholesterol metabolism through LDL particle uptake into cells via Low Density Lipoprotein Receptor (LDLR). These results emphasize the significant impact of chronic stress on esophageal carcinogenesis and establish cholesterol metabolism disorder as a crucial link between chronic stress and the development of ESCC. The implications suggest that effectively managing chronic stress may serve as a viable strategy for preventing and treating ESCC.

Keywords: ESCC; HMGB2; LDLR; chronic stress; cortisol.


Conflict of interest statement

Competing interests statement:The authors declare no competing interest.

Figures

Fig. 1.
Fig. 1.
Chronic stress facilitates ESCC development. (A) Diagram detailing the 4NQO or 4NQO + stress-induced ESCC model in C57 mice. The figure was created with BioRender.com. (B) Representative activity trajectory of 4NQO and 4NQO + stress-treated mice mapped using the open field test. (C) Comparison of the total distance traveled by the 4NQO (n = 17 mice) and 4NQO + stress (n = 18 mice) groups. (D) Representative distance tracks of 4NQO and 4NQO + stress-treated mice mapped using the light–dark box test. (E and F) Comparison of the total distance (E) and light box distance traveled (F) by the 4NQO (n = 20 mice) and 4NQO + stress (n = 15 mice) groups. (G) Representative macroscopic images of esophageal tumors from mice at the 28th wk. Black arrows indicate in situ tumor lesions. (H and I) Tumor volume (H) and number of esophageal tumors (I) in each group. (Vehicle, n = 10; 4NQO, n = 25; 4NQO + stress, n = 22). (J) Harvested esophageal tissues of male mice were stained with H&E and IHC staining of Ki-67. (Scale bar, 100 μm or 50 μm). (K) Statistical analysis of Ki-67 expression levels of male mice was shown (n = 8/group). (L) The corticosterone levels in the plasma of vehicle, 4NQO, and 4NQO + stress mice were quantified with an ELISA kit. (n = 8/group). (M and N) Cell proliferation after administering cortisol (0, 0.001, 0.1, and 10 μM) to KYSE450 cells was measured using soft agar (M) and crystal violet staining assays (N). (Scale bar, 200 μm). (O) Schematic illustrating the treatment regimen of normal saline or cortisol to KYSE450 CDX mice model. (n = 5/group). The figure was created with BioRender.com. (P) Photograph of the harvested tumors from KYSE450 CDX mice model. (Q) Weight of excised tumors in each group. (n = 5/group). (R) Tumor volume measurements were obtained twice weekly. The formula of tumor volume (mm3) calculation = length × width × height × 0.52. (n = 5/group). *P < 0.05, **P < 0.01, ***P < 0.001, NS = no significance.
Fig. 2.
Fig. 2.
Chronic stress enhances ESCC progression via HMGB2. (A) Schematic illustrating the proteomics assay using the esophageal samples from the 4NQO and 4NQO + stress group. The figure was created with BioRender.com. (B) The heat map displayed differentially expressed proteins between the 4NQO and the 4NQO + stress groups that were selected after reviewing the literature for genes associated with cancer and stress. (C) Plots illustrating HMGB2 transcript expression levels in the normal esophagus and ESCC from the TCGA database. (Normal = 11, Tumor = 81). (D) Statistical analysis of the HMGB2 expression level. (E) Representative IHC staining images illustrating HMGB2 expression in harvested male esophageal tissues. (n = 8/group). (Scale bar, 100 μm or 50 μm). (F) Representative IHC staining images illustrating HMGB2 expression in paired adjacent and tumor tissues from an ESCC human tissue array. (Scale bar, 200 μm or 50 μm). (G) Statistical analysis of HMGB2 expression between cancer tissues and paired adjacent normal tissues. (n = 59). (H) Statistical analysis of HMGB2 expression. (Adjacent, n = 60; Tumor, n = 59). (I) Cell proliferation was measured in mock and shHMGB2 KYSE410 and KYSE450 cells at 0 h, 24 h, 48 h, and 72 h by MTT assay. (J) Cell proliferation was measured in mock and shHMGB2 ESCC cells by soft agar colony formation assays. (Scale bar, 200 μm). (K) Cell proliferation was measured in mock and shHMGB2 ESCC cells by crystal violet staining assay. (L) Cell proliferation of KYSE30 and KYSE150 cells overexpressing HMGB2 was measured by MTT assay. (M) Cell proliferation of ESCC cells overexpressing HMGB2 was measured by soft agar colony formation assays. (Scale bar, 200 μm). (N) Cell proliferation of ESCC cells overexpressing HMGB2 was measured by crystal violet staining assay. (O and P) Schematic illustrating (O) and representative image (P) of tumors derived from the KYSE450 cell-derived xenograft (CDX) mice model exposed to chronic stress. (n = 4/group). The figure (O) was created with BioRender.com. (Q) Statistical analysis of tumor weight. (n = 4/group). (R) Tumor volume measurements were obtained twice weekly. The formula of tumor volume (mm3) calculation = length × width × height × 0.52. (n = 4/group). *P < 0.05, **P < 0.01, ***P < 0.001.
Fig. 3.
Fig. 3.
Activated GCR enhances the transcription of HMGB2. (A) Dual-luciferase activity was detected 48 h after transfecting the HMGB2-promoter into KYSE410 and KYSE450 cells treated with 10 μM cortisol or DMSO for 18 h. (n = 4/group). (B) Relative HMGB2 luciferase promoter activity in GCR-depleted ESCC cells. Dual-luciferase was detected at 48 h after transfection. (n = 4/group). (C) Relative HMGB2 luciferase promoter activity in NR3C1 overexpressing ESCC cells. Dual-luciferase activity was detected at 48 h after transfection. (n = 4/group). (D) shNR3C1 ESCC cells were transfected with the HMGB2 promoter reporter plasmid. Transfected cells were then treated with 10 μM cortisol or DMSO for 18 h and luciferase activity was subsequently measured. (n = 4/group). (E) The HMGB2 promoter reporter plasmid was transfected in ESCC cells with NR3C1 overexpression. Transfected cells were then treated with 10 μM cortisol or DMSO for 18 h and luciferase activity was subsequently measured. (n = 4/group). (F) Schematic illustrating the predicted binding sites used to assess the enrichment of GCR at the HMGB2 promoter. (G) Representative images of GCR enrichment at the HMGB2 promoter were obtained using the CHIP assay in ESCC cells. (H) The gray value analysis of GCR enrichment at the HMGB2 promoter was measured using the CHIP assay. (n = 3/group). (I) Dual-luciferase reporter assays of ESCC cells transfected with HMGB2 truncated promoters or full length. (n = 4/group). (J) Gene tracks of GCR, H3K27ac, H3K4me, and H3K27me enrichment with CUT&TAG analysis at the HMGB2 promoter locus in KYSE450 cells. (KM) HMGB2 overexpression rescued the cell proliferation defect induced by HMGB2 depletion in ESCC cells, as evidenced by MTT (K), soft agar (L), and crystal violet staining assay (M) results. (Scale bar, 200 μm). *P < 0.05, **P < 0.01, ***P < 0.001, NS = no significance.
Fig. 4.
Fig. 4.
HMGB2 promotes ESCC proliferation through the cholesterol metabolism pathway. (A) Schematic illustrating the flow of the proteomic sequencing experiments using mock and shHMGB2 in KYSE450 cells. The figure was created with BioRender.com. (B) Differentially enriched protein list detected from the proteomic sequencing of shHMGB2 vs Mock KYSE450 cells. (C) Relative LDLR luciferase promoter activity in KYSE410 and KYSE450 cells overexpressing of HMGB2. Dual-luciferase was detected at 48 h after transfection. (n = 4/group). (D and E) Dual-luciferase reporter assay was used to measure the relative LDLR luciferase promoter activity in KYSE450 and HEK293T cells overexpressing (D) or depleted of SREBF1 (E) 48 h after cotransfecting the LDLR promoter-reporter plasmid and different concentrations of HMGB2. (n = 4/group). (F) Dual-luciferase reporter assay was used to measure the relative LDLR luciferase promoter activity in KYSE410 and KYSE450 cells overexpressing SREBF1 after cotransfecting the LDLR promoter-reporter and siHMGB2 plasmid 48 h. (n = 4/group). (G) Schematic illustrating the designed primers used to assess the enrichment of SREBF1 and HMGB2 at the LDLR promoter. The figure was created with BioRender.com. (H) The gray value analysis of SREBF1 and HMGB2 enrichment at the LDLR promoter was measured in KYSE450 cells using the CHIP assay. (n = 3/group). (I) Dual-luciferase reporter assays of KYSE450 cells transfected with LDLR truncated promoters or full length. (n = 4/group). (J) Gene tracks illustrating SREBF1, HMGB2, H3K27ac, H3K4me, and H3K27me enrichment at the LDLR promoter locus in KYSE450 cells based on CUT&TAG analysis. (K) Gene tracks illustrating HMGB2, H3K27ac, H3K4me, and H3K27me enrichment at the LDLR promoter locus in KYSE450 cells based on CUT&TAG analysis after treatment with DMSO or 10 μM cortisol for 18 h. *P < 0.05, **P < 0.01, ***P < 0.001, NS = no significance.
Fig. 5.
Fig. 5.
Clinical relevant markers in ESCC patients experiencing stress. (A) Schematic illustrating the analysis of the clinical patient data. The figure was created with BioRender.com. (B) A heat map illustrating the frequencies of two POMS score groups among 57 ESCC patient samples. Detailed clinical analyses of individual tumor samples were annotated. P values to the right indicate significant nonrandom distributions for each attribute. The chi-square test was used to assess the statistical significance of categorical variables. (C) Representative IHC staining images of HMGB2 and LDLR. (Scale bar, 100 μm or 50 μm). (D and E) The statistical analysis of IHC staining of HMGB2 (D) and LDLR (E) from ESCC patients in the low (n = 28) and high POMS score (n = 29) groups. (F and G) Correlation analysis of the POMS score and the expression of HMGB2 (F) and LDLR (G) of IHC staining from ESCC patients. (n = 57). (H) The analysis of the POMS score and the plasma concentration of cortisol from ESCC patients in the low (n = 25) and high POMS score (n = 25) groups. (I) Correlation analysis of the POMS score and concentration of cortisol from the plasma of ESCC patients. (n = 50). (J) Stacked bar plots illustrating the distribution of TNM stage across low (I = 39.3%, II = 50%, III = 10.7%) and high POMS score (I = 25.9%, II = 51.9%, III = 22.2%). (K) Stacked bar plots illustrating the distribution of TRG classification across low (0 = 12.5%, 1 = 18.8%, 2 = 56.2%, 3 = 12.5%) and high POMS score (0 = 21.43%, 1 = 7.14%, 2 = 50.00%, 3 = 21.42%). *P < 0.05, ***P < 0.001. (L) Representative H&E staining pictures of ESCC patients in the POMS score high in the TNM III stage and low groups in the TNM I stage. (Scale bar, 100 μm or 50 μm). (M) Representative CT scans (coronal plane and horizontal plane) and H&E staining images of two ESCC patients in POMS scores high and POMS scores low group before and after neoadjuvant treatment who have the same TNM II stage. (Scale bar, 100 μm). (N) Graphical abstract of the project. Chronic stress activates the GCR–HMGB2–LDLR axis by releasing cortisol, which can cause abnormal cholesterol metabolism and ultimately promote esophageal carcinogenesis

References

    1. Smyth E. C., et al. , Oesophageal cancer. Nat. Rev. Dis. Primers 3, 17048 (2017). - PMC - PubMed
    1. Yang C. S., Chen X. L., Research on esophageal cancer: With personal perspectives from studies in China and Kenya. Int. J. Cancer 149, 264–276 (2021). - PMC - PubMed
    1. Sung H., et al. , Global cancer statistics 2020: GLOBOCAN estimates of incidence and mortality worldwide for 36 cancers in 185 countries. CA Cancer J. Clin. 71, 209–249 (2021). - PubMed
    1. Dai S., et al. , Chronic stress promotes cancer development. Front. Oncol. 10, 1492 (2020). - PMC - PubMed
    1. Hassamal S., Chronic stress, neuroinflammation, and depression: An overview of pathophysiological mechanisms and emerging anti-inflammatories. Front. Psychiatry 14, 1130989 (2023). - PMC - PubMed

MeSH terms