. 2025 Feb 4;122(5):e2420875122.
doi: 10.1073/pnas.2420875122. Epub 2025 Jan 27.

Fatty acid metabolism and the oxidative stress response support bacterial predation

Affiliations

Fatty acid metabolism and the oxidative stress response support bacterial predation

Rikesh Jain et al. Proc Natl Acad Sci U S A. .

Abstract

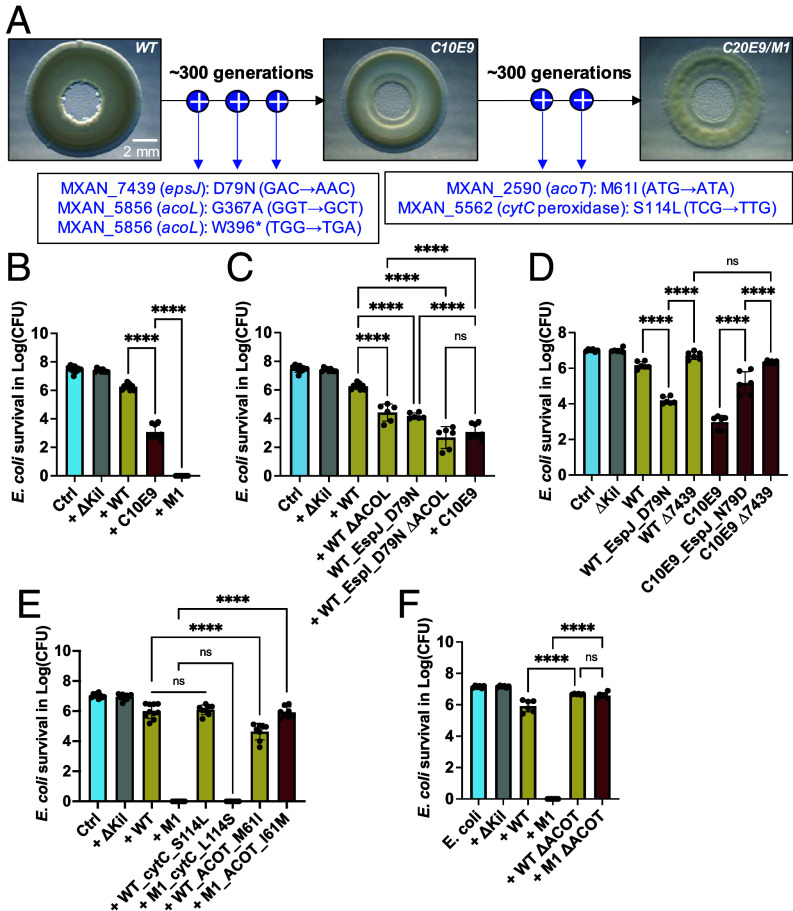
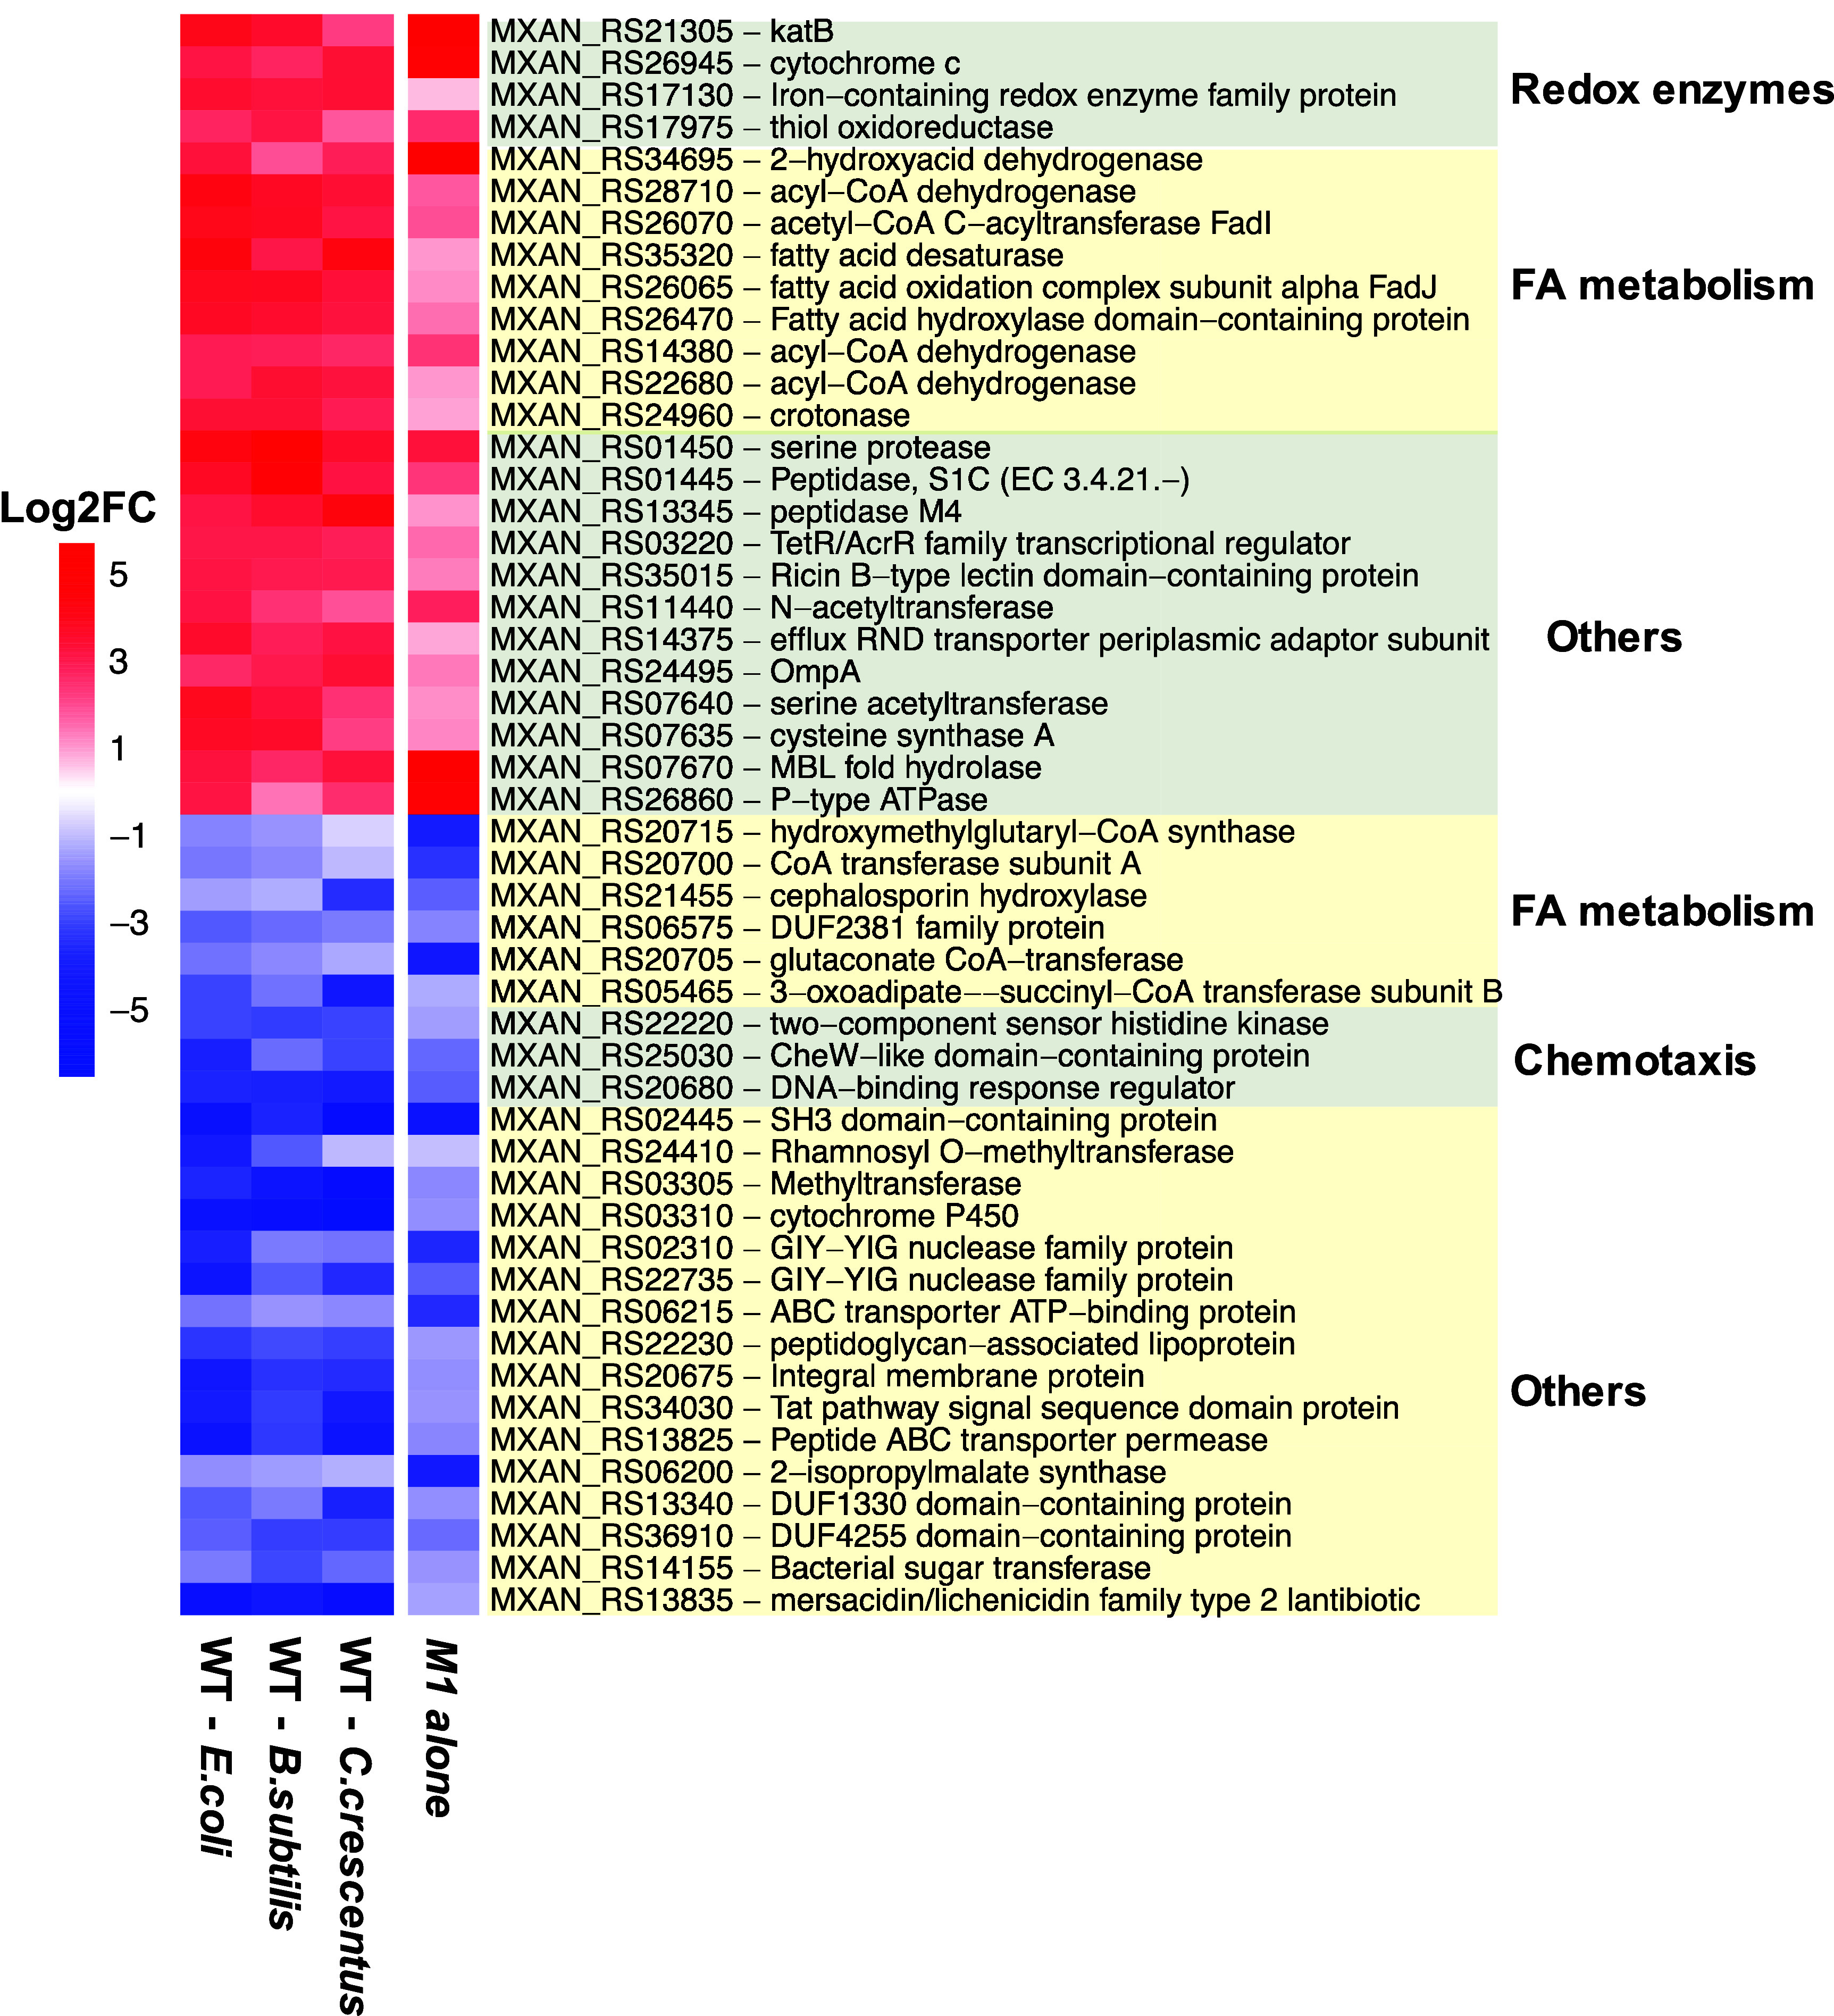
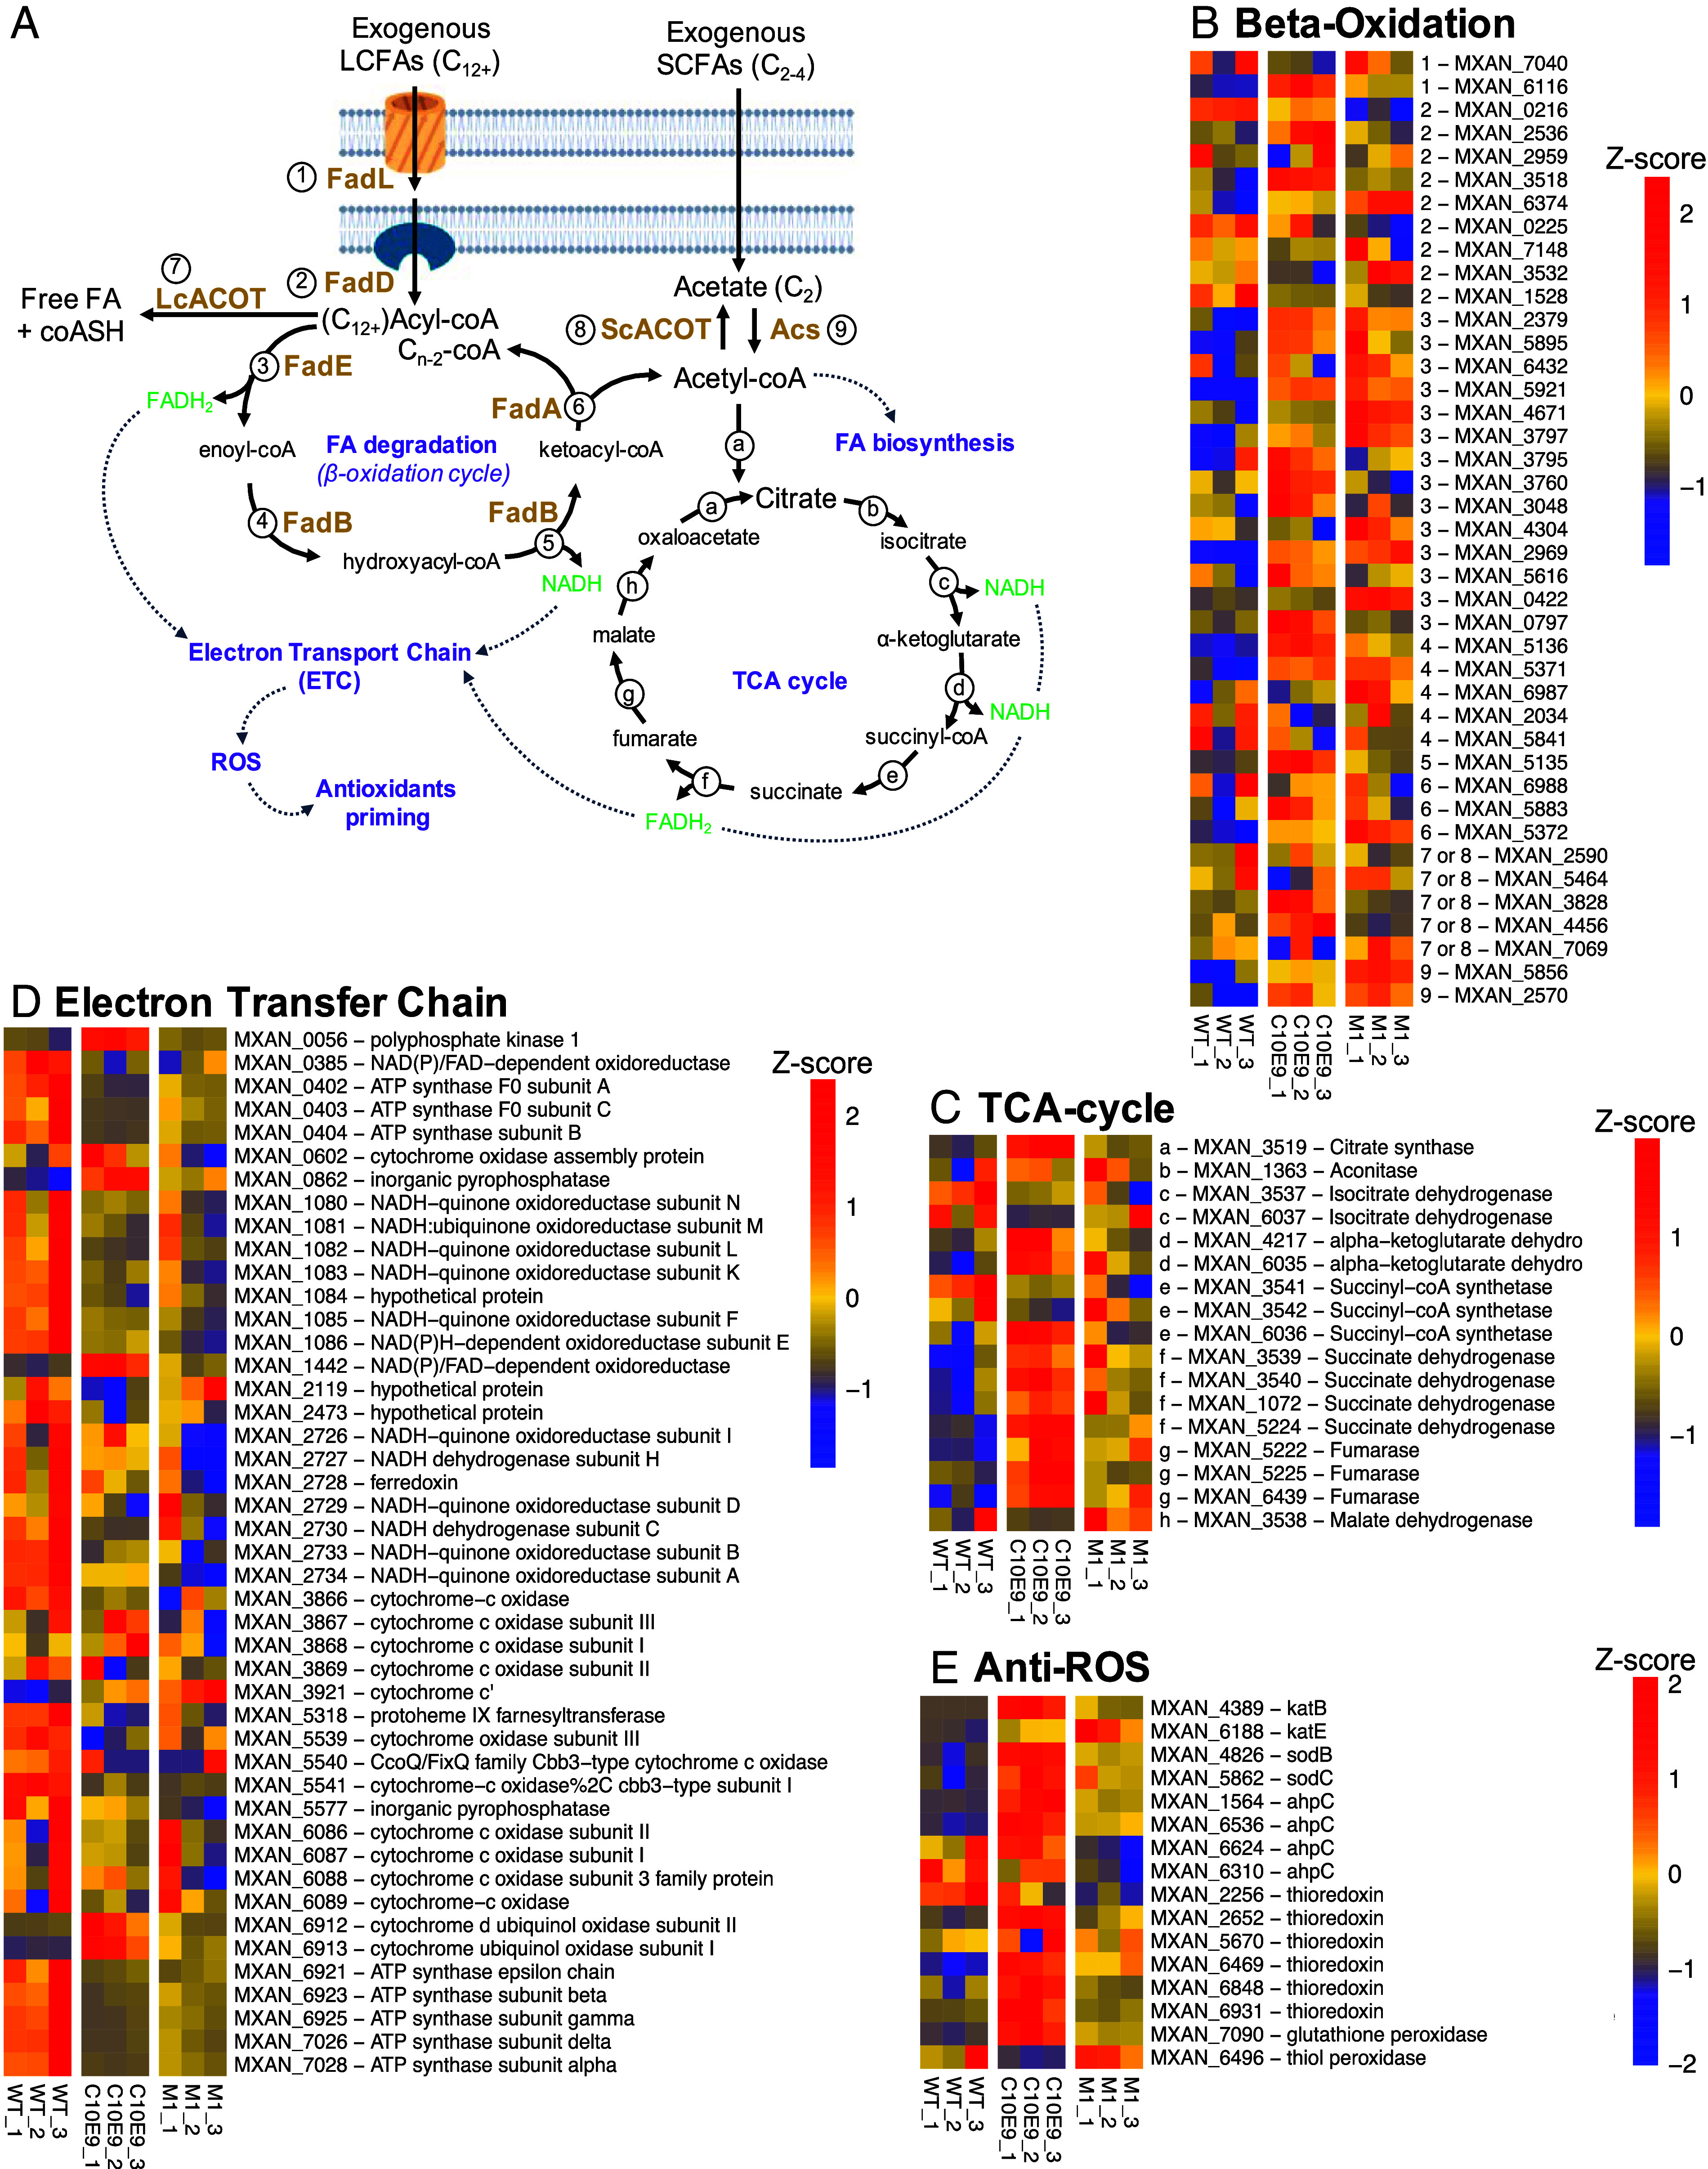
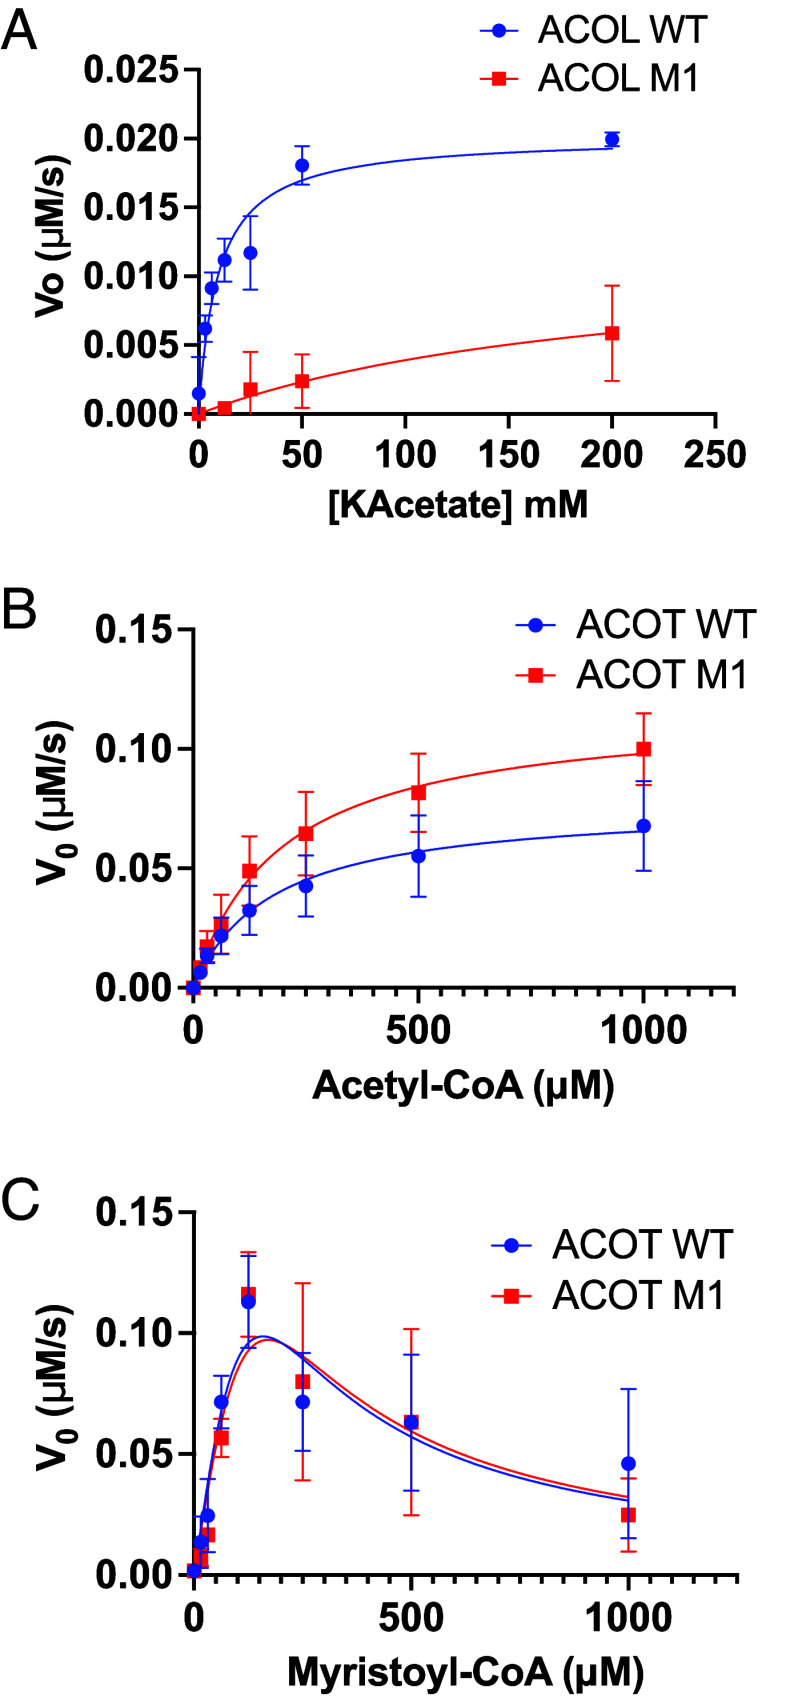
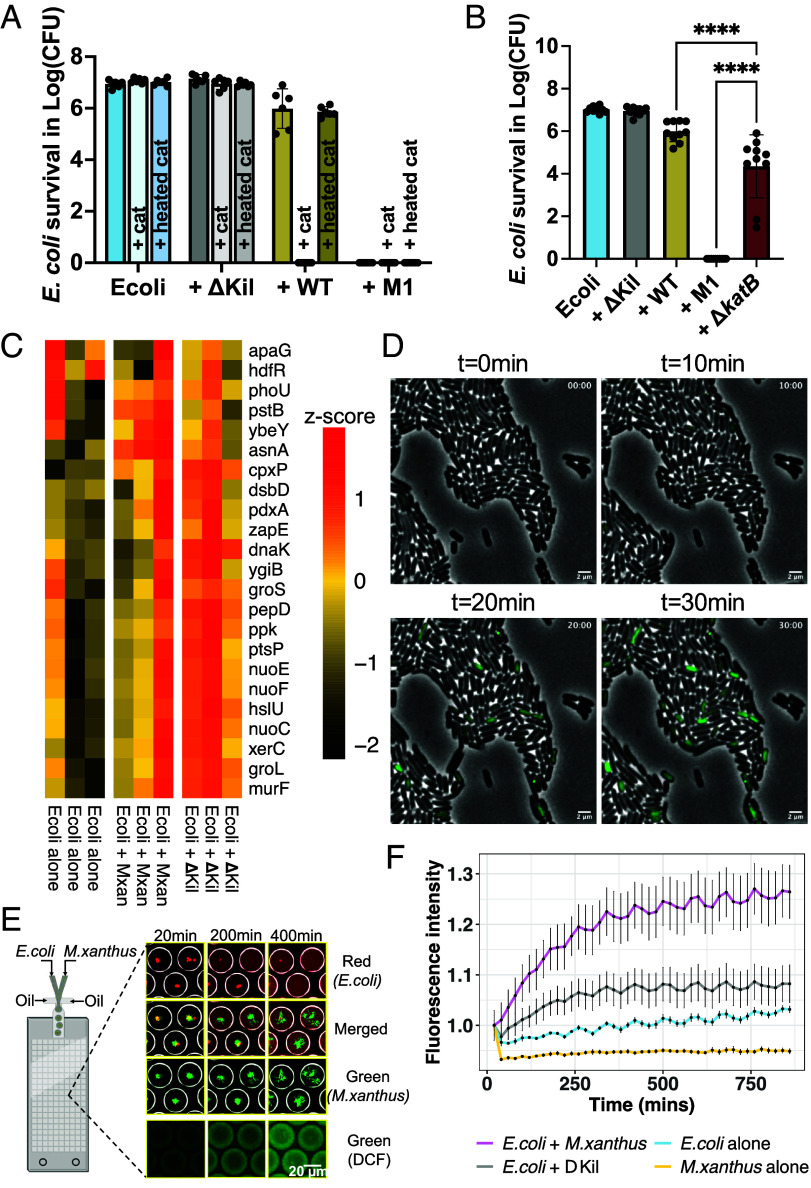
Despite growing awareness of their importance in soil ecology, the genetic and physiological traits of bacterial predators are still relatively poorly understood. In the course of a Myxococcus xanthus predator evolution experiment, we identified a class of genotypes leading to enhanced predation against diverse species. RNA-seq analysis demonstrated that this phenotype is linked to the constitutive activation of a predation-specific program. Functional analysis of the mutations accumulated across the evolutionary time in a two-component system and Acyl-CoA-manipulating enzymes revealed the critical roles of fatty acid metabolism and antioxidant gene induction. The former likely adapts the predator to metabolites derived from the prey while the latter protects predatory cells from reactive oxygen species generated by prey cells under stress and released upon lysis during predation. These findings reveal interesting parallels between bacterial predator-prey dynamics and pathogen-host cell interactions.

Keywords: Myxococcus xanthus; bacterial predation; experimental evolution; fatty acid metabolism; oxidative stress.


Conflict of interest statement

Competing interests statement:The authors declare no competing interest.

Figures

Fig. 1.
Fig. 1.
Transcriptomic shifts in wild-type M. xanthus in response to varied prey. (A) Contrasting gene expression patterns of M. xanthus between solitary state and E. coli predation (RNA-seq, n = 3 biological replicates). Genes with a positive log2 fold change value are upregulated in the M. xanthus + prey condition, while genes with a negative log2 fold change value are up-regulated in the solitary condition. DEGs stands for differentially expressed genes (p.adj < 0.05, Wald test). (B) Gene expression variations in M. xanthus during solitary state versus B. subtilis predation (n = 3). (C) Alterations in gene expression of M. xanthus during solitary state versus C. crescentus predation (n = 3). (D) Common and distinct DEGs in M. xanthus predation across three distinct prey types. (E) Gene ontology (GO) term enrichment for biological processes (BP) in common genes linked to predation on all three prey. (F) GO term enrichment for molecular functions (MF) in common genes involved in predation on all three prey.
Fig. 2.
Fig. 2.
Evolution of a superpredator from WT M. xanthus. (A) In a coincubation experiment lasting 72 h, M. xanthus and E. coli colonies were spotted near to each other on CF media with varying glucose concentrations (ranging from 0 to 0.2%). The efficiency of M. xanthus predation decreases with increasing glucose concentrations. (B) During the evolution experiment, M. xanthus cells were placed in the center of an E. coli colony. As the M. xanthus cells consumed a significant portion of the E. coli population and reached the prey colony edge, they were transferred to the center of a new E. coli colony. After every five cycles, the glucose concentration in the media was gradually raised by 10%. (C) Killing assay of E. coli MG1655 prey using M. xanthus DZ2 WT, predation-deficient ΔKil, and evolved mutant M1 as predators. The bar graph shows the mean prey survival in log10(CFU) after a 24-h coincubation ± SD derived from a minimum of 10 biological replicates. Statistical significance was determined using one-way ANOVA, with post hoc multiple comparisons performed via the Dunnett test; ns: not significant, ****P < 0.0001. (D) Growth curves of M. xanthus DZ2 WT, predation-deficient ΔKil, and evolved mutant M1 during predation on E. coli prey. The scatter plot depicts Ln(gDNA copies/μL) across various predation time points. gDNA concentrations were directly quantified using digital PCR (dPCR). Error bars indicate the SD derived from three biological replicates. Comparison of WT and M1 predation efficiency on B. subtilis (E) and C. crescentus (F), assessed by counting prey CFU after predation. The bar graph shows the mean prey survival in log10(CFU) after a 24-h coincubation ± SD derived from three biological replicates. Statistical significance was determined using one-way ANOVA, with post hoc multiple comparisons performed via the Dunnett test; ns: not significant, ****P < 0.0001.
Fig. 3.
Fig. 3.
Single nucleotide polymorphisms (SNPs) associated with efficient predation. (A) Genome sequencing revealed that the M1(C20E9) strain emerged after selection of an intermediate C10E9 strain. The WT ancestor differs from the C10E9 by 3 SNPs. Two additional SNPs separate the C10E9 transition from the M1. (B) Predation efficiency of the evolutionary intermediate C10E9 on E. coli. C10E9 exhibits an intermediate predation efficiency, situating between the killing capacities of WT and M1 strains when targeting E. coli prey. (C) Introduction of D79N mutation in the epsJ gene and deletion of MXAN_5856 (acoL) separately increases the WT strain predation efficiency. In combination, both mutations increase WT predation to C10E9 level. (D) Impact of epsJ gene on predation efficiency of WT and C10E9 strains. The reversed mutation N79D of the epsJ gene in C10E9 strain and epsJ gene deletion from both WT and C10E9 strains resulted in diminished predation efficiency, suggesting that the D79N mutation within the epsJ gene may be conferring a gain-of-function effect. (E) E. coli prey was subjected to predation by M. xanthus WT strains with introduced point mutations: S114L in CytC or M61I in ACOT, as well as M1 strains where these individual point mutations were reverted. (F) Impact of ACOT gene deletion on predation efficiency of WT and M1 strains. The deletion of the ACOT gene from both strains resulted in diminished predation efficiency, suggesting that the M61I mutation within the ACOT gene may be conferring a gain-of-function effect. All the bar graphs show the mean E. coli survival in log10(CFU) after a 24-h coincubation with different predator strains ± SD derived from a minimum of three biological replicates. Statistical significance was determined using one-way ANOVA, with post hoc multiple comparisons performed via the Dunnett test; ns: not significant, ***P < 0.001, ****P < 0.0001.
Fig. 4.
Fig. 4.
Similar gene expression patterns during WT predation and M1 alone, highlighting predatory readiness in M1. Top 50 genes from the list of 441 genes (Dataset S4) that show a consistent expression pattern in WT with prey (E. coli, B. subtilis, and C. crescentus) as compared to WT alone, and M1-alone as compared to WT alone (RNA-seq, n = 3 biological replicates per condition). Notable predation-specific genes expressed in the M1 alone include FA metabolism and redox enzymes like katB. The values shown in the heatmaps represent DESeq2normalized counts that have been scaled across conditions for each gene. Each column within the heatmaps represents the mean of three independent biological replicates.
Fig. 5.
Fig. 5.
Metabolic adaptation mechanisms in predator mutants. (A) Predicted exogenous FA-degradation pathway based on M. xanthus genome annotation. Long-chain fatty acids (LCFAs, ≥C12) are imported via the FadL transporter (1), while short-chain fatty acids (SCFAs, e.g., acetate) diffuse directly across the membrane. LCFAs are activated by acyl-CoA synthase FadD (2) and subsequently undergo β-oxidation through enzymes FadE (Acyl-CoA dehydrogenase, 3), FadB (enoyl-CoA hydratase and hydroxyacyl-CoA dehydrogenase, 4 and 5), and FadA (ketoacyl-CoA thiolase, 6), producing NADH and FADH2. In contrast, acetate is directly activated to acetyl-CoA by acetate-coA synthetase (9). Long-chain acyl-CoA and acetyl-CoA are deactivated by long-chain acyl thioesterase LcACOT and short-chain acyl-CoA ScACOT respectively (7 and 8). Acetyl-CoA enters both fatty acid biosynthesis and the TCA cycle, generating NADH and FADH2 for the ETC. Depending on ETC activity, electron overflow can occur, leading to ROS production. High ROS levels initiate oxidative stress pathways, enhancing antioxidant production and modulating iron homeostasis. (BE) Heatmap representations of gene expression profiles (RNA-seq) of genes annotated to be involved in fatty acid β-oxidation (B), TCA cycle (C); ETC (D); and antioxidant defense (E). Numbers (1 to 9) preceding the gene MXAN accession numbers in (B) indicate their functional annotation with respect to the cycle shown in (A). Strains compared: M. xanthus DZ2 WT, C10E9, and M1. Each column within the heatmaps represents an independent biological replicate. The values shown in the heatmaps represent DESeq2normalized counts that have been scaled across conditions for each gene. This scaling allows for the visualization of relative expression level changes for multiple genes simultaneously. However, it is important to note that this scaling does not accurately represent the absolute fold change differences between conditions.
Fig. 6.
Fig. 6.
Enzymatic activities of ACOL and ACOT enzymes. (A) AMP-forming acetyl-CoA ligase activity of purified MXAN_5856 ACOL enzyme with potassium acetate (KAcetate) as varying substrate, and CoASH, ATP as fixed substrates; Michaelis–Menten representations are displayed; values are means ± SD of three replicates. (B) Acetyl-CoA thioesterase activity of MXAN_2590 ACOT enzyme with acetyl-CoA substrate. Values are means ± SD of four replicates. (C) Long-chain acyl-CoA thioesterase activity of MXAN_2590 ACOT enzyme with myristoyl-CoA substrate. Values are means ± SD of four replicates.
Fig. 7.
Fig. 7.
ROS adaptation explains the M1 phenotype. (A) Influence of catalase addition on the predation of E. coli MG1655 by M. xanthus DZ2 strains. The bar graph illustrates the mean survival of E. coli MG1655 in log10(CFU) after a 24-h coincubation with M. xanthus DZ2 WT, predation-deficient ΔKil, and evolved mutant M1 predators, in the presence or absence of exogenously added, active or heat-inactivated catalase (5 µg/mL). Each bar denotes the mean ± SD from three biological replicates. Pairwise statistical comparisons were made using Mann–Whitney U tests, with P-values indicated on the graph. (B) Deletion of katB in M1 diminishes its predation efficiency. The bar graph presents the average survival of E. coli MG1655, expressed in log10(CFU), after a 24-h coincubation with various M. xanthus DZ2 predators: WT, predation-deficient ΔKil, evolved mutant M1, and a katB-deleted variant of M1. Each bar represents mean ± SD derived from three biological replicates. Statistical significance was determined using one-way ANOVA, with subsequent multiple comparisons conducted using the Dunnett test; ****P < 0.0001. (C) Expression patterns (RNA-seq) of genes associated with hydroxyl radical production in E. coli subject to antibiotics stress (28) in response to WT M. xanthus and the Δkil mutant strain of M. xanthus. Each column within the heatmaps represents an independent biological replicate. The values shown in the heatmaps represent DESeq2normalized counts that have been scaled across conditions for each gene. (D) Time-lapse fluorescence microscopy images revealing E. coli intracellular ROS accumulation upon interaction with the M. xanthus DZ2 ΔT3SS mutant, a strain that kills without lysing the prey. Before the interaction with the M. xanthus predator, E. coli prey cells had been incubated with the ROS-sensitive dye CM-H2DCFDA, which emits green fluorescence upon oxidation. Time points postinteraction are represented at 0, 10, 20, and 30 min. The displayed images are representative of two independent experiments. (E) Schematic of the droplet assay used to quantify oxidative stress produced by E. coli during predation. Suspensions of E. coli and M. xanthus, along with HFE7500 oil, were introduced into a custom droplet chip. Top: Myxococcus cells expressed GFP, and E. coli expressed mCherry. Water-in-oil microdroplets were generated using CF media. Over time, fluorescent E. coli cells disappeared while Myxococcus cells multiplied, indicating predation within the microdroplets. Bottom: In the oxidative stress experiment, E. coli was preincubated with CM-H2DCFDA, and neither M. xanthus nor E. coli were fluorescently labeled, allowing only the green fluorescence from oxidized CM-H2DCFDA to be recorded. Note that overtime, the droplets turn green as CM-H2DCFDA is released and oxidized. (F) Quantification of CM-H2DCFDA oxidation in the droplets. The graph depicts mean intensity data derived from approximately 700 droplets per experiment, gathered across three distinct experiments, each spanning a 15-h recording period. Fluorescent intensity values for each condition were normalized using the mean fluorescent value at the first time point to illustrate the relative increase in fluorescence over time. Each data point on the graph represents the average of three experiments, each encompassing around 700 droplets, with error bars indicating the SE across these three experiments.

Similar articles

Cited by

References

    1. Meena R. S., et al. , Impact of agrochemicals on soil microbiota and management: A review. Land 9, 34 (2020).
    1. Barros-Rodríguez A., Rangseekaew P., Lasudee K., Pathom-Aree W., Manzanera M., Impacts of agriculture on the environment and soil microbial biodiversity. Plants 10, 2325 (2021). - PMC - PubMed
    1. Seabrook L., Mcalpine C. A., Bowen M. E., Restore, repair or reinvent: Options for sustainable landscapes in a changing climate. Landsc. Urban Plan. 100, 407–410 (2011).
    1. Thiery S., Kaimer C., The predation strategy of Myxococcus xanthus. Front. Microbiol. 11, 513035 (2020). - PMC - PubMed
    1. Hungate B. A., et al. , The functional significance of bacterial predators. mBio 12, e00466-21 (2021). - PMC - PubMed

MeSH terms

LinkOut - more resources