. 2025 Jan 27;8(4):e202402907.
doi: 10.26508/lsa.202402907. Print 2025 Apr.

A role for mitochondria-ER crosstalk in amyotrophic lateral sclerosis 8 pathogenesis

Affiliations

A role for mitochondria-ER crosstalk in amyotrophic lateral sclerosis 8 pathogenesis

Cathal Wilson et al. Life Sci Alliance. .

Abstract

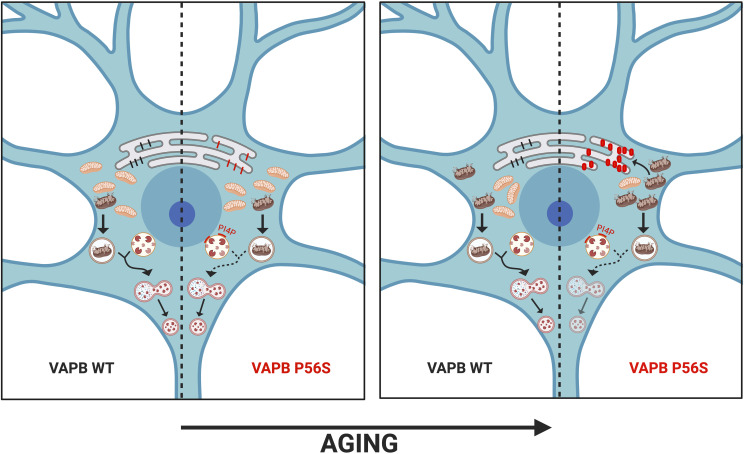
Protein aggregates in motoneurons, a pathological hallmark of amyotrophic lateral sclerosis, have been suggested to play a key pathogenetic role. ALS8, characterized by ER-associated inclusions, is caused by a heterozygous mutation in VAPB, which acts at multiple membrane contact sites between the ER and almost all other organelles. The link between protein aggregation and cellular dysfunction is unclear. A yeast model, expressing human mutant and WT-VAPB under the control of the orthologous yeast promoter in haploid and diploid cells, was developed to mimic the disease situation. Inclusion formation was found to be a developmentally regulated process linked to mitochondrial damage that could be attenuated by reducing ER-mitochondrial contacts. The co-expression of the WT protein retarded P56S-VAPB inclusion formation. Importantly, we validated these results in mammalian motoneuron cells. Our findings indicate that (age-related) damage to mitochondria influences the propensity of the mutant VAPB to form aggregates via ER-mitochondrial contacts, initiating a series of events leading to disease progression.


Conflict of interest statement

The authors declare that they have no conflict of interest.

Figures

None
Graphical abstract
Figure 1.
Figure 1.. Yeast model for ALS8.
(A) Schematic representation of the synthetic VAPB construct containing the human VAPB coding sequence, with monomeric GFP inserted before the transmembrane domain (TMD), under the control of the SCS2 promoter and terminator. (B) Localization of WT-VAPB-mGFP after insertion into the genome to replace the yeast SCS2 gene. Sites of major fluorescence intensity are indicated. nER, perinuclear ER; cER, cortical ER; NVJ, nuclear–vacuole junction. Scale bars, 2 μm. (C) Stationary-phase cells expressing WT-VAPB-mGFP or P56S-VAPB-mGFP. Scale bars, 2 μm. (D) VAPB inclusions form in the NQ population of stationary-phase cells. Cells expressing P56S-VAPB-mGFP and MTS-Cherry (to visualize mitochondria) were grown to the stationary phase and then subjected to a Percoll gradient to separate quiescent (Q) from non-quiescent (NQ) cells. Scale bars, 2 μm. (E) P56S-VAPB-mGFP–expressing log-phase cells left untreated (CTRL) or subjected to acute glucose depletion (glucose dep) or treatment with NaN3 (0.5 mM, 60 min). Scale bars, 2 μm.
Figure S1.
Figure S1.. Functionality of WT-VAPB and P56S-VAPB in yeast.
(A) Inositol auxotrophy of scs2Δ is partially complemented by WT-VAPB but not by P56S-VAPB. Because the BY4742 strain is a partial inositol auxotroph (Hanscho et al, 2012), it was necessary to supplement the inositol-depleted medium with 1 mM inositol to support growth. (B) Fluorescence microscopy of log-phase cells expressing WT-VAPB-GFP or P56S-VAPB-GFP. Both cell lines also expressed the mitochondrial reporter MTS-Cherry. See text and Fig 1D for localization. (C) Calorie restriction suppresses inclusion formation in stationary-phase cells. Cells expressing P56S-VAPB-GFP and MTS-Cherry were grown in YPD plus 2% glucose (top) or YPD plus 0.5% glucose (bottom) to the stationary phase (3 d) and then observed by fluorescence microscopy. The number indicates the percentage of cells forming inclusions, n = 400.
Figure 2.
Figure 2.. Yeast inclusions exhibit characteristics of mammalian inclusions.
(A) Cells expressing either GFP-tagged (left panels) or untagged (right panels) WT-VAPB or P56S-VAPB were left untreated (CTRL) or treated with NaN3 (0.5 mM, 60 min) and then processed for Triton X-100 resistance. Samples were processed for Western blot analysis and detected with an anti-VAPB antibody. TL = total lysate; S21 = 21,000g supernatant; P21 = 21,000g pellet (microsomal fraction); S21T = 21,000g supernatant after Triton X-100 extraction of the P21 pellet; P21T = 21,000g pellet after Triton X-100 extraction of the P21 pellet. (B) CLEM showing paired ER cisternae. Left, fluorescence image of a resin section of cells expressing P56S-VAPB-mGFP treated with NaN3. The circled inclusion was targeted by CLEM. Middle, virtual slice through electron tomogram corresponding to the circled structure. Yellow arrows and green arrows indicate two stacked structures. Right, a segmentation model of the stack colored according to the arrows in the middle panel. Scale bars from left to right: 2 μm, 50 nm, 25 nm. (C) In vitro pull-down assays. SUMO-His-tagged WT or P56S MSP domains, or SUMO-His alone, attached to Ni beads, were incubated with untagged WT or P56S MSP domains, with or without DTT. After washing, the beads were treated with gel loading buffer, separated by PAGE, and transferred to nitrocellulose. Top panel, Ponceau S staining of the SUMO-His proteins. Bottom panel, the area of the membrane corresponding to the untagged MSP domains at ∼14 kD was immunodetected with an anti-VAPB antibody. (D) Ponceau S staining and Western blot analysis of SUMO-His-tagged WT or P56S-VAPB MSP domains in the presence of DTT (10 and 20 mM). The P56S MSP domain associates in multiple oligomeric forms, which are not present for the WT MSP domain. (E) Liposome aggregation assays. Top panel, WT or mutant MSP domain–covered liposomes were incubated with or without DTT. The absorbance (OD) at 410 nm was measured every 2 min over a period of 90 min using Neo2 Microplate Reader. Bottom panel, the same assay with liposomes or the VAPB MSP domains incubated separately. (F) P56S-VAPB-mGFP yeast cells were treated with H2O2 in the presence or absence of the antioxidant N-acetylcysteine (NAC). Scale bars, 2 μm. Source data are available for this figure.
Figure 3.
Figure 3.. WT-VAPB slows down inclusion formation in yeast cells.
(A) Fluorescence images of log-phase diploid yeast cells expressing differentially tagged VAPB (WT-VAPB-GFP with WT-VAPB-RUBY and WT-VAPB-GFP with P56S-VAPB-RUBY). Scale bars, 2 μm. (B) Diploid cells expressing differentially tagged VAPB (WT-VAPB-GFP with WT-VAPB-RUBY or P56S-VAPB-GFP with WT-VAPB-RUBY) were glucose-depleted for 60 min. Scale bars, 2 μm. (C) Haploid cells expressing P56S-VAPB-GFP or diploid cells expressing P56S-VAPB-GFP and WT-VAPB-RUBY were glucose-depleted, and inclusion formation was monitored over time (min). Inclusions form in haploid cells after 60 min but take up to 120 min to form in the diploid. Numbers in the panels indicate the percentage of cells forming inclusions at each time point. Scale bars, 2 μm. (D) Diploid cells expressing P56S-VAPB-GFP and WT-VAPB-RUBY were treated with 0.5 mM NaN3, 120 min. Scale bars, 2 μm.
Figure S2.
Figure S2.. Untagged WT-VAPB slows down P56S-VAPB inclusion formation.
Diploid cells expressing untagged WT-VAPB or untagged P56S-VAPB together with WT-VAPB-GFP or P56S-VAPB-GFP were glucose-depleted or treated with NaN3 for 60 min.
Figure 4.
Figure 4.. WT-VAPB slows down inclusion formation in mammalian cells.
(A) Western blot analysis of protein extracts from WT, B6, and B1 NSC-34 cell lines (B6 and B1 were previously determined to express 40% and 10% of residual VAPB expression, respectively; Genevini et al, 2019). The blot was detected with an anti-VAPB antibody, and an anti-actin antibody was used as a loading control. (B) Representative images of WT NSC-34 cells transfected with (a) WT-VAPB or (b) P56S-VAPB, and (c) B6 and (d) B1 NSC-34 cells transfected with P56S-VAPB. The cells were immunostained with an anti-VAPB antibody. Scale bars, 10 μm. (B, C) Quantification of the percentage of P56S-VAPB–transfected cells in (B) showing P56S-VAPB aggregates. N = 6, n > 100. Statistical significance among groups was calculated by Welch’s one-way ANOVA with Dunnett’s post hoc test for multiple comparisons. **P < 0.01, ***P < 0.001, ****P < 0.0001. (D) Quantification of the percentage of P56S-VAPB–transfected B1 cells forming aggregates in control (CTRL) or under VAPA down-regulation (VAPA KD). N = 3, n > 100. **P < 0.01, unpaired t test. Source data are available for this figure.
Figure 5.
Figure 5.. Mitochondrial damage, but not a drop in ATP levels, induces P56S-VAPB inclusion formation.
(A) P56S-VAPB-GFP cells were subjected to acute galactose depletion (gal dep) and acute galactose depletion with the addition of antimycin A (gal dep + AA) or grown in 0.2% glucose and treated with 2-deoxyglucose (2-DOG; see the Materials and Methods section). Scale bars, 2 μm. (A, B) Quantification of the percentage of cells with inclusions under the conditions described in (A) and in glucose-depleted cells (gluc dep) and NaN3-treated cells (0.5 mM, 60 min), as shown in Fig 1E. Mean ± SD. N = 3, n > 150. (C) Time course of inclusion formation after acute glucose or galactose depletion. Cells expressing P56S-VAPB-mGFP were grown to the log phase in glucose or galactose as a carbon source, washed, and resuspended in SC (YNB + amino acids, minus a carbon source) for the indicated times (min). Scale bars, 2 μm. (D) ATP levels were measured at the indicated times under the indicated conditions and expressed as a percentage of the ATP level at T = 0 (set at 100%). ATP levels are shown for SD containing 0.2% glucose as a control for the 2-DOG treatment (see the Materials and Methods section). N = 3; data are presented as the mean ± SEM. Source data are available for this figure.
Figure S3.
Figure S3.. Inclusion formation is not due to molecular crowding.
(A) Conditions that induce inclusion formation also cause vacuolar fusion, potentially leading to molecular crowding. Left panel, at a low concentration of NaN3 (0.1 mM), cells have large vacuoles, but not all cells have inclusions (asterisks). Middle panel, acute galactose-depleted cells (gal dep) have large vacuoles (asterisks) without inclusion formation. Right panel, this could be due to the lower expression of VAPB in galactose medium. However, strong induction occurs after the addition of antimycin A. (B) Vacuolar pH is not affected by conditions that induce inclusion formation. Left panels, cells expressing untagged P56S-VAPB were treated with DMSO (CTRL), 0.5 mM NaN3, or bafilomycin (BAF, which dissipates the vacuolar pH) and then stained with quinacrine (which stains acidic vacuoles; Weisman et al, 1987). Right panels, inclusion formation in the GFP-tagged strain was tested in parallel under the same conditions. (C) Left panels, quinacrine staining of quiescent (Q) and non-quiescent (NQ) cells expressing untagged P56S-VAPB. Right panels, the GFP-tagged strain was processed in parallel.
Figure S4.
Figure S4.. UPR does not induce inclusions, and inclusions do not induce the UPR.
(A) Cells deleted for IRE1 (ire1Δ), required for the UPR, do not show any alteration in inclusion formation in the stationary phase. (B) ire1Δ cells do not show any alteration in inclusion formation in response to induction with different concentrations of NaN3. N = 2, n > 150. (C) Indicated strains were treated with NaN3 (0.5 mM, 60 min) to induce inclusions or with DTT (8 mM, 60 min) to induce the UPR, or left untreated (CTRL). Protein extracts were processed for Western analysis and probed with an anti-Kar2 antibody, to test the UPR, and anti-Pgk1 as a loading control. (D, E, F) Inclusion formation does not correlate with mitochondrial fragmentation. (D) Treatment of cells expressing P56S-VAPB-GFP and MTS-Cherry with a low concentration of NaN3 (0.1 mM) fragments the mitochondria without inducing inclusions in all cells (asterisks). (E) WT (BY4742) and dnm1Δ cells expressing P56S-VAPB-GFP and transformed with the plasmid pMTS-Cherry were left untreated (CTRL) or treated with 0.3 mM NaN3. Deletion of the dynamin gene DNM1 renders cells resistant to NaN3-induced mitochondrial fragmentation (Fekkes et al, 2000). Inclusions formed in all cells in the absence of mitochondrial fragmentation (asterisks). (F) Mitochondrial membrane potential is not dissipated by conditions used in this study to induce inclusion formation. Cells were transformed with a plasmid encoding MTS-GFP to label mitochondria. Transformants were grown to the log phase in glucose (gluc) and then glucose-depleted (gluc dep), treated with NaN3, or treated with CCCP as a control. They were then stained with MitoTracker Red CMXRos, whose accumulation depends on membrane potential.
Figure 6.
Figure 6.. Disruption of ER–mitochondrial contact sites in yeast attenuates inclusion formation.
(A) P56S-VAPB-GFP construct was inserted into the genome of the indicated gene deletion strains and analyzed for inclusion formation using 0.1 mM NaN3. The percentage of cells with inclusions is shown, mean ± SD. N = 3, n > 300. *P < 0.1, ***P < 0.005, relative to WT, unpaired t test. (B) Hypersensitivity to inclusion induction in num1Δ cells. P56S-VAPB-GFP–expressing cells with an otherwise WT genetic background (BY4742) or with the NUM1 gene deleted (num1Δ) were treated with 0.05 mM or 0.1 mM NaN3. Scale bars, 2 μm. (C) ERMES deletion reduces the hypersensitivity of num1Δ cells. Cells expressing P56S-VAPB-GFP with deletion of NUM1 (num1Δ) or NUM1 and the ERMES subunit gene MDM34 (num1Δ/mdm34Δ) were treated with 0.1 mM NaN3. Scale bars, 2 μm. (D) Quantification of the percentage of cells with P56S-VAPB inclusions in the indicated strains, mean ± SD. N = 3, n > 300. **P < 0.05, unpaired t test. Source data are available for this figure.
Figure S5.
Figure S5.. Characterization of ERMES in Δnum1 cells.
(A) Log-phase cells expressing VAPB-GFP in a WT, dnm1Δ, num1Δ, or fzo1Δ genetic background. Cells were transformed with a plasmid encoding MTS-Cherry as a mitochondrial marker. dnm1Δ and num1Δ cells have elongated mitochondria, whereas fzo1Δ cells have fragmented mitochondria. Mitochondria tend to have a more centralized location in num1Δ cells. Scale bars, 2 μm. (B) WT and num1Δ cells expressing Mdm34-GFP with and without NaN3 treatment. WT cells exhibit the typical dispersed ERMES pattern, whereas num1Δ show a more centralized location reflecting the centralized location of the mitochondria. Scale bars, 2 μm. (C) WT cells (BY4741) expressing MTS-Cherry and the ERMES component Mdm34-GFP with and without NaN3 treatment. Mdm34-GFP is associated with mitochondria under both conditions. Scale bars, 2 μm.
Figure 7.
Figure 7.. Down-regulation of PTPIP51 reduces P56S-VAPB aggregate formation in mammalian cells.
(A) Representative immunofluorescence images of NSC-34 B1 cells treated with non-targeting (NT) or PTPIP51 (KD) siRNA and then transfected with a P56S-VAPB–expressing plasmid. The cells were immunostained for VAPB and TOM20. Scale bars, 10 μm. (B) qRT–PCR analysis of PTPIP51 expression after treatment with PTPIP51 siRNA expressed as a fold change with respect to non-targeting (NT) treated WT NSC-34 cells, or the B1 and B6 clones. Mean ± SD, N = 3. (C) Quantification of the transfected cells that form P56S aggregates, expressed as a fold change with respect to non-targeting (NT) treated cells. N = 6, n > 100. Statistical significance between non-silenced (NT) and PTPIP51-KD (KD) was calculated by a ratio paired t test. *P < 0.05, ***P < 0.001. Source data are available for this figure.

Similar articles

References

    1. Ader NR, Kukulski W (2017) triCLEM: Combining high-precision, room temperature CLEM with cryo-fluorescence microscopy to identify very rare events. Methods Cell Biol 140: 303–320. 10.1016/bs.mcb.2017.03.009 - DOI - PubMed
    1. Allen C, Büttner S, Aragon AD, Thomas JA, Meirelles O, Jaetao JE, Benn D, Ruby SW, Veenhuis M, Madeo F, et al. (2006) Isolation of quiescent and nonquiescent cells from yeast stationary-phase cultures. J Cell Biol 174: 89–100. 10.1083/jcb.200604072 - DOI - PMC - PubMed
    1. Altman T, Geller D, Kleeblatt E, Gradus-Perry T, Perlson E (2019) An in vitro compartmental system underlines the contribution of mitochondrial immobility to the ATP supply in the NMJ. J Cell Sci 132: jcs234492. 10.1242/jcs.234492 - DOI - PubMed
    1. Ashe MP, De Long SK, Sachs AB (2000) Glucose depletion rapidly inhibits translation initiation in yeast. Mol Biol Cell 11: 833–848. 10.1091/mbc.11.3.833 - DOI - PMC - PubMed
    1. Booth DM, Enyedi B, Geiszt M, Várnai P, Hajnóczky G (2016) Redox nanodomains are induced by and control calcium signaling at the ER-mitochondrial interface. Mol Cell 63: 240–248. 10.1016/j.molcel.2016.05.040 - DOI - PMC - PubMed

MeSH terms

Substances