. 2025 Jan 27;16(1):970.
doi: 10.1038/s41467-025-55900-3.

Genetic coupling of enhancer activity and connectivity in gene expression control

Affiliations

Genetic coupling of enhancer activity and connectivity in gene expression control

Helen Ray-Jones et al. Nat Commun. .

Abstract

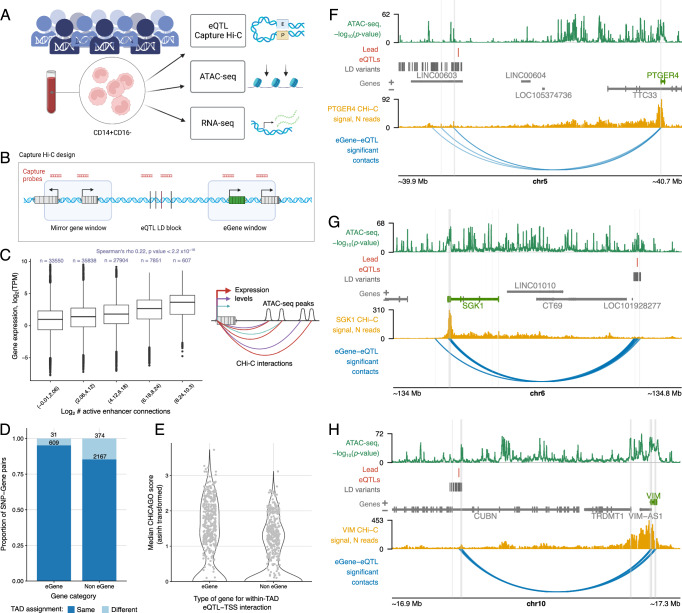
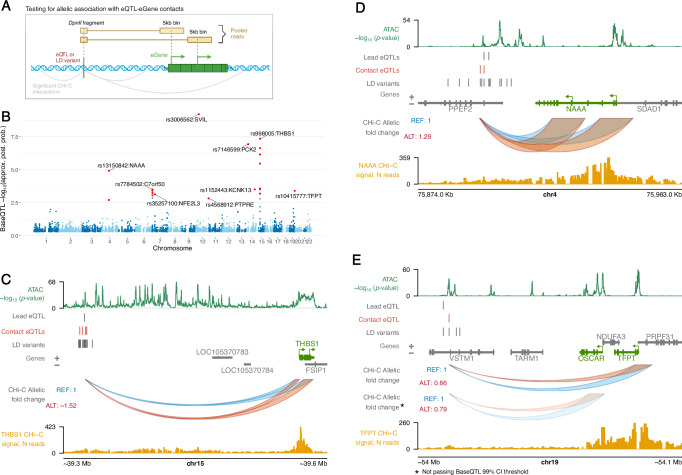
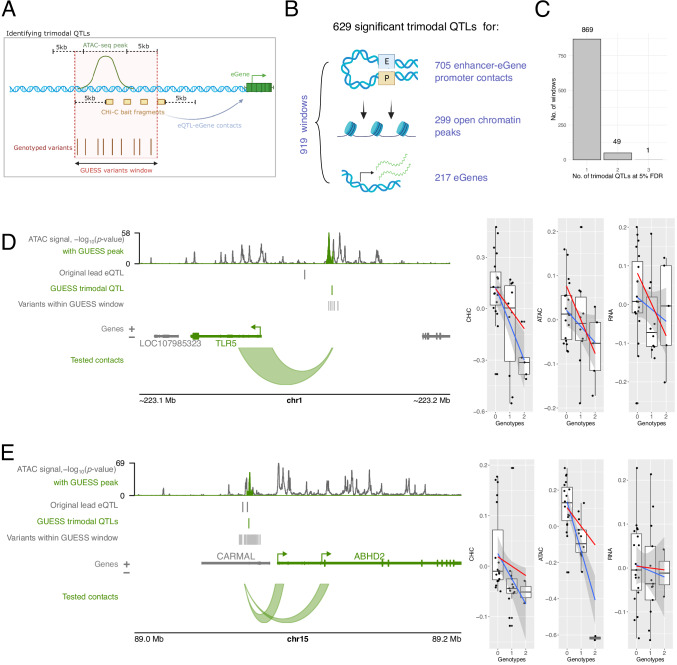
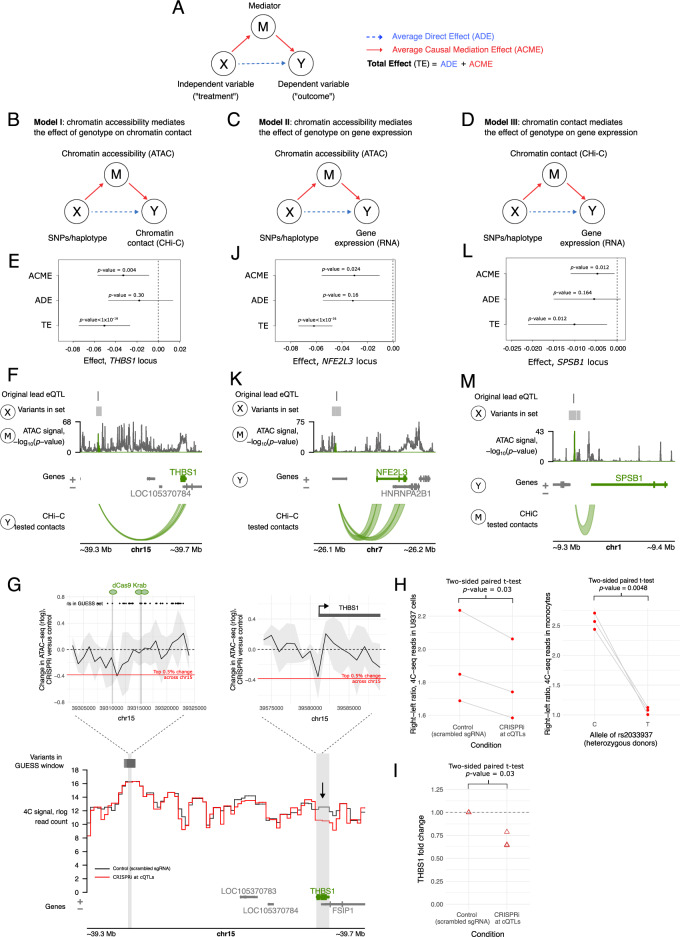
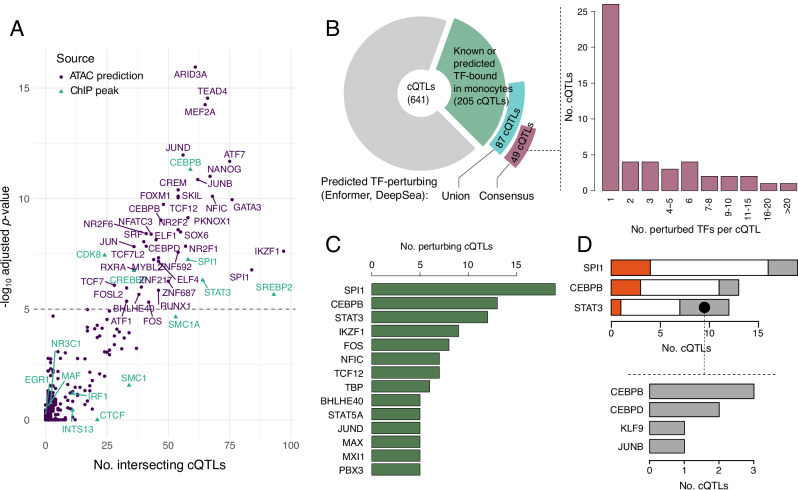
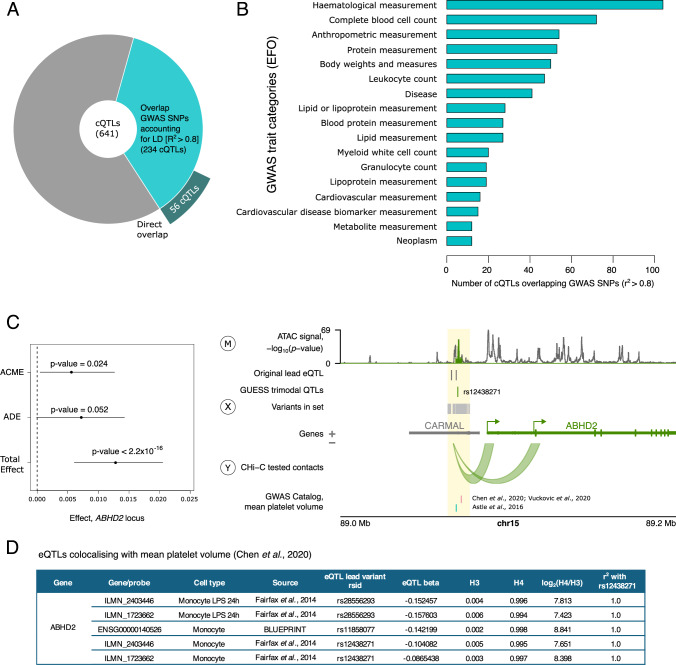
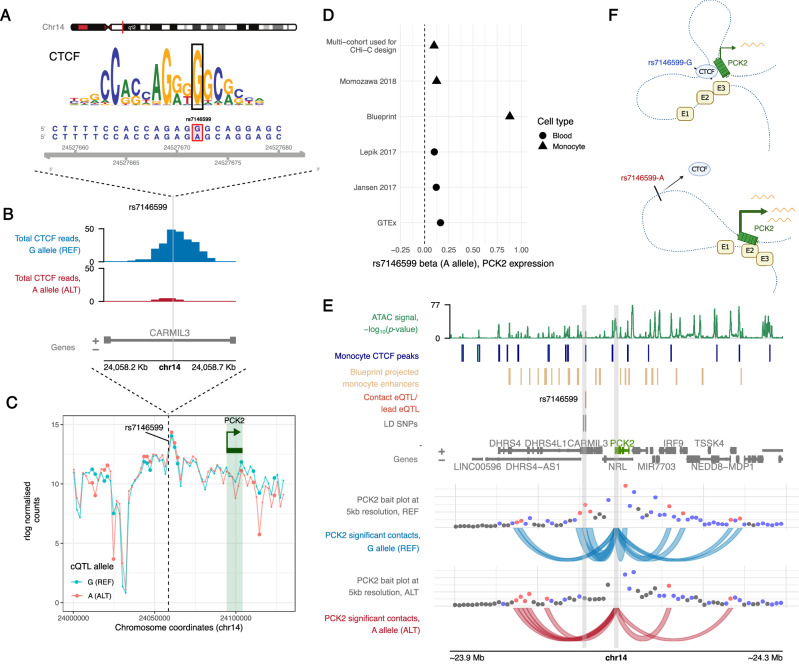
Gene enhancers often form long-range contacts with promoters, but it remains unclear if the activity of enhancers and their chromosomal contacts are mediated by the same DNA sequences and recruited factors. Here, we study the effects of expression quantitative trait loci (eQTLs) on enhancer activity and promoter contacts in primary monocytes isolated from 34 male individuals. Using eQTL-Capture Hi-C and a Bayesian approach considering both intra- and inter-individual variation, we initially detect 19 eQTLs associated with enhancer-eGene promoter contacts, most of which also associate with enhancer accessibility and activity. Capitalising on these shared effects, we devise a multi-modality Bayesian strategy, identifying 629 "trimodal QTLs" jointly associated with enhancer accessibility, eGene promoter contact, and gene expression. Causal mediation analysis and CRISPR interference reveal causal relationships between these three modalities. Many detected QTLs overlap disease susceptibility loci and influence the predicted binding of myeloid transcription factors, including SPI1, GABPB and STAT3. Additionally, a variant associated with PCK2 promoter contact directly disrupts a CTCF binding motif and impacts promoter insulation from downstream enhancers. Jointly, our findings suggest an inherent genetic coupling of enhancer activity and connectivity in gene expression control relevant to human disease and highlight the regulatory role of genetically determined chromatin boundaries.


Conflict of interest statement

Competing interests: M.S. is a shareholder of Enhanc3D Genomics Ltd. C.W. is supported by GSK and MSD and is a part-time employee of GSK. GSK had no role in this study or the decision to publish. The remaining authors declare no competing interests.

Figures

Fig. 1
Fig. 1. A compendium of eQTL CHi-C contacts and accessibility in primary monocytes.
A Overview of the main data collection steps. Created in BioRender: https://BioRender.com/v74s856. B Design of the eQTL CHi-C experiment. We designed capture probes targeting DpnII fragments harbouring previously identified lead eQTLs in monocytes. We also included variants in tight LD with the lead eQTLs in regulatory regions, eGene promoters and the promoters of distance-matched ‘non-eGenes’, which were similar distances from the eQTLs as the eGenes but not associated with their expression. Created in BioRender: https://BioRender.com/z90t537. C Relationship between the number of interacting enhancers and gene expression. Two-sided Spearman’s rank correlation was performed on log2(number active enhancers) against log2(expression TPM) for 5729 genes in 34 samples. Boxplots show 25th, 50th and 75th percentiles, with upper and lower whiskers to the largest or smallest value no further than 1.5 x the interquartile range from the hinge. Graphic created in BioRender: https://BioRender.com/s35y475. D Degree of TAD sharing between eQTLs and eGenes or eQTLs and non-eGenes. E Inverse hyperbolic sine (asinh)-transformed median CHiCAGO scores for interactions between eQTLs and eGenes or non-eGenes within the same TAD. The score for the eGene is shown against the median score for all captured control genes, per eQTL, including cases where the score was zero. Examples of eQTLs intersecting ATAC-seq peaks and interacting with the eGenes: PTGER4 (F), SGK1 (G) and VIM (H). ATAC data are presented as −log10(p value) for the consensus dataset (detected by Genrich). eGenes are highlighted in green. Contact profiles show the number of reads for each other-end fragment contacting the fragment containing the eGene promoter in the consensus dataset. The eQTL-eGene significant contacts were called using the shown consensus CHi-C interactions (CHiCAGO statistical algorithm on consensus data (score ≥ 5), at DpnII-fragment level). Interactions are restricted to those involving the eQTL or a SNP in tight LD and the eGene promoter. Baited regions are shown as a grey highlight. FH were plotted using the Plotgardener R package. Source data for CE are available on OSF.
Fig. 2
Fig. 2. Detection and examples of contact eQTLs.
A Strategy for testing eQTL-eGene contacts. Created in BioRender: https://BioRender.com/l19m785. B Manhattan plot of BaseQTL results. The y-axis shows the negative logarithm of the probability that the candidate SNP is not a true QTL for promoter contact: approximate posterior probability (approx. post. prob.; see ‘Methods’). The significant contact eQTLs (for which the 99% credible interval does not contain zero) are depicted in red. The contact eQTL with the highest probability of being a true QTL for promoter contact is labelled in loci with multiple significant contact eQTLs. CE Genomic visualisation of significant contact eQTLs in the THBS1, NAAA and TFPT loci. The arches, whose heights correspond to the allelic fold change in contact, show the tested contacts between the eQTL and promoter(s) of the eGene (one eQTL-containing DpnII bait fragment is shown in each case). CHi-C read counts at DpnII fragment resolution are shown from the viewpoint of the eGene promoter (yellow signal tracks). ATAC data is presented as −log10(p value) on consensus data (detected by Genrich). CE were plotted using the Plotgardener package. CI, confidence interval.
Fig. 3
Fig. 3. Shared genetic effects on enhancer activity, enhancer-promoter contact and gene expression.
A Strategy for detecting ATAC QTLs with BaseQTL. Created in BioRender: https://BioRender.com/v31q004. B Shared allelic effects of QTLs on accessibility and promoter contact at 99% credible interval. C Heatmap of cross-trait effects for contact eQTLs. The positive effect allele (either REF or ALT) is shown for CHi-C, and the direction of effects in other traits (whether log allelic fold change or beta) is shown relative to this. We only show effects for features within 5 kb of the contact eQTL, and we accounted for LD (r2 ≥ 0.9). The ATAC QTL effects were taken from BaseQTL results within our 34-donor cohort, whereas the remainder of effects (gene expression, H3K27ac and H3K4me1) were curated from outside of our cohort. The eQTL effects were taken from the original monocyte study or from Blueprint. The histone modifications H3K27ac and H3K4me1 were taken from Blueprint WP10 Phase 2. Epigenetic mechanisms within example contact eQTL loci: (D) THBS1, (E) NAAA, F KCNK13. The red regions show upregulated peaks of ATAC, H3K27ac and H3K4me1 associated with the contact eQTL (or SNPs in LD, r2 ≥ 0.9); the peaks shown in these plots were not restricted to 5 kb from the contact eQTL. ATAC-seq tracks show the pileups for merged homozygous reference (blue) or homozygous alternative (red) donors for one of the contact eQTLs as an approximation of the allele-specific signal across the locus. Black arrows indicate the ATAC-seq peaks and the fold changes associated with the alternative genotype of each contact eQTL in the BaseQTL analysis (see also Supplementary Data 8). DF were plotted using the Plotgardener package. Source data for (B) and (C) are available on OSF.
Fig. 4
Fig. 4. Detection and examples of trimodal QTLs.
A Strategy for detecting trimodal QTLs using GUESS. Regions within 5 kb of ATAC-seq peaks and CHi-C DpnII bait fragments were identified, and all genotyped variants were queried within these regions. Created in BioRender: https://BioRender.com/f51r706. B Overview of the significant findings from the GUESS analysis. Created in BioRender: https://BioRender.com/w52b348. C Number of trimodal QTLs at 5% FDR that best explained the observed phenotypes in each window. D, E Examples of GUESS loci where the best model (combination of genetic variants with the largest marginal likelihood score) contained a single trimodal QTL (also significant at 5% FDR) that was associated with chromosomal contact with the eGene (TLR5 and ABHD2, respectively), chromatin accessibility (highlighted in green in ATAC-seq track) and eGene expression. ATAC-signal is shown as −log10(p value) pileups determined by Genrich. Boxplots show the genetic effects of the variant on each modality (boxes show 25th, 50th and 75th percentiles, with upper and lower whiskers to the largest or smallest value no further than 1.5 x the interquartile range from the hinge). The red lines represent the regression lines based on the posterior mean of the regression coefficients of the GUESS model, and the blue lines represent the Maximum Likelihood Estimation (MLE) with a 95% confidence interval. Panels (D) and (E) were plotted using the Plotgardener R package. Source data for CE are available on OSF.
Fig. 5
Fig. 5. Evidence for causal relationships at trimodal QTLs.
A The causal mediation strategy. BD Overview of the three types of models considered. E, F Example of Model I with full mediation. Plot E summarises the Average Causal Mediation Effect (ACME), Average Direct Effect (ADE) and Total Effect (TE) (dot—mean effect, lines—95% bootstrap confidence intervals; non-significant if spanning 0; two-sided p values were computed using the non-parametric bootstrap procedure in the R package mediation). The ADE confidence interval spans zero, indicating full mediation. Plot (F) shows the three modalities in the mediation model: SNPs/haplotype, i.e. the genetic variants in the GUESS set X, the ATAC-seq signal as a mediator M and chromatin contact with the eGene promoter as the outcome Y. G CRISPRi at the cQTLs in the THBS1 locus. Top left: Change in ATAC-seq signal at the location of CRISPRi perturbation (grey lines show dCas9-KRAB target regions). The black line shows the change in ATAC-seq in CRISPRi U-937 cells with locus-targeting versus non-targeting gRNAs (rlog reads, mean of three biological replicates), grey ribbon represents standard deviation and red line shows top 5% change across a 2 Mb window. Top right: CRISPRi-induced change in ATAC-seq at the canonical THBS1 promoter. Bottom: CRISPRi-induced change in mean 4C-seq signal (N = 3 per condition). Vertical grey bars show the viewpoints at the cQTLs and THBS1; the black arrow highlights 4C-seq signal at THBS1 promoter (difference not statistically significant, FDR-adjusted p value = 0.66). H Left plot: a global shift in contact directionality from the cQTL region within a 2 Mb window. Right plot: the shift observed in allele-specific 4C seq in primary monocytes (three heterozygotes for cQTL rs2033937). I qPCR-detected fold change in THBS1 expression in CRISPRi cells versus control cells (N = 3). The p value is from a two-sided, paired T-test on ΔCt values (Supplementary Fig. 6C). JM Examples of full mediation in Models II and III, respectively, similar to (E, F). F, G, K, M used the Plotgardener R package. Source data for E, GJ, L are available on OSF.
Fig. 6
Fig. 6. Effects of contact QTLs on TF binding.
A Significantly enriched TFs at cQTLs using monocyte ChIP-seq peaks (ReMap catalogue and in-house CTCF, green triangles) and ATAC-seq predicted binding (union of peaks from MaxATAC and footprints from TOBIAS, per TF, purple dots). TFs with adjusted q value > 5 from Remapenrich are labelled, indicating a p value < 0.05 after adjusting for multiple testing. All ChIP-seq TFs are labelled for reference. The source data for significant TFs can be found in Supplementary Data 12. B Pie chart: cQTLs with predicted perturbations in TF binding, detected by Enformer or DeepSea. The green segment shows the number of cQTLs binding TFs. The blue and purple segments show the number of cQTLs that are further predicted to perturb the binding of those TFs, either through the union (blue) or consensus (purple) of Enfomer and DeepSea. Bar chart: histogram of the number of TFs predicted to be perturbed by cQTLs with at least one TF perturbation. C TFs whose binding was predicted to be perturbed by at least 10 cQTLs. D Top: numbers of cQTLs with predicted effects on the binding of SPI1, CEBPB and STAT3 that disrupted the known sequence binding motif for either the same (red) or other predicted perturbed TFs (grey). Bottom: TF motifs disrupted by cQTLs that were predicted by Enformer to perturb STAT3 binding jointly with other TFs but did not disrupt the known STAT3 motif. Source data for AD are available on OSF.
Fig. 7
Fig. 7. Trimodal QTLs overlap variants associated with healthy and pathological traits.
A Pie chart showing the number of cQTLs intersecting GWAS loci through LD (light blue) or the same variant (dark blue). B Number of cQTLs in each of the GWAS trait categories from the Experimental Factor Ontology (EFO). C Example of a trimodal locus with evidence for causal mediation associated with a human trait: mean platelet volume. The forest plot on the left shows the result of the mediation analysis, summarising the three effects (ACME, ADE and Total Effect; (dot—mean effect, lines—95% bootstrap confidence intervals; non-significant if spanning 0; two-sided p values were computed using the non-parametric bootstrap procedure in the R package mediation). Since the ADE confidence interval spans 0 in this case, this is an example of full mediation. On the right, the locus plot at ABHD2 shows the intersection between the trimodal QTL locus and the GWAS locus for mean platelet volume (yellow highlighted region). The letters in circles represent the three modalities in the mediation model: SNPs/haplotype, i.e. the genetic variants in the GUESS set (treatment, X), the ATAC-seq signal (mediator, M) and chromatin contact with the eGene promoter (outcome, Y). ATAC-signal is shown as −log10(p value) pileups determined by Genrich. D Evidence from Open Targets Genetics for eQTL signals for ABHD2 in monocytes colocalising with the GWAS signal for mean platelet volume. The H3 value shows the posterior probability of two different causal variants, and H4 is the posterior probability of one causal variant, with the log2 ratio showing the posterior probability evidence for versus against shared causal variants. The final column shows the LD, as a measure of r2, between the lead eQTL variant and the trimodal QTL, rs12438271. The locus plot in (C) was generated using the Plotgardener R package. Source data for AC are available on OSF.
Fig. 8
Fig. 8. A contact eQTL perturbs CTCF binding and chromatin insulation.
A Position of rs7146599 within the CTCF motif. B ChIP-seq reads for CTCF intersecting the reference allele (G, blue) or alternative allele (A, red) of rs7146599 in heterozygous reads. The pileup shows the total of paired-end reads (read 1 and read 2) intersecting the cQTL, pooled across three heterozygous individuals. C 4C-seq validation of rs7146599-PCK2 allelic looping in three heterozygous individuals. The 4C-seq viewpoint is shown by the dashed line at rs7146599, and the rlog normalised 4C-seq reads (mean across three individuals) are shown for the reference allele (G, blue) or the alternative allele (A, red). Larger dots indicate significantly different interactions between alleles (4Cker statistical test p value < 0.05 after adjusting for multiple comparisons). D eQTL effects of rs7146599 on PCK2 across multiple cohorts. Betas with respect to the alternative allele (A) are shown in studies of monocytes (the monocyte multi-cohort analysis used to design the eQTL CHi-C experiment, Momozawa et al. and Blueprint) and whole blood (Lepik et al., Jansen et al. and GTEx). E Effect of genotype on contact profiles in the locus. Individuals were split into monozygous reference (G allele, N = 11) or alternative (A allele, N = 9) genotypes and merged in CHiCAGO to produce an average number of counts in bins of 5 kb. Contact profiles are shown from the viewpoint of the PCK2 promoter, with the location of the promoter and the contact QTL highlighted with grey rectangles. The monocyte CTCF peaks shown in this figure were generated using the ChIP-seq data shown in (B). ATAC-signal is shown as −log10(p value) pileups determined by Genrich. F Proposed mechanism schematic showing how perturbed CTCF binding at rs7146599 could affect the insulation of the PCK2 promoters from distal enhancers, denoted as E1, E2 and E3. Created in BioRender: https://BioRender.com/c07a901. Source data for BE are available on OSF.

Similar articles

References

    1. Maurano, M. T. et al. Systematic localization of common disease-associated variation in regulatory DNA. Science337, 1190–1195 (2012). - PMC - PubMed
    1. Claringbould, A. & Zaugg, J. B. Enhancers in disease: molecular basis and emerging treatment strategies. Trends Mol. Med.27, 1060–1073 (2021). - PubMed
    1. GTEx Consortium. The GTEx Consortium atlas of genetic regulatory effects across human tissues. Science369, 1318–1330 (2020). - PMC - PubMed
    1. Tewhey, R. et al. Direct identification of hundreds of expression-modulating variants using a multiplexed reporter assay. Cell165, 1519–1529 (2016). - PMC - PubMed
    1. Javierre, B. M. et al. Lineage-specific genome architecture links enhancers and non-coding disease variants to target gene promoters. Cell167, 1369–1384.e19 (2016). - PMC - PubMed

LinkOut - more resources