. 2025 Jan 28;11(1):1.
doi: 10.1038/s41421-024-00747-z.

Stromal architecture and fibroblast subpopulations with opposing effects on outcomes in hepatocellular carcinoma

Affiliations

Stromal architecture and fibroblast subpopulations with opposing effects on outcomes in hepatocellular carcinoma

Yifei Cheng et al. Cell Discov. .

Abstract

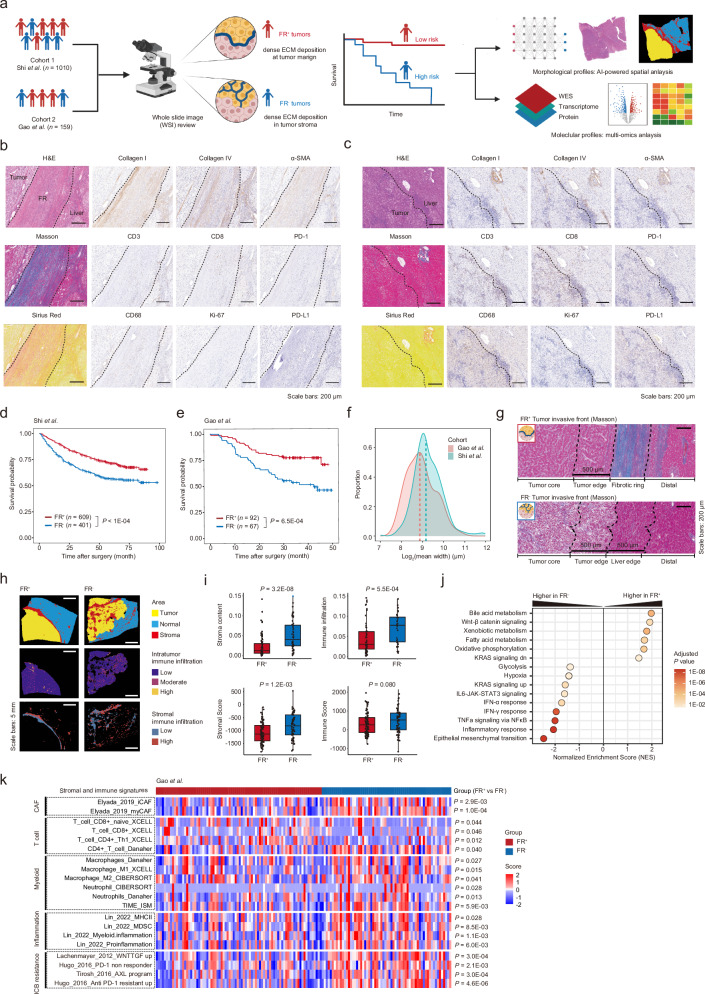
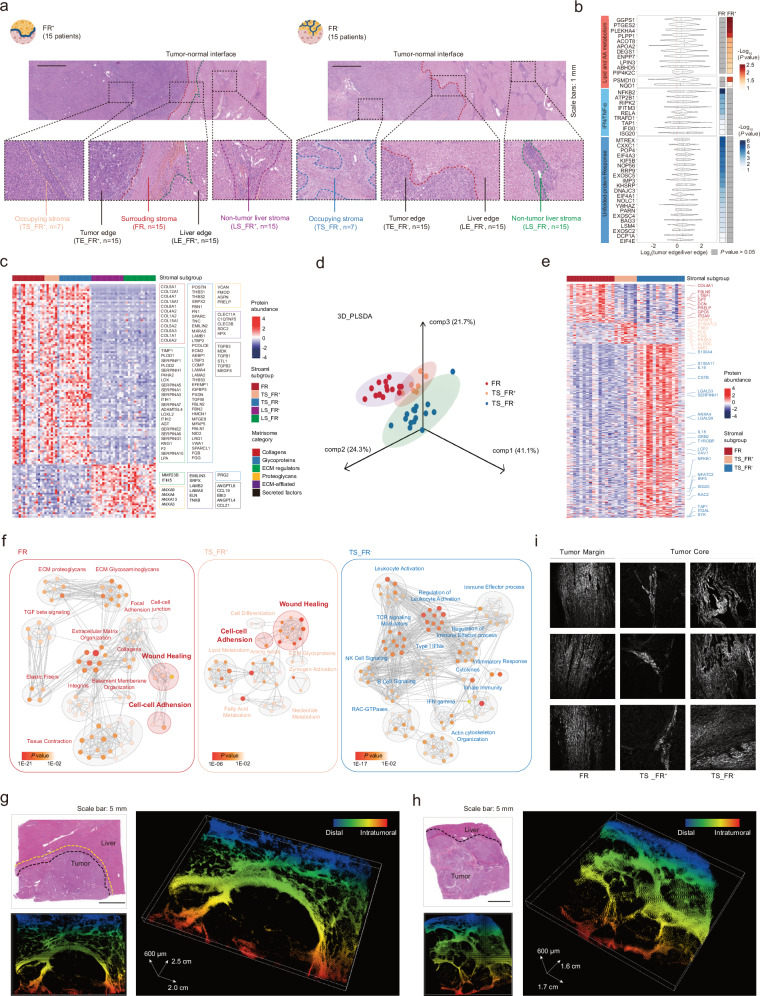
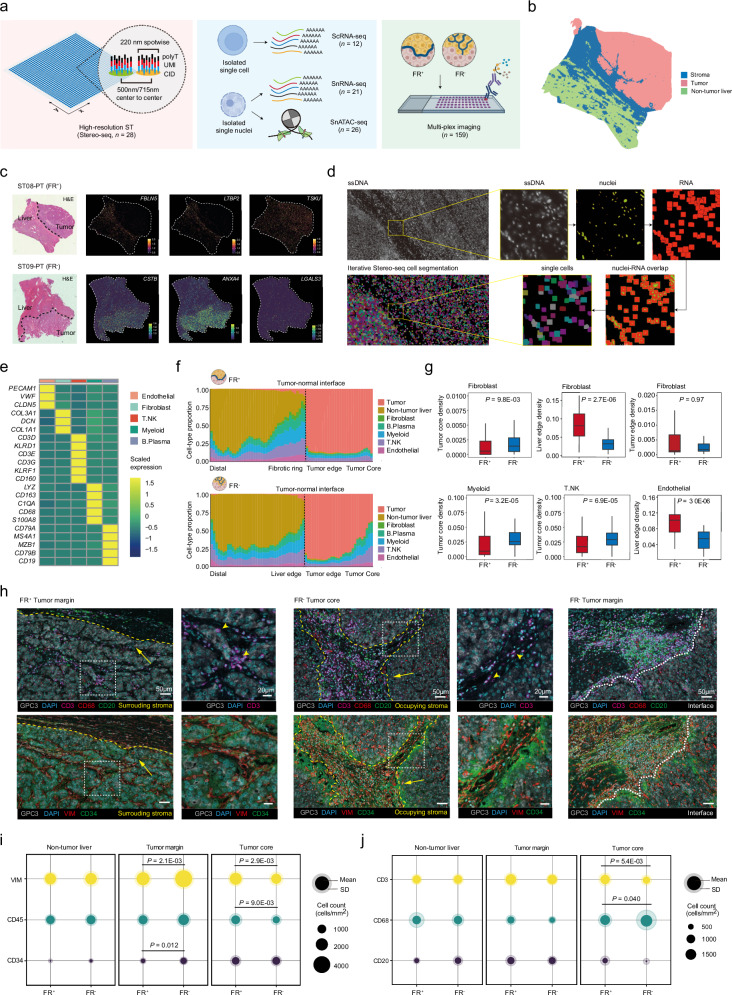
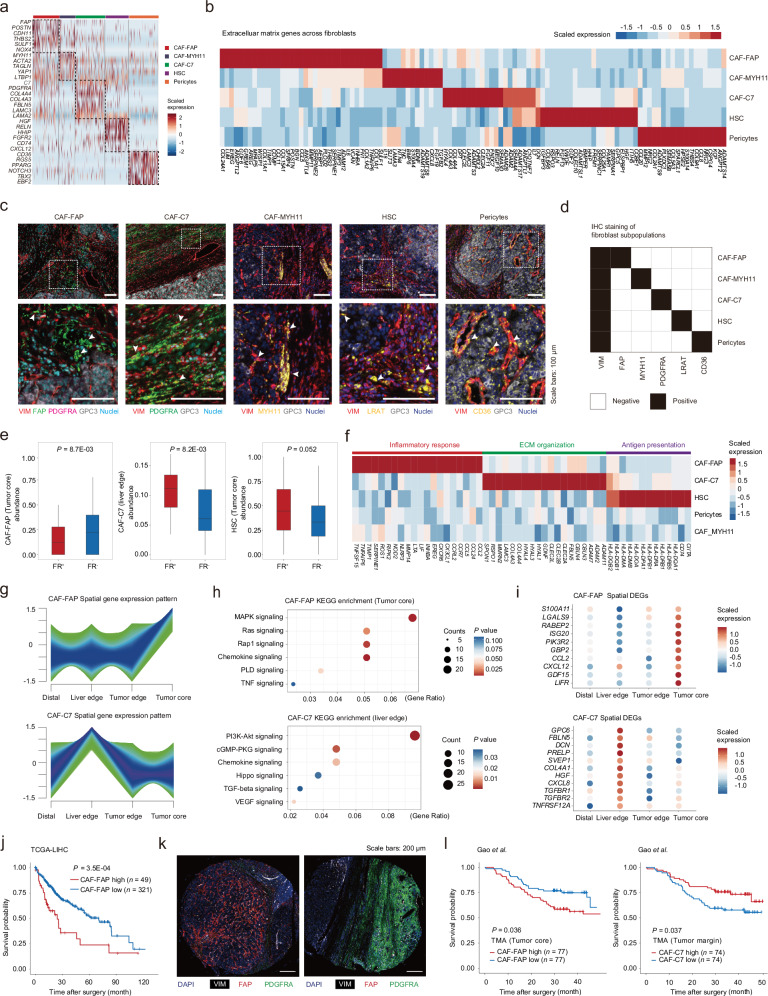
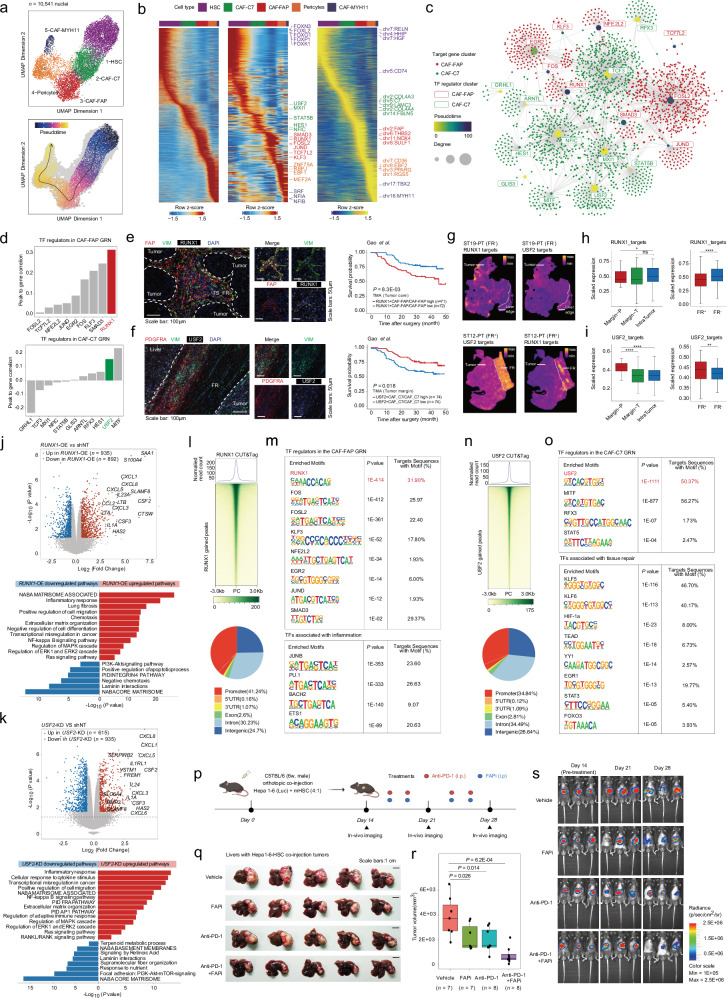
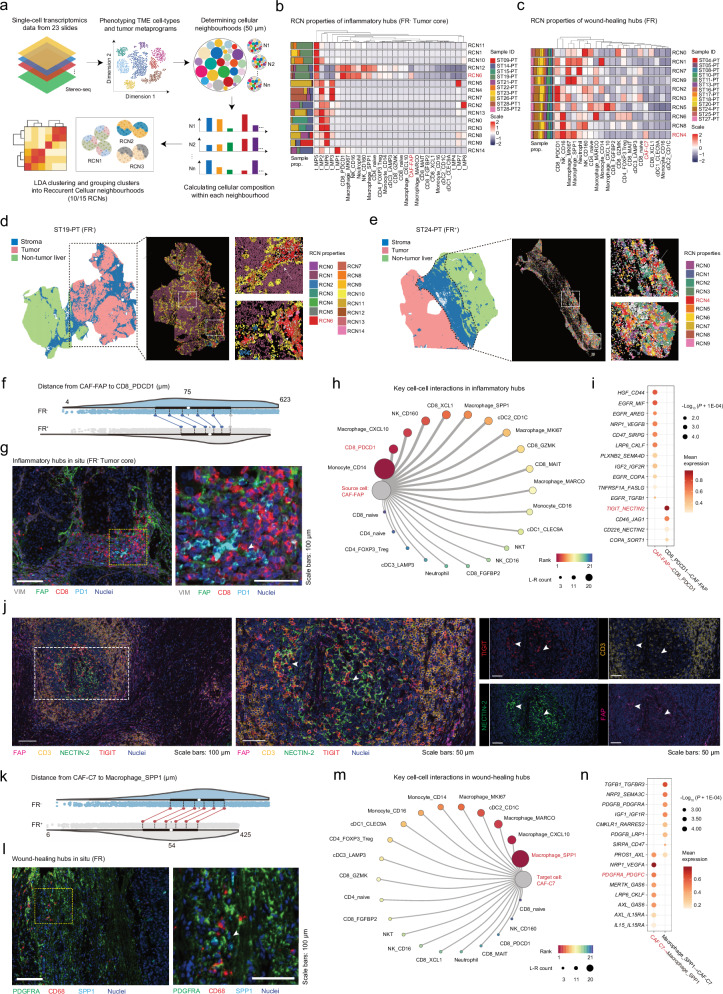
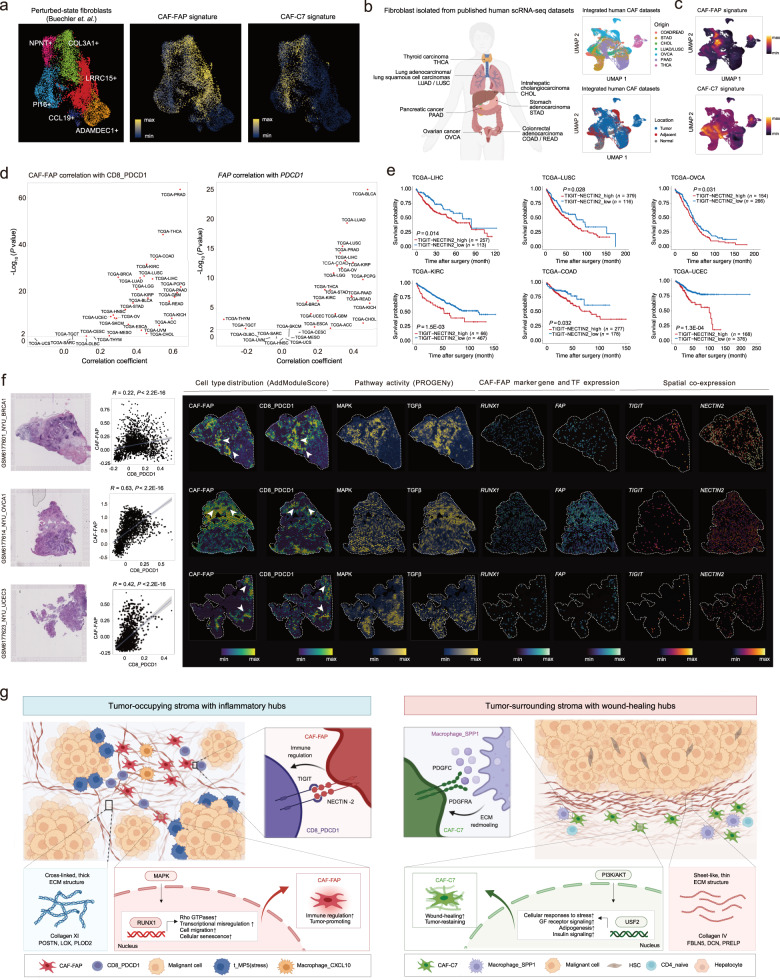
Dissecting the spatial heterogeneity of cancer-associated fibroblasts (CAFs) is vital for understanding tumor biology and therapeutic design. By combining pathological image analysis with spatial proteomics, we revealed two stromal archetypes in hepatocellular carcinoma (HCC) with different biological functions and extracellular matrix compositions. Using paired single-cell RNA and epigenomic sequencing with Stereo-seq, we revealed two fibroblast subsets CAF-FAP and CAF-C7, whose spatial enrichment strongly correlated with the two stromal archetypes and opposing patient prognosis. We discovered two functional units, one is the intratumor inflammatory hub featured by CAF-FAP plus CD8_PDCD1 proximity and the other is the marginal wound-healing hub with CAF-C7 plus Macrophage_SPP1 co-localization. Inhibiting CAF-FAP combined with anti-PD-1 in orthotopic HCC models led to improved tumor regression than either monotherapy. Collectively, our findings suggest stroma-targeted strategies for HCC based on defined stromal archetypes, raising the concept that CAFs change their transcriptional program and intercellular crosstalk according to the spatial context.


Conflict of interest statement

Conflict of interest: The authors declare no competing interests.

Figures

Fig. 1
Fig. 1. Stromal architecture in HCC and its clinical and multiomic correlations.
a Schematic diagram of stromal architecture identification, public cohorts, and analytical approaches. b, c Representative H&E, Masson, Sirius Red, and IHC staining showing collagen fibers (Collagen I, Collagen IV), fibroblast activation (a-SMA), immune infiltration (CD3, CD8, CD68), tumor proliferation (Ki-67), and checkpoint molecules (PD-1, PD-L1) at the tumor margin of FR+ tumors (b) and FR tumors (c). Scale bars: 200 μm. d, e Kaplan-Meier curves for overall survival in cohort 1 (d) and cohort 2 (e) based on stromal architecture. Log-rank test. f The distribution of tumor-surrounding stroma width in cohort 1 and cohort 2. g Representative images of FR+ tumors (upper) and FR tumors (bottom) at the invasive front by Masson trichrome staining, illustrating the definition of 4 spatial zones. h Visualization of tissue type (upper), intratumor immune infiltration (middle), and stromal immune infiltration (lower) in representative WSIs of FR+ (left) and FR (right) tumors predicted by deep learning models. i Boxplots comparing the distribution of intratumor stromal content (left) and intratumor immune infiltration (right) predicted by deep learning and RNA-seq in FR+ and FR tumors. Wilcoxon test. j GSEA of the HALLMARK genesets showing ontologies enriched in FR+ and FR tumors, respectively. A normalized enrichment score is given for each ontology; points are colored by the adjusted P value. k Comparison of stromal and immune signatures between FR+ and FR HCC tumor tissue from cohort 2. Wilcoxon test.
Fig. 2
Fig. 2. Spatial proteomics profiling of two stromal archetypes in HCC.
a Schematic diagram of morphology-guided LCM of tumor margin samples of HCC (FR+, n = 15; FR, n = 15) at TS, FR, LS, TE and LE, followed by proteomic analysis (n = 127). Scale bars: 1 mm. TS tumor-occupying stroma, FR fibrotic ring, LS non-tumor liver stroma, TE tumor edge, LE liver edge. b Violin plot showing the abundance of proteins related to lipid and amino acid metabolism, inflammation, and stress response in TE compared with LE. Heatmap displays the P values of comparisons between TE and LE. Wilcoxon test. c Heatmap of the differentially expressed proteins in the cancer-associated stroma (FR, TS_FR+, TS_FR) or non-tumor liver stroma (LS_FR+, LS_FR) (P < 0.05). Paired t-test. ECM-related proteins were shown and classified by their ECM category. d Partial Least Squares Discriminant Analysis (PLS-DA) of FR, TS_FR+, TS_FR. e Heatmap of the differentially expressed proteins among cancer-associated stroma (FR, TS_FR+, TS_FR). f Network of the genesets upregulated in FR, TS_FR+, and TS_FR, respectively. g, h H&E (top left) and 3D reconstruction of the stromal architecture in FR+ (g) and FR (h) HCC. Scale bars: 5 mm. i Representative SHG images from FR (left), TS_FR+ (middle), and TS_FR (right), respectively.
Fig. 3
Fig. 3. Deciphering HCC spatial stromal heterogeneity at single-cell level.
a Schematic overview of the spatial multi-OMIC workflow, including Stereo-seq, scRNA-seq, snRNA-seq, snATAC-seq, and multi-plex imaging. b Spatial mapping of the 3 major regions based on spatial confined clustering. c Paired H&E images and spatial visualization of representative stromal gene expression of FR, TS_FR+, and TS_FR. d Illustration of the single-cell segmentation workflow. Nuclei were measured by ssDNA staining, and cell boundaries were determined by captured RNA signals. e Heatmap showing the marker gene expression of the 5 major clusters by single-cell ST. f Stacked plot showing the distribution of all major cell types by layer along the tumor-margin-liver axis in FR+ tumors (upper) and FR tumors (lower). g Boxplot comparing the spatial enrichment of 4 major clusters in defined spatial zones. Wilcoxon test. h Representative multi-plex immunostaining images of fibroblast (VIM+), T cell (CD3+), macrophage (CD68+), B cell (CD20+), and endothelial (CD34+) marker expression at the invasive boundary of FR+ tumors (left) and FR tumors (right). i, j Comparisons of major TME cell distribution between FR+ tumors and FR tumors across different spatial regions. Circle plots represent the mean and standard deviation (SD) of the cell densities (cells/mm2) in TMAs of paired non-tumor, tumor margin, and tumor core from cohort 2 (n = 159; FR+, n = 92; FR, n = 67). The statistics of fibroblasts (VIM+), endothelial cells (CD34+), and immune cells (CD45+) were included in (i), while T cells (CD3+), macrophages (CD68+), and B cells (CD20+) were displayed in (j). Wilcoxon test.
Fig. 4
Fig. 4. Distinct CAF subpopulations associated with stromal archetypes.
a Heatmap showing the expression profiles of fibroblast subsets by snRNA-seq. b Average gene expression of highly variable ECM genes in fibroblast subclusters by snRNA-seq. c Representative images of multi-plex imaging for fibroblast subtyping markers identified by snRNA-seq. Arrows highlight cells of interest. Scale bars: 100 μm. d Presentation of the 5 subtyping markers on the identified fibroblast clusters. e Boxplot comparing the spatial enrichment of fibroblast subsets in defined spatial zones (FR/liver edge and tumor core) in FR+ tumors vs FR tumors. Student’s t-test. f Average gene expression of featured functional genes (related to inflammatory response, ECM organization, antigen presentation) in each fibroblast subset by snRNA-seq. g The gene expression patterns along the tumor-margin-liver axis of CAF-FAP (upper) and CAF-C7 (lower) by Stereo-seq. h KEGG enrichment of spatial DEGs present in the pattern of CAF-FAP (upper) and CAF-C7 (lower). i Dot plot showing the expression of the representative genes involved in chemokine signaling in CAF-FAP (upper) and CAF-C7 (lower), which were also detected by spatial proteomics. j Kaplan-Meier curves for overall survival in TCGA-LIHC cohort (n = 370) based on CAF-FAP signature. Log-rank test. k Representative multi-plex images of CAF-FAP (VIM+FAP+) at tumor core (FR) and CAF-C7 (VIM+PDGFRA+) at tumor margin (FR+). Scale bars: 200 μm. l Survival analysis based on immunostaining scores of CAF-FAP at tumor core (left, n = 154) and CAF-C7 at tumor margin (n = 148, right). Log-rank test.
Fig. 5
Fig. 5. Gene regulatory networks of distinct CAF subpopulations in HCC.
a UMAP representations and pseudotime trajectories of fibroblast subsets by integrated snRNA-seq and snATAC-seq. b Changes in highly variable peaks (left), transcription factor (TF) motif binding activities (middle), and gene expression score (right) along the pseudotime trajectories of fibroblast subsets. Marker TFs and marker genes were shown and colored by cluster. c GRN of CAF-FAP and CAF-C7. Each node represents a TF (regulator) or a gene (target). TFs were colored according to the pseudotime value and target genes were colored by their corresponding fibroblast subcluster. d Bar plot showing the mean peak-to-target-gene correlation (FDR < 1 × 103, VarQATAC > 0.25, VarQRNA > 0.25) of TF regulators in the CAF-FAP GRN (upper) and CAF-C7 GRN (lower). e Representative images of multi-plex imaging for CAF-FAP subset and identified TF RUNX1 and survival analysis based on immunostaining scores of RUNX1+CAF-FAP/CAF-FAP in cohort 2 (Tumor core, n = 143). Log-rank test. Scale bars: 100 μm and 50 μm. f Representative images of multi-plex imaging for CAF-C7 subset and identified TF USF2 and survival analysis based on immunostaining scores of USF2+CAF-C7/CAF-C7 in cohort 2 (Tumor margin, n = 148). Log-rank test. Scale bars: 100 μm and 50 μm. g Spatial visualization of RUNX1 and USF2 target gene expression density in representative FR+ and FR samples. h Comparison of target gene expression density of RUNX1 among different spatial zones of representative samples and between FR+ and FR groups (FR+, n = 18; FR, n = 10). Wilcoxon test (ns: P > 0.05; *P < 0.05; **P < 0.01; ***P < 1E‒03; ****P < 1E‒04). i Comparison of target gene expression density of USF2 among different spatial zones of representative samples and between FR+ and FR groups (FR+, n = 18; FR, n = 10). Wilcoxon test (ns: P > 0.05; *P < 0.05; **P < 0.01; ***P < 1E‒03; ****P < 1E‒04). j Volcano plots (upper) and enrichment (lower) of DEGs in human hepatic satellite cells (LX-2) with or without RUNX1 overexpression (RUNX1-OE) at RNA level. Scale bars: 5 mm. k Volcano plots (upper) and enrichment (lower) of DEGs in human hepatic satellite cells (LX-2) with or without USF2 knockdown (USF2-KD) at RNA level. l Heatmap of the RUNX1 CUT&Tag-seq profiles of LX-2 cells (upper), pie plot showing genomic distribution of binding sites (lower). m Tables illustrating the RUNX1 CUT&Tag motif enrichment analysis. n Heatmap of the USF2 CUT&Tag-seq profiles of LX-2 cells (upper), pie plot showing genomic distribution of binding sites (lower). o Tables illustrating the USF2 CUT&Tag motif enrichment analysis. p Schematic diagram of orthotopic Hepa1-6-mHSC co-injection model and drug interventions. q Representative images of harvested livers from orthotopic HCC models receiving different treatments. Scale bars: 1 cm. r Boxplots showing the tumor volume by different regimens (vehicle, n = 7; FAPi, n = 7; Anti-PD-1, n = 8; Anti-PD-1+FAPi, n = 8). Wilcoxon test. s Representative images of in-vivo imaging from orthotopic HCC models receiving different treatments.
Fig. 6
Fig. 6. Coordinated CAF-immune interactions in HCC stroma.
a Schematic of the RCN analysis. Annotated single-cell data from TME cell types and tumor metaprograms (t_MPs) were added to 23 Stereo-seq slides. The latent Dirichlet allocation (LDA) model was trained with a 50 μm proximity radius and subsequently grouped by K-means clustering into 10 or 15 RCNs based on cellular composition and the frequency of occurrence. b, c RCN properties of inflammatory hubs at the tumor core of FR tumors (b) and wound-healing hubs at the FR of FR+ tumors (c). Heatmap shows the abundance of cell types with each RCN and bar plots to the left of the heatmap represent the distribution of patients with each cluster. d, e Spatial visualization with regional magnification of the tumor core of FR tumors (d) and the FR of FR+ tumors (e). Cells were colored based on their RCN class. Arrows mark the examples of inflammatory hubs (d) and wound-healing hubs (e). f Shift plots showing the distance between CAF-FAP and CD8_PDCD1 in the tumor core (n = 23; FR+, n = 13; FR, n = 10). Significance is calculated for percentiles of 30, 40, 50, 60, 70 by the Robust Harrell-Davis quantile estimator. The blue line represents a significant difference between FR+ and FR tumors (P < 0.05, lower in FR tumors), and the grey line represents non-significance for the percentile. g Representative images highlighting the co-localization of CAF-FAP (FAP+VIM+) and CD8_PDCD1 (CD8+PDCD1+) at tumor-occupying stroma. Arrows mark the examples of co-localization pairs. Scale bars: 100 μm. h Circus plot showing CD8_PDCD1 ranked second by counts of ligand‒receptor pairs among all presumable target cells of CAF-FAP in the tumor core. i Dot plot showing significant ligand‒receptor interactions between CAF-FAP and CD8_PDCD1 in the tumor core. The point size represents the log-normalized P value, while the filled color indicates the mean expression of the ligand‒receptor pairs. j Representative images showing the intercellular crosstalk between CD8_PDCD1 and CAF-FAP through the ligand‒receptor of NECTIN2‒TIGIT. Scale bars: 100 μm or 50 μm. k Shift plots showing the distance between CAF-C7 and Macrophage_SPP1 in the liver edge (n = 23, FR+, n = 13; FR, n = 10). Significance is calculated for percentiles of 30, 40, 50, 60, 70 by Robust Harrell-Davis quantile estimator. The red line represents a significant difference between FR+ and FR tumors (P < 0.05, lower in FR+ tumors), and the grey line represents non-significance for the percentile. l Representative images highlighting the co-localization of CAF-C7 (PDGFRA+) and Macrophage_SPP1 (CD68+SPP1+) at tumor-surrounding stroma. Arrows mark the examples of co-localization pairs. Scale bars: 100 μm. m Circus plot showing Macrophage_SPP1 ranked first by counts of secreted ligand‒receptor pairs among all presumable target cells of CAF-C7 at the tumor margin. n Dot plot showing the ligand‒receptor pairs significantly upregulated between CAF-C7 and Macrophage_SPP1 at the tumor margin. The point size represents the log-normalized P value, while the filled color indicates the mean expression of the ligand‒receptor pairs.
Fig. 7
Fig. 7. Validation of stromal inflammatory hubs Across various cancer types.
a UMAPs showing tissue origin of fibroblasts from human perturbed-state fibroblasts atlas (left) and their expression of CAF-FAP (middle) and CAF-C7 (right) signature. b Schematic diagram of integrating scRNA-seq data of human fibroblasts collected from different cancer types and locations. c Estimated CAF-FAP (upper) and CAF-C7 (lower) abundance in pan-cancer fibroblasts, showing the expression of subcluster signature among cancer types. d Pearson correlation between CAF-FAP and CD8_PDCD1 abundance and between FAP and PDCD1 gene expression of TCGA data across 32 solid tumor types. Cell abundance was quantified by mean expression of the top 50 DEGs. Pearson correlation. e Kaplan-Meier plot showing the overall survival across 6 cancer types from TCGA based on the mean expression of TIGIT and NECTIN2. Log-rank test. f Characterization of the inflammatory hubs in published ST data of human breast, ovarian, and endometrial cancer, showing paired histology, spatial distribution, and correlation of CAF-FAP and CD8_PDCD1, pathway activity, marker gene expression, and ligand‒receptor pairs. Pearson correlation. g Schematic diagram of the two major stromal archetypes (FR+ and FR) in HCC, displaying broad differences between FR+ and FR tumors regarding fibroblast heterogeneity, multicellular interactome, and ECM properties.

Similar articles

Cited by

References

    1. Sung, H. et al. Global cancer statistics 2020: GLOBOCAN estimates of incidence and mortality worldwide for 36 cancers in 185 countries. CA Cancer J. Clin.71, 209–249 (2021). - PubMed
    1. Llovet, J. M. et al. Hepatocellular carcinoma. Nat. Rev. Dis. Prim.7, 6 (2021). - PubMed
    1. Haber, P. K. et al. Molecular markers of response to anti-PD1 therapy in advanced hepatocellular carcinoma. Gastroenterology164, 72–88.e18 (2023). - PubMed
    1. Baglieri, J., Brenner, D. A. & Kisseleva, T. The role of fibrosis and liver-associated fibroblasts in the pathogenesis of hepatocellular carcinoma. Int. J. Mol. Sci. 20, 1723 (2019). - PMC - PubMed
    1. Kisseleva, T. & Brenner, D. Molecular and cellular mechanisms of liver fibrosis and its regression. Nat. Rev. Gastroenterol. Hepatol.18, 151–166 (2021). - PubMed

Grants and funding

LinkOut - more resources