. 2025 Jan 27;16(1):997.
doi: 10.1038/s41467-025-55958-z.

Phosphorylation-dependent WRN-RPA interaction promotes recovery of stalled forks at secondary DNA structure

Affiliations

Phosphorylation-dependent WRN-RPA interaction promotes recovery of stalled forks at secondary DNA structure

Alessandro Noto et al. Nat Commun. .

Abstract

The WRN protein is vital for managing perturbed replication forks. Replication Protein A strongly enhances WRN helicase activity in specific in vitro assays. However, the in vivo significance of RPA binding to WRN has largely remained unexplored. We identify several conserved phosphorylation sites in the acidic domain of WRN targeted by Casein Kinase 2. These phosphorylation sites are crucial for WRN-RPA interaction. Using an unphosphorylable WRN mutant, which lacks the ability to bind RPA, we determine that the WRN-RPA complex plays a critical role in fork recovery after replication stress countering the persistence of G4 structures after fork stalling. However, the interaction between WRN and RPA is not necessary for the processing of replication forks when they collapse. The absence of WRN-RPA binding hampers fork recovery, causing single-strand DNA gaps, enlarged by MRE11, and triggering MUS81-dependent double-strand breaks, which require repair by RAD51 to prevent excessive DNA damage.


Conflict of interest statement

Competing interests: The authors declare no competing interests.

Figures
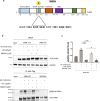
Fig. 1
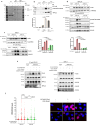
Fig. 1. The acidic domain of WRN is phosphorylated by CK2.
a Schematic representation of WRN protein showing its domains. Mutation of six putative CK2 phosphorylation sites in the WRN acidic domain are highlighted. b Anti-Flag-immunoprecipitation from HEK293T cells transiently transfected with Flag-WRN-WT or Flag-WRN-6A plasmid. Cells were treated as indicated 48 h after transfection. Cell extracts were subjected to immunoprecipitation with anti-Flag beads. Immunocomplexes were analysed by Western blotting using the indicated antibodies. c Quantification of phosphorylation of WRN at S440-467 sites and the effects of CK2 or DNA-PK inhibition. Data are presented as mean ±S.E. from two independent replicates. Source data are provided as a Source Data file.
Fig. 2
Fig. 2. Phosphorylation of the acidic domain of WRN by CK2 drives association with RPA.
a Ponceau staining of GST pull-downs performed with nuclear extracts from HEK293T cells and GST-tagged WRN fragment 403-503 (WRNwt and WRN6D). The WRN fragments from “a” were phosphorylated by CK2 in the presence or absence of ATP. Western blotting analysis in b shows WRN S440/467 phosphorylation and the RPA32 subunit from GST pull-downs. The graph shows the levels of S440/467 phosphorylation and RPA32 bound to GST-tagged WRN fragments. Data are presented as mean from two independent replicates. c Anti-Flag-immunoprecipitation from HEK293T cells transfected with Flag-WRN-WT or Flag-WRN-6A plasmid. Cells were treated as indicated 48 h after transfection. Cell extracts were subjected to immunoprecipitation with anti-Flag beads. Immunocomplexes were analysed by Western blotting using the indicated antibodies. The graph presents the quantification of the WRN-normalised amount of RPA70 in the anti-Flag immunoprecipitate from two independent experiments (mean of each is shown). d Anti-RPA70 immunoprecipitation from HEK293T cells transfected with Flag-WRN-WT or Flag-WRN-6A plasmid. Cells were treated as indicated 48 h after transfection. Immunoprecipitation was performed using anti-RPA70-conjugated beads and immunocomplexes analysed by Western blotting using the indicated antibodies. The graph shows the quantification of the RPA70-normalised amount of WRN in the anti-RPA70 immunoprecipitate from two independent experiments (mean of each is shown). e Anti-RPA32 immunoprecipitation from HEK293T cells transfected with Flag-WRN-WT plasmid. Cells were treated as indicated 48 h after transfection. Immunocomplexes were analysed by Western blotting using the indicated antibodies (the gel is representative of one of the two independent repeats). f Interaction between WRN and RPA32 in Werner Syndrome (WS) cells expressing Flag-WRNwt or Flag-WRN6A and treated as indicated. In situ PLA was performed with anti-Flag and anti-RPA32 antibodies. The graph shows individual PLA spot values from each condition (from 166 to 280 nuclei). Representative images are provided. Bars represent mean ± S.E. (n = 3; two-tailed Mann-Whitney test). Scale bar = 20 µm. Source data are provided as a Source Data file.
Fig. 3
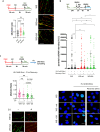
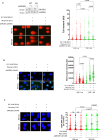
Fig. 3. RPA-binding is required for WRN to restart replication fork and recover from replication arrest.
a Analysis of replication fork restart using DNA fibre assay. WS cells or WS cells expressing Flag-WRNwt or Flag-WRN6A plasmid were treated 48 h thereafter as indicated in the experimental scheme. The graph displays individual IdU/CdU ratios from 100 DNA fibres after duplicated experiments. Bars represent mean ± S.E. (ns = not significant; ****P < 0.0001; Two-tailed Mann-Whitney test for paired samples). Representative images of DNA fibres from a random field are provided. Scale bar 10 µm. b Analysis of parental ssDNA exposure in WS cells or WS cells expressing Flag-WRNwt or Flag-WRN6A plasmid. Cells were treated as indicated in the experimental scheme. The graph shows the quantification of total IdU intensity per nucleus from three independent experiments. Bars represent mean ± S.E. (ns = not significant; *P < 0.05; ***P < 0.001; ****P < 0.0001; Two-tailed Mann-Whitney test for paired samples). Representative images of native anti-IdU immunofluorescence are provided. Scale bar = 20 µm. c Analysis of replication fork recovery using DNA fibre assay in WS cells expressing Flag-WRNwt or Flag-WRN6A and treated as indicated in the experimental scheme. The graph displays individual IdU/CdU ratio values from two independent replicates (at least 25 fibres each). Bars represent mean ± S.E. (Two-tailed Mann-Whitney test for paired samples). Representative images of DNA fibres from a random field are provided. Scale bar 10 µm. Source data are provided as a Source Data file.
Fig. 4
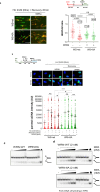
Fig. 4. RPA-binding collaborates with WRN helicase activity to promote replication recovery.
a Analysis of replication fork recovery using DNA fibre assay in WS cells expressing Flag-WRNwt or Flag-WRN6A and treated as indicated in the experimental scheme. The graph displays individual IdU/CdU ratio values from two independent replicates (50 DNA fibres each experiment). Bars represent mean ± S.E. The numbers in the inset boxes above each dot plot indicate the percentage of restarting forks (mean ± S.E). (Two-tailed Mann-Whitney test for paired samples). Representative images of DNA fibres from a random field are provided. Scale bar 10 µm. b Analysis of parental ssDNA exposure in WS cells expressing Flag-WRNwt or Flag-WRN6A and treated as indicated in the experimental scheme. The graph quantifies total IdU intensity per nucleus from three independent experiments (at least 40 nuclei/repeat). Data points from inhibited cells have a black border. Bars represent mean ± S.E. (ns = not significant; * P < 0.05; *** P < 0.001; Two-tailed Mann-Whitney test for paired samples). Representative images of native anti-IdU immunofluorescence are shown. Scale bar = 20 µm. c Helicase reactions containing radiolabeled TelXY forked duplex substrate (0.5 nM) and increasing concentration of WRN-WT and WRN-6A proteins (0.5, 1, 2, 4, 8 and 16 nM). d Evaluation of helicase activity of WRN-WT (2 nM) and WRN-6A (2 nM) with increasing amount of RPA (1, 2, 4, 8, 16 nM). NE indicates no enzyme control. Black triangles indicate heat denatured substrate. The autoradiographs shown in (c and d) are representative of two experiments. Source data are provided as a Source Data file.
Fig. 5
Fig. 5. Disruption of the WRN-RPA complex leads to persistence of G4s in the cell.
a Analysis of G4 structures by immunofluorescence and an anti-DNA G-quadruplex antibody (clone BG4) in WS cells or WS cells expressing Flag-WRNwt or Flag-WRN6A plasmid. Cells were treated as indicated. The graph quantifies total BG4 nuclear staining per nucleus from two independent experiments (at least 80 nuclei/repeat). Data points from inhibited cells have a black border. Bars represent mean ± S.E. (ns = not significant; *P < 0.05; **P < 0.01: Two-tailed Mann-Whitney test for paired samples). Representative images are provided. Scale bar = 20 µm. b SIRF analysis of the localisation of BG4 at EdU-labelled nascent DNA by in situ PLA in WS cells expressing Flag-WRNwt or Flag-WRN6A. To mark nascent DNA at stalled forks, cells were treated with EdU 8 min before being treated with HU. The graph quantifies total BG4 SIRF spots per nucleus from two independent experiments (at least 80 nuclei/repeat). Bars represent mean ± S.E. (ns = not significant; ****P < 0.0001; Kruskal-Wallis with Dunn’s test). Representative images are provided. Scale bar = 20 µm. c Analysis of G4 structures detection as in a) in WS cells expressing Flag-WRNwt or Flag-WRN6A. Cells were treated as indicated and recovered with or without WRN inhibitor (WRNi). The graph shows quantification of total BG4 nuclear staining per nucleus from two independent experiments (at least 80 nuclei/repeat). Data points from inhibited cells have a black border. Bars represent mean ± S.E. (ns = not significant; **P < 0.01; ****P < 0.0001; Two-tailed Mann-Whitney test for paired samples). Representative images are provided. Scale bar = 20 µm. Source data are provided as a Source Data file.
Fig. 6
Fig. 6. WRN-WT and WRN-6A unwinding of TP-G4 DNA substrate.
a Helicase reactions containing radiolabeled tetramolecular parallel TP-G4 substrate (0.25 nM) and increasing concentration of WRN-WT and WRN-6A proteins (0.5, 1, 2, 4, 8 and 16 nM). b Evaluation of helicase activity of WRN-WT (2 nM) and WRN-6A (2 nM) with increasing amount of RPA (1, 2, 4, 8, 16 nM). NE indicates no enzyme control. M: marker of single-stranded TP-G4 oligonucleotide. Autoradiographs are representative of two independent replicates. Source data are provided as a Source Data File.
Fig. 7
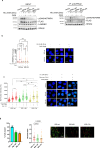
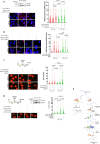
Fig. 7. Phosphorylation of S440 and S467 is sufficient to promote WRN-RPA complex, fork recovery and clearance of G4s at arrested forks.
a Anti-Flag-immunoprecipitation from HEK293T cells transfected with Flag-WRNwt, Flag-WRN6A or Flag-WRN2A plasmid. Cells were treated as indicated 48 h after transfection and exposed or not to a CK2i. Cell extracts were subjected to immunoprecipitation with anti-RPA32 beads. Immunocomplexes were analysed by Western blotting using the indicated antibodies. b In situ PLA between WRN and RPA32 in WS cells nucleofected with Flag-WRNwt, Flag-WRN2A or Flag-WRN6A expression plasmid. Cells were treated as indicated. The graph shows individual values of PLA spots from two different experiments (at least 100 nuclei/repeat). Bars represent mean ± S.E. (ns = not significant; **P < 0.01; ****P < 0.0001; Kruskal-Wallis test for non-paired samples with Dunn’s correction). Representative images are provided. Scale bar = 20 µm. c G4s accumulation was detected by anti-BG4 immunofluorescence in cells expressing Flag-WRNwt Flag-WRN6A or Flag-WRN2A plasmid. Cells were treated as indicated and recovered for 1 h in the presence or absence of the CK2 inhibitor. The graph displays individual values of BG4 foci nuclear intensity from three independent experiments. At least 50 nuclei/experiment were reported in the plot. Bars represent mean ± S.E. (ns = not significant; ****P < 0.0001. Where not indicated, values are not significant; Kruskal-Wallis test for non-paired samples with Dunn’s correction). Representative images are provided. Scale bar = 20 µm. d Analysis of replication fork recovery using DNA fibre assay in WS cells expressing Flag-WRNwt Flag-WRN6A or Flag-WRN2A plasmid treated 48 h thereafter as indicated. The left graph displays the percentage of restarting forks. Bars represent mean ± S.E. The numbers in the boxes above each dot plot indicate the percentage of restarting forks. The right graph shows individual IdU/CdU ratio values (n = 54) from two independent replicates. Bars represent mean ± S.E (Two-tailed Mann-Whitney test for paired samples). The total number of forks analysed is reported above each plot. Representative images of DNA fibres from a random field are provided. Scale bar 20 µm. Source data are provided as a Source Data file.
Fig. 8
Fig. 8. MRE11-dependent gaps and MUS81-dependent DSBs contribute to G4 clearance in cells defective for RPA-binding to WRN.
a Analysis of DSBs using neutral Comet assay in WS cells expressing Flag-WRNwt or Flag-WRN6A. Cells were transfected with control (CTRL) or MUS81 siRNA, 48 h thereafter were treated as indicated and then allowed to recover for 1 h. Western blotting confirms MUS81 downregulation. The graph shows individual tail moment values of at least 120 cells from duplicated experiments (n = 3). Bars represent mean ± S.E. Statistical analyses were performed by two-tailed Mann-Whitney test, where not indicated, values are not significant. Representative images are provided. b Analysis of G4 accumulation evaluated by anti-BG4 immunofluorescence. The graph displays individual values of BG4 nuclear intensity of at least 160 cells from different experiments. Bars represent mean ± S.E. (Two-tailed Mann-Whitney test; Where not indicated, values are not significant). Representative images are provided. Scale bar = 20 µm. c SIRF analysis of the localisation of BG4 at EdU-labelled nascent DNA by in situ PLA in WS cells expressing Flag-WRNwt or Flag-WRN6A after transfection with MUS81 siRNAs. The graph quantifies total BG4 SIRF spots per nucleus of at least 180 cells from two independent experiments. Bars represent mean ± S.E. (Two-tailed Mann-Whitney test for paired samples). Representative images are provided. Scale bar = 20 µm. Source data are provided as a Source Data file.
Fig. 9
Fig. 9. RAD51 repairs DSBs formed at G4s in the absence of WRN-RPA binding.
a In situ PLA between RAD51 and parental ssDNA in WS cells expressing Flag-WRNwt or WRN6A. Cells were transfected with control (CTRL) or siMUS81 siRNA and treated 48 h thereafter. The graph shows individual values of PLA spots of at least 100 cells from two independent experiments. Bars represent mean ± S.E. (Two-tailed Mann-Whitney test for paired samples. Where not indicated, values are not significant). Representative images are shown. Scale bar = 20 µm. b In situ PLA between RAD51 and parental ssDNA in WS cells expressing Flag-WRNwt or WRN6A and treated with MRE11i during recovery. The graph shows individual values of PLA spots of at least 50 cells from two independent experiments. Bars represent mean ± S.E. (Two-tailed Mann-Whitney test for paired samples. Where not indicated, values are not significant). Representative images are shown. Scale bar = 20 µm. c Neutral Comet assay for DSB evaluation in WS cells expressing Flag-WRNwt or WRN6A and treated as reported in the experimental scheme. The graph shows individual tail moment values of at least 50 cells from two independent experiments. Bars represent mean ± S.E. Statistical analyses were performed by Student’s t-test (Where not indicated, values are not significant). Representative images are provided. Scale bar = 20 µm. d Neutral Comet assay for DSB evaluation in WS cells expressing Flag-WRNwt or WRN6A and transfected with control (CTRL) or siMUS81 RNAi. The graph shows individual tail moment values of at least 80 cells from two independent experiments. Bars represent mean ± S.E. Statistical analyses were performed using Student’s t-test. Scale bar = 20 µm. e Proposed model: Replication fork stalling near secondary DNA structures, such as G4s (depicted in the leading strand for simplicity) requires WRN and its partner RPA for resolution. In the absence of WRN-RPA binding, these structures persist, and replication resumes downstream using PRIMPOL, if in the leading strand, leaving a gap in the template. During replication recovery, these gaps are processed by MRE11-exonuclease, which enables MUS81 endonuclease to induce DSBs. RAD51-mediated post-replication repair then facilitates the “removal” of the secondary DNA structures, such as G4s. Source data are provided as a Source Data file.

Update of

References

    1. Franchitto, A. & Pichierri, P. Understanding the molecular basis of common fragile sites instability: Role of the proteins involved in the recovery of stalled replication forks. Cell Cycle10, 4039–4046 (2011). - PubMed
    1. Brosh, R. M. & Bohr, V. A. Human premature aging, DNA repair and RecQ helicases. Nucleic Acids Res.35, 7527–7544 (2007). - PMC - PubMed
    1. Oshima, J., Sidorova, J. M. & Monnat, R. J. Werner syndrome: clinical features, pathogenesis and potential therapeutic interventions. Ageing Res Rev.33, 105–114 (2017). - PMC - PubMed
    1. Croteau, D. L., Popuri, V., Opresko, P. L. & Bohr, V. A. Human RecQ helicases in DNA repair, recombination, and replication. Annu Rev. Biochem83, 519–552 (2014). - PMC - PubMed
    1. Rossi, M. L., Ghosh, A. K. & Bohr, V. A. Roles of Werner syndrome protein in protection of genome integrity. DNA repair9, 331–344 (2010). - PMC - PubMed

MeSH terms

LinkOut - more resources