. 2025 Jan 27;16(1):1077.
doi: 10.1038/s41467-025-56301-2.

A compendium of Amplification-Related Gain Of Sensitivity genes in human cancer

Affiliations

A compendium of Amplification-Related Gain Of Sensitivity genes in human cancer

Veronica Rendo et al. Nat Commun. .

Abstract

While the effect of amplification-induced oncogene expression in cancer is known, the impact of copy-number gains on "bystander" genes is less understood. We create a comprehensive map of dosage compensation in cancer by integrating expression and copy number profiles from over 8000 tumors in The Cancer Genome Atlas and cell lines from the Cancer Cell Line Encyclopedia. Additionally, we analyze 17 cancer open reading frame screens to identify genes toxic to cancer cells when overexpressed. Combining these approaches, we propose a class of 'Amplification-Related Gain Of Sensitivity' (ARGOS) genes located in commonly amplified regions, yet expressed at lower levels than expected by their copy number, and toxic when overexpressed. We validate RBM14 as an ARGOS gene in lung and breast cancer cells, and suggest a toxicity mechanism involving altered DNA damage response and STING signaling. We additionally observe increased patient survival in a radiation-treated cancer cohort with RBM14 amplification.


Conflict of interest statement

Competing interests: K.S. is on the SAB and has stock options with Auron Therapeutics. K.S. receives grant funding from Novartis and KronosBio on topics unrelated to this manuscript. W.C.H. is a consultant for Thermo Fischer Scientific, Solasta Ventures, MPM capital, KSQ Therapeutics, Tyra Biosciences, Frontier Medicines, Jubilant Therapeutics, RAPPTA Therapeutics, Serinus Biosciences, Hexagon Biosciences, Kestral Therapeutics, Function Oncology, and Calyx. R.B. consults for Scorpion Therapeutics and receives grant funding from Novartis. U.B.D. consults for Accenet Therapeutics and received funding from Novocure. F.F. is co-founder and Chief Scientific Officer of iPsomics. The work in this study is unrelated to this role. The remaining authors declare no competing interests.

Figures

Fig. 1
Fig. 1. Approach to identify ARGOS genes.
a The landscape of CNAs with the frequency of amplifications and deletions across TCGA tumors shows preferential gains of OGs and losses of TSGs. Genes gained in over 15% of samples (dotted line) were considered commonly amplified. b Individual CNA events typically contain multiple genes at a median of 58. c Normalized RNA expression across all genes and cell lines scales with DNA copy number in the CCLE, although there is a considerable spread around this trend (scaling P-value from linear regression model without intercept). We then statistically model which genes are expressed consistently lower or higher than the expectation and refer to them as compensated and hyperactivated, respectively. d ARGOS genes are identified by genes that are collaterally affected by amplifications, which are also detrimental to cell growth when overexpressed and show compensation upon copy number gain. e In practical terms, we employ the CCLE and TCGA cohorts to identify compensated genes and confirm the toxicity phenotype by repurposing previously published ORF screens.
Fig. 2
Fig. 2. Compensated and toxic genes.
a Using a Bayesian Negative Binomial regression model, we split the expression of each gene in CCLE and TCGA into components that are scaling (orange) and deviating (red) from DNA content. For TCGA data, we explicitly take into account non-cancer cells (blue). We apply this model across (pan-cancer) and for individual cancer types (tissue-specific). b In the pan-cancer model, deregulation is well correlated between CCLE and TCGA, and we identify commonly compensated (red) and hyperactivated genes (blue). These are genes that show a compensation score in both data sets of less than − 0.3 or more than 0.3, respectively (dotted lines). c Number of pan-cancer (left) and tissue-specific (right) compensated genes, specific to either CCLE or TCGA datasets or common to both. Numbers mentioned in the text are highlighted. d We utilize ORF overexpression screens to quantify barcode abundance for outgrowth after the selection marker, which (e) identifies genes that are promoting (green) or attenuating (red) cell growth when overexpressed. Genes passing the significance threshold of the linear regression model are shown with a black outline. f Numbers of pan-cancer vs. tissue-specific toxic (attenuating) genes and their overlap. Figure 2d was created in BioRender. Beroukhim, R. (2024) https://BioRender.com/z69q647.
Fig. 3
Fig. 3. Overlap of compensation and toxicity identifies ARGOS genes.
a All gene classes are spread along the genome and densities using a Gaussian estimator with a 1 Mb bandwidth show clustering only in gene-dense regions (cf. Supplementary Fig. S4a). b Compensated genes (110) are dropping out more strongly in the ORF screen than hyperactivated (451) and non-regulated genes. Boxes show median ± quartile, whiskers 1.5x inter-quartile range, and P-values from a two-sided t test. c The overlap of compensated and toxic genes identifies eight genes, five of which are amplified in over 15% of TCGA tumors (upward pointing triangles). Numbers include only genes present in both CCLE and TCGA, numbers in brackets include all genes present in data. d Prioritization of protein complexes with ARGOS genes (Fisher’s Exact test on CORUM complexes, y-axis) and their toxicity (Wald statistic of a linear regression model for ORF dropout, x-axis) identifies the HDP-RNP and U1A spliceosomal complexes. Paraspeckle genes in the HDP-RNP complex are both compensated and toxic, while nonhomologous end-joining (NHEJ) genes show no effect or the opposite trend. Complexes without evidence of compensation and toxicity are shaded gray and yellow, respectively.
Fig. 4
Fig. 4. CDKN1A as an ARGOS gene.
a The map of copy number alterations in chromosome 6 shows a p-arm amplification, where CDKN1A is located among other known oncogenes. Amplifications (red) and deletions (blue) are shown for this genomic region. The genomic location of OGs and TSGs are shown at the level of amplification- and deletion frequencies for easier visibility, reflecting their respective selection pressure. b Compensation scores for CDKN1A in our pan-cancer analysis (green) as well as in breast (purple) and lung (orange) lineages chosen for downstream functional validation. Bars represent the mean, error bars the standard deviation of the posterior. c Depletion scores for CDKN1A ORFs across 17 independent screens, including breast (BRCA), ovarian (OV), neuroblastoma (NB), skin cutaneous melanoma (SKCM), lung adenocarcinoma (LUAD), Ewing sarcoma (EWS), medulloblastoma (MB) and prostate adenocarcinoma (PRAD) cell lines. The mean log-fold change in growth is shown as a line for each tumor type. d Lung and breast cancer cell lines chosen for functional validation based on their gene expression and DNA copy number profile on CCLE. e CDKN1A overexpression leads to a growth inhibition phenotype upon varying levels of overexpression. The mean and S.D. of three replicates are shown. Data was analyzed using two-way ANOVA.
Fig. 5
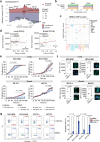
Fig. 5. RBM14 as an ARGOS gene.
a The map of copy number alterations in chromosome 11 shows a focal amplification, where RBM14 is located next to CCND1. Amplifications (red) and deletions (blue) are shown for this genomic region. The genomic location of OGs and TSGs are shown at the level of amplification- and deletion frequencies for easier visibility, reflecting their respective selection pressure. b Compensation or ORF dropout scores for RBM14 in our pan-cancer analysis (green) as well as in breast (purple) and lung (orange) lineages chosen for downstream functional validation. Bars represent the mean, error bars the standard deviation of the posterior. c Depletion scores for RBM14 ORFs across 17 independent screens, including breast (BRCA), ovarian (OV), neuroblastoma (NB), skin cutaneous melanoma (SKCM), lung adenocarcinoma (LUAD), Ewing sarcoma (EWS), medulloblastoma (MB) and prostate adenocarcinoma (PRAD) cell lines. The mean log-fold change in growth is shown as a line for each tumor type. d Lung and breast cancer cell lines chosen for functional validation based on their gene expression and DNA copy number profile on CCLE. e RBM14 overexpression leads to a growth inhibition phenotype. The mean and S.D. of three replicates are shown. Data was analyzed using two-way ANOVA. f RBM14 overexpressing lung and breast cells show a decrease in nascent protein synthesis. Fluorescence (GFP; green) is quantified relative to cell number (DAPI; blue). Luciferase overexpressing cells were used as a control. Scale bar: 100 µM. Mean +/− SD is shown from two biological replicates (five images per cell line; six for HCC70) and analyzed by unpaired two-tailed t test. g The fraction of apoptotic cells following RBM14 overexpression was determined by flow cytometry-based quantification of annexin V and PI-positive cells. The mean and S.D. of three replicates is shown. Data was analyzed by unpaired two-tailed t test. Source data for Fig. 5c, f, and g are provided as Source Data files.
Fig. 6
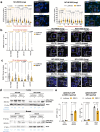
Fig. 6. RBM14 overexpression leads to differential DNA damage response.
a The number of yH2AX foci was quantified by immunofluorescence in lung NCI-H838RBM14/luc and NCI-H1650RBM14/luc cells following 2 Gy ionizing radiation (IR). Data from three biological replicates analyzed by two-way ANOVA. The horizontal bar in each violin plot indicates the mean. Representative images are shown for each condition at 60 min following IR. Scale bar: 10 µM. b, c Quantification of (b) 53BP1 and (c) RAD51 foci in RBM14- and luciferase-overexpressing cells at 60 min and 120 min post 2 Gy irradiation, respectively. Data was analyzed by two-way ANOVA. Representative images are shown for each condition. Scale bar: 20 µM. d Levels of DNA-PKcs (pSer2056) were detected and quantified by immunoblotting in cells at 15 min following 2 Gy IR. Representative immunoblot from two biological replicates. e RBM14 overexpressing U2OS cells exhibit higher rates of c-NHEJ-mediated repair. The fraction of U2OSRBM14/luc cells that repair double-strand breaks by c-NHEJ (EJ7-GFP; left) or HR (DR-GFP; right) was determined by quantifying GFP-positive cells in a flow cytometry-based reporter assay. GFP-positive cells were normalized to GFP transfection controls. Empty vector (EV) controls were included for comparison. Data from three biological replicates are presented as mean +/− SD and analyzed with a two-sided t test. Source data for Fig. 6a–d are provided as Source Data files.
Fig. 7
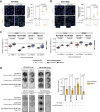
Fig. 7. RBM14 overexpression induces a STING-mediated innate immune response.
a, b Immunofluorescence quantification of perinuclear STING area in RBM14- and luciferase- overexpressing (a) NCI-H838 and (b) NCI-H1650 cells. STING area (mean +/− SD as indicated) was calculated relative to the total nuclei area in a total of 10 images per condition (from three biological replicates). Data was analyzed with two-way ANOVA. Scale bar: 10 µM. c Cell viability of RBM14- (blue) and luciferase- (red) overexpressing lung and breast cancer cell lines after 72 h of treatment with 1 µM C188-9 (left) and HJC052 (right) STAT3 inhibitors. Viability is shown relative to DMSO (0.1 µM for HCC70) treatment condition for each cell line (in three replicates for each condition) in the absence (circled symbol; solid line) or presence (squared symbols; dashed line) of 2 Gy DNA damage-inducing irradiation (IR). Boxes show median ± quartile, whiskers 1.5x inter-quartile range, and P-values from a two-sided t test. d Relative colony area (mean +/− SD) of RBM14- and luciferase- overexpressing lung and breast cancer cell lines after co-culture with NK-92 cells at a 10:1 ratio for 48 h following 2 Gy irradiation. Data was analyzed with one-way ANOVA three biological replicates. Source data for Fig. 7a–d are provided as Source Data files.
Fig. 8
Fig. 8. Impact of CCND1/RBM14 amplifications on patient survival in a CRC cohort.
a Copy number and gene expression of CCND1 and (b) RBM14. c Overall patient survival by co-amplification of CCDN1 and RBM14 vs. only CCND1. Cox Proportional Hazards model adjusting for sex and age P = 0.048.

References

    1. Beroukhim, R. et al. The landscape of somatic copy-number alteration across human cancers. Nature463, 899–905 (2010). - PMC - PubMed
    1. Zack, T. I. et al. Pan-cancer patterns of somatic copy number alteration. Nat. Genet.45, 1134–1140 (2013). - PMC - PubMed
    1. Ben-David, U. & Amon, A. Context is everything: aneuploidy in cancer. Nat. Rev. Genet.21, 44–62 (2020). - PubMed
    1. Fehrmann, R. S. N. et al. Gene expression analysis identifies global gene dosage sensitivity in cancer. Nat. Genet.47, 115–125 (2015). - PubMed
    1. Gonçalves, E. et al. Widespread post-transcriptional attenuation of genomic copy-number variation in cancer. Cell Syst.5, 386–398 (2017). - PMC - PubMed

Substances