. 2025 Jan 27;8(1):64.
doi: 10.1038/s41746-025-01461-0.

Multimodal machine learning enables AI chatbot to diagnose ophthalmic diseases and provide high-quality medical responses

Affiliations

Multimodal machine learning enables AI chatbot to diagnose ophthalmic diseases and provide high-quality medical responses

Ruiqi Ma et al. NPJ Digit Med. .

Abstract

Chatbot-based multimodal AI holds promise for collecting medical histories and diagnosing ophthalmic diseases using textual and imaging data. This study developed and evaluated the ChatGPT-powered Intelligent Ophthalmic Multimodal Interactive Diagnostic System (IOMIDS) to enable patient self-diagnosis and self-triage. IOMIDS included a text model and three multimodal models (text + slit-lamp, text + smartphone, text + slit-lamp + smartphone). The performance was evaluated through a two-stage cross-sectional study across three medical centers involving 10 subspecialties and 50 diseases. Using 15640 data entries, IOMIDS actively collected and analyzed medical history alongside slit-lamp and/or smartphone images. The text + smartphone model showed the highest diagnostic accuracy (internal: 79.6%, external: 81.1%), while other multimodal models underperformed or matched the text model (internal: 69.6%, external: 72.5%). Moreover, triage accuracy was consistent across models. Multimodal approaches enhanced response quality and reduced misinformation. This proof-of-concept study highlights the potential of chatbot-based multimodal AI for self-diagnosis and self-triage. (The clinical trial was registered on June 26, 2023, on ClinicalTrials.gov under the registration number NCT05930444.).


Conflict of interest statement

Competing interests: The authors declare no competing interests.

Figures

Fig. 1
Fig. 1. Overview of the workflow and functionality of IOMIDS.
a Intelligent Ophthalmic Multimodal Interactive Diagnostic System (IOMIDS) is an embodied conversational agent integrated with ChatGPT designed for multimodal diagnosis using eye images and medical history. It comprises a text model and an image model. The text model employs classifiers for chief complaints, along with question and analysis prompts developed from real doctor-patient dialogs. The image model utilizes eye photos taken with a slit-lamp and/or smartphone for image-based diagnosis. These modules combine through diagnostic prompts to create a multimodal model. Patients with eye discomfort can interact with IOMIDS using natural language. This interaction enables IOMIDS to gather patient medical history, guide them in capturing eye lesion photos with a smartphone or uploading slit-lamp images, and ultimately provide disease diagnosis and ophthalmic subspecialty triage information. b Both the text model and the multimodal models follow a similar workflow for text-based modules. After a patient inputs their chief complaint, it is classified by the chief complaint classifier using keywords, triggering relevant question and analysis prompts. The question prompt guides ChatGPT to ask specific questions to gather the patient’s medical history. The analysis prompt considers the patient’s gender, age, chief complaint, and medical history to generate a preliminary diagnosis. If no image information is provided, IOMIDS provides the preliminary diagnosis along with subspecialty triage and prevention, treatment, and care guidance as the final response. If image information is available, the diagnosis prompt integrates image analysis with the preliminary diagnosis to provide a final diagnosis and corresponding guidance. c The text + image multimodal model is divided into text + slit-lamp, text + smartphone, and text + slit-lamp + smartphone models based on image acquisition methods. For smartphone-captured images, YOLOv7 segments the image to isolate the affected eye, removing other facial information, followed by analysis using a ResNet50-trained diagnostic model. Slit-lamp captured images skip segmentation and are directly analyzed by another ResNet50-trained model. Both diagnostic outputs undergo threshold processing to exclude non-relevant diagnoses. The image information is then integrated with the preliminary diagnosis derived from textual information via the diagnosis prompt to form the multimodal model.
Fig. 2
Fig. 2. In silico development and silent evaluation of IOMIDS.
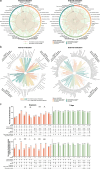
a Heatmaps of diagnostic (top) and triage (bottom) performance metrics after in silico evaluation of the text model (Dataset A). Metrics are column-normalized from -2 (blue) to 2 (red). Disease types are categorized into six major classifications. The leftmost lollipop chart displays the prevalence of each diagnosis and triage. b Radar charts of disease-specific diagnosis (red) and triage (green) accuracy in Dataset A. Rainbow ring represents six disease classifications. Asterisks indicate significant differences between diagnosis and triage accuracy based on Fisher’s exact test. c Bar charts of overall accuracy and disease-specific accuracy for diagnosis (red) and triage (green) after silent evaluation across different models (Dataset G). The line graph below denotes the model used: text model, text + slit-lamp model, text + smartphone model, and text + slit-lamp + smartphone model. d Sankey diagram of Dataset G illustrating the flow of diagnoses across different models for each case. Each line represents a case. PPV, positive predictive value; NPV, negative predictive value; * P < 0.05, ** P < 0.01, *** P < 0.001, **** P < 0.0001.
Fig. 3
Fig. 3. Internal and external evaluation of IOMIDS performance on diagnosis and triage.
a Radar charts of disease-specific diagnosis (red) and triage (green) accuracy after clinical evaluation of the text model in internal (left, Dataset 1) and external (right, Dataset 6) centers. Asterisks indicate significant differences between diagnosis and triage accuracy based on Fisher’s exact test. b Circular stacked bar charts of disease-specific diagnostic accuracy across different models from internal (left, Dataset 2–4) and external (right, Dataset 7–9) evaluations. Solid bars represent the text model, while hollow bars represent multimodal models. Asterisks indicate significant differences in diagnostic accuracy between two models based on Fisher’s exact test. c Bar charts of overall accuracy (upper) and accuracy of primary anterior segment diseases (lower) for diagnosis (red) and triage (green) across different models in Dataset 2–5 and Dataset 7–10. The line graphs below denote study centers (internal, external), models used (text, text + slit-lamp, text + smartphone, text + slit-lamp + smartphone), and data provider (researchers, patients). * P < 0.05, ** P < 0.01, *** P < 0.001, **** P < 0.0001.
Fig. 4
Fig. 4. Comparison of diagnostic performance across different models.
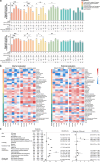
a Bar charts of diagnostic accuracy calculated for each disease classification across different models from internal (upper, Dataset 1–5) and external (lower, Dataset 6–10) evaluations. The bar colors represent disease classifications. The line graphs below denote study centers, models used, and data providers. b Heatmaps of diagnostic performance metrics after internal (left) and external (right) evaluations of different models. For each heatmap, metrics in the text model and text + smartphone model are normalized together by column, ranging from -2 (blue) to 2 (red). Disease types are classified into six categories and displayed by different colors. c Multivariate logistic regression analysis of diagnostic accuracy for all cases (left) and subgroup analysis for follow-up cases (right) during clinical evaluation. The first category in each factor is used as a reference, and OR values and 95% CIs for other categories are calculated against these references. OR, odds ratio; CI, confidence interval; *P < 0.05, **P < 0.01, ***P < 0.001, ****P < 0.0001.
Fig. 5
Fig. 5. Assessment of model-expert agreement and the quality of chatbot responses.
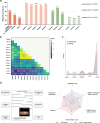
a Comparison of diagnostic accuracy of IOMIDS (text + smartphone model), GPT4.0, Qwen, expert ophthalmologists, ophthalmology trainees, and unspecialized junior doctors. The dotted lines represent the mean performance of ophthalmologists at different experience levels. b Heatmap of Kappa statistics quantifying agreement between diagnoses provided by AI models and ophthalmologists. c Kernel density plots of user satisfaction rated by researchers (red) and patients (blue) during clinical evaluation. d Example of an interactive chat with IOMIDS (left) and quality evaluation of the chatbot response (right). On the left, the central box displays the patient interaction process with IOMIDS: entering chief complaint, answering system questions step-by-step, uploading a standard smartphone-captured eye photo, and receiving diagnosis and triage information. The chatbot response includes explanations of the condition and guidance for further medical consultation. The surrounding boxes show a researcher’s evaluation of six aspects of the chatbot response. The radar charts on the right illustrate the quality evaluation across six aspects for chatbot responses generated by the text model (red) and the text + image model (blue). The axes for each aspect correspond to different coordinate ranges due to varying rating scales. Asterisks indicate significant differences between two models based on two-sided t-test. ** P < 0.01, *** P < 0.001, **** P < 0.0001.

References

    1. Poon H. Multimodal generative AI for precision health. NEJM AIhttps://ai.nejm.org/doi/full/10.1056/AI-S2300233 (2023). - DOI
    1. Tan, T. F. et al. Artificial intelligence and digital health in global eye health: opportunities and challenges. Lancet Glob. Health11, 1432–1443 (2023). - PubMed
    1. Wagner, S. K. et al. Development and international validation of custom- engineered and code-free deep-learning models for detection of plus disease in retinopathy of prematurity: a retrospective study. Lancet Digit. Health5, E340–E349 (2023). - PMC - PubMed
    1. Xu, P. S., Chen, X. L., Zhao, Z. W. & Shi, D. L. Unveiling the clinical incapabilities: a benchmarking study of GPT-4V(ision) for ophthalmic multimodal image analysis. Br. J. Ophthalmol.108, 1384–1389 (2024). - PubMed
    1. Antaki, F., Chopra, R. & Keane, P. A. Vision-language models for feature detection of macular diseases on optical coherence tomography. JAMA Ophthalmol.142, 573–576 (2024). - PMC - PubMed

Associated data

LinkOut - more resources