. 2025 Mar;22(3):520-529.
doi: 10.1038/s41592-024-02576-0. Epub 2025 Jan 27.

Multiplexed spatial mapping of chromatin features, transcriptome and proteins in tissues

Affiliations

Multiplexed spatial mapping of chromatin features, transcriptome and proteins in tissues

Pengfei Guo et al. Nat Methods. 2025 Mar.

Abstract

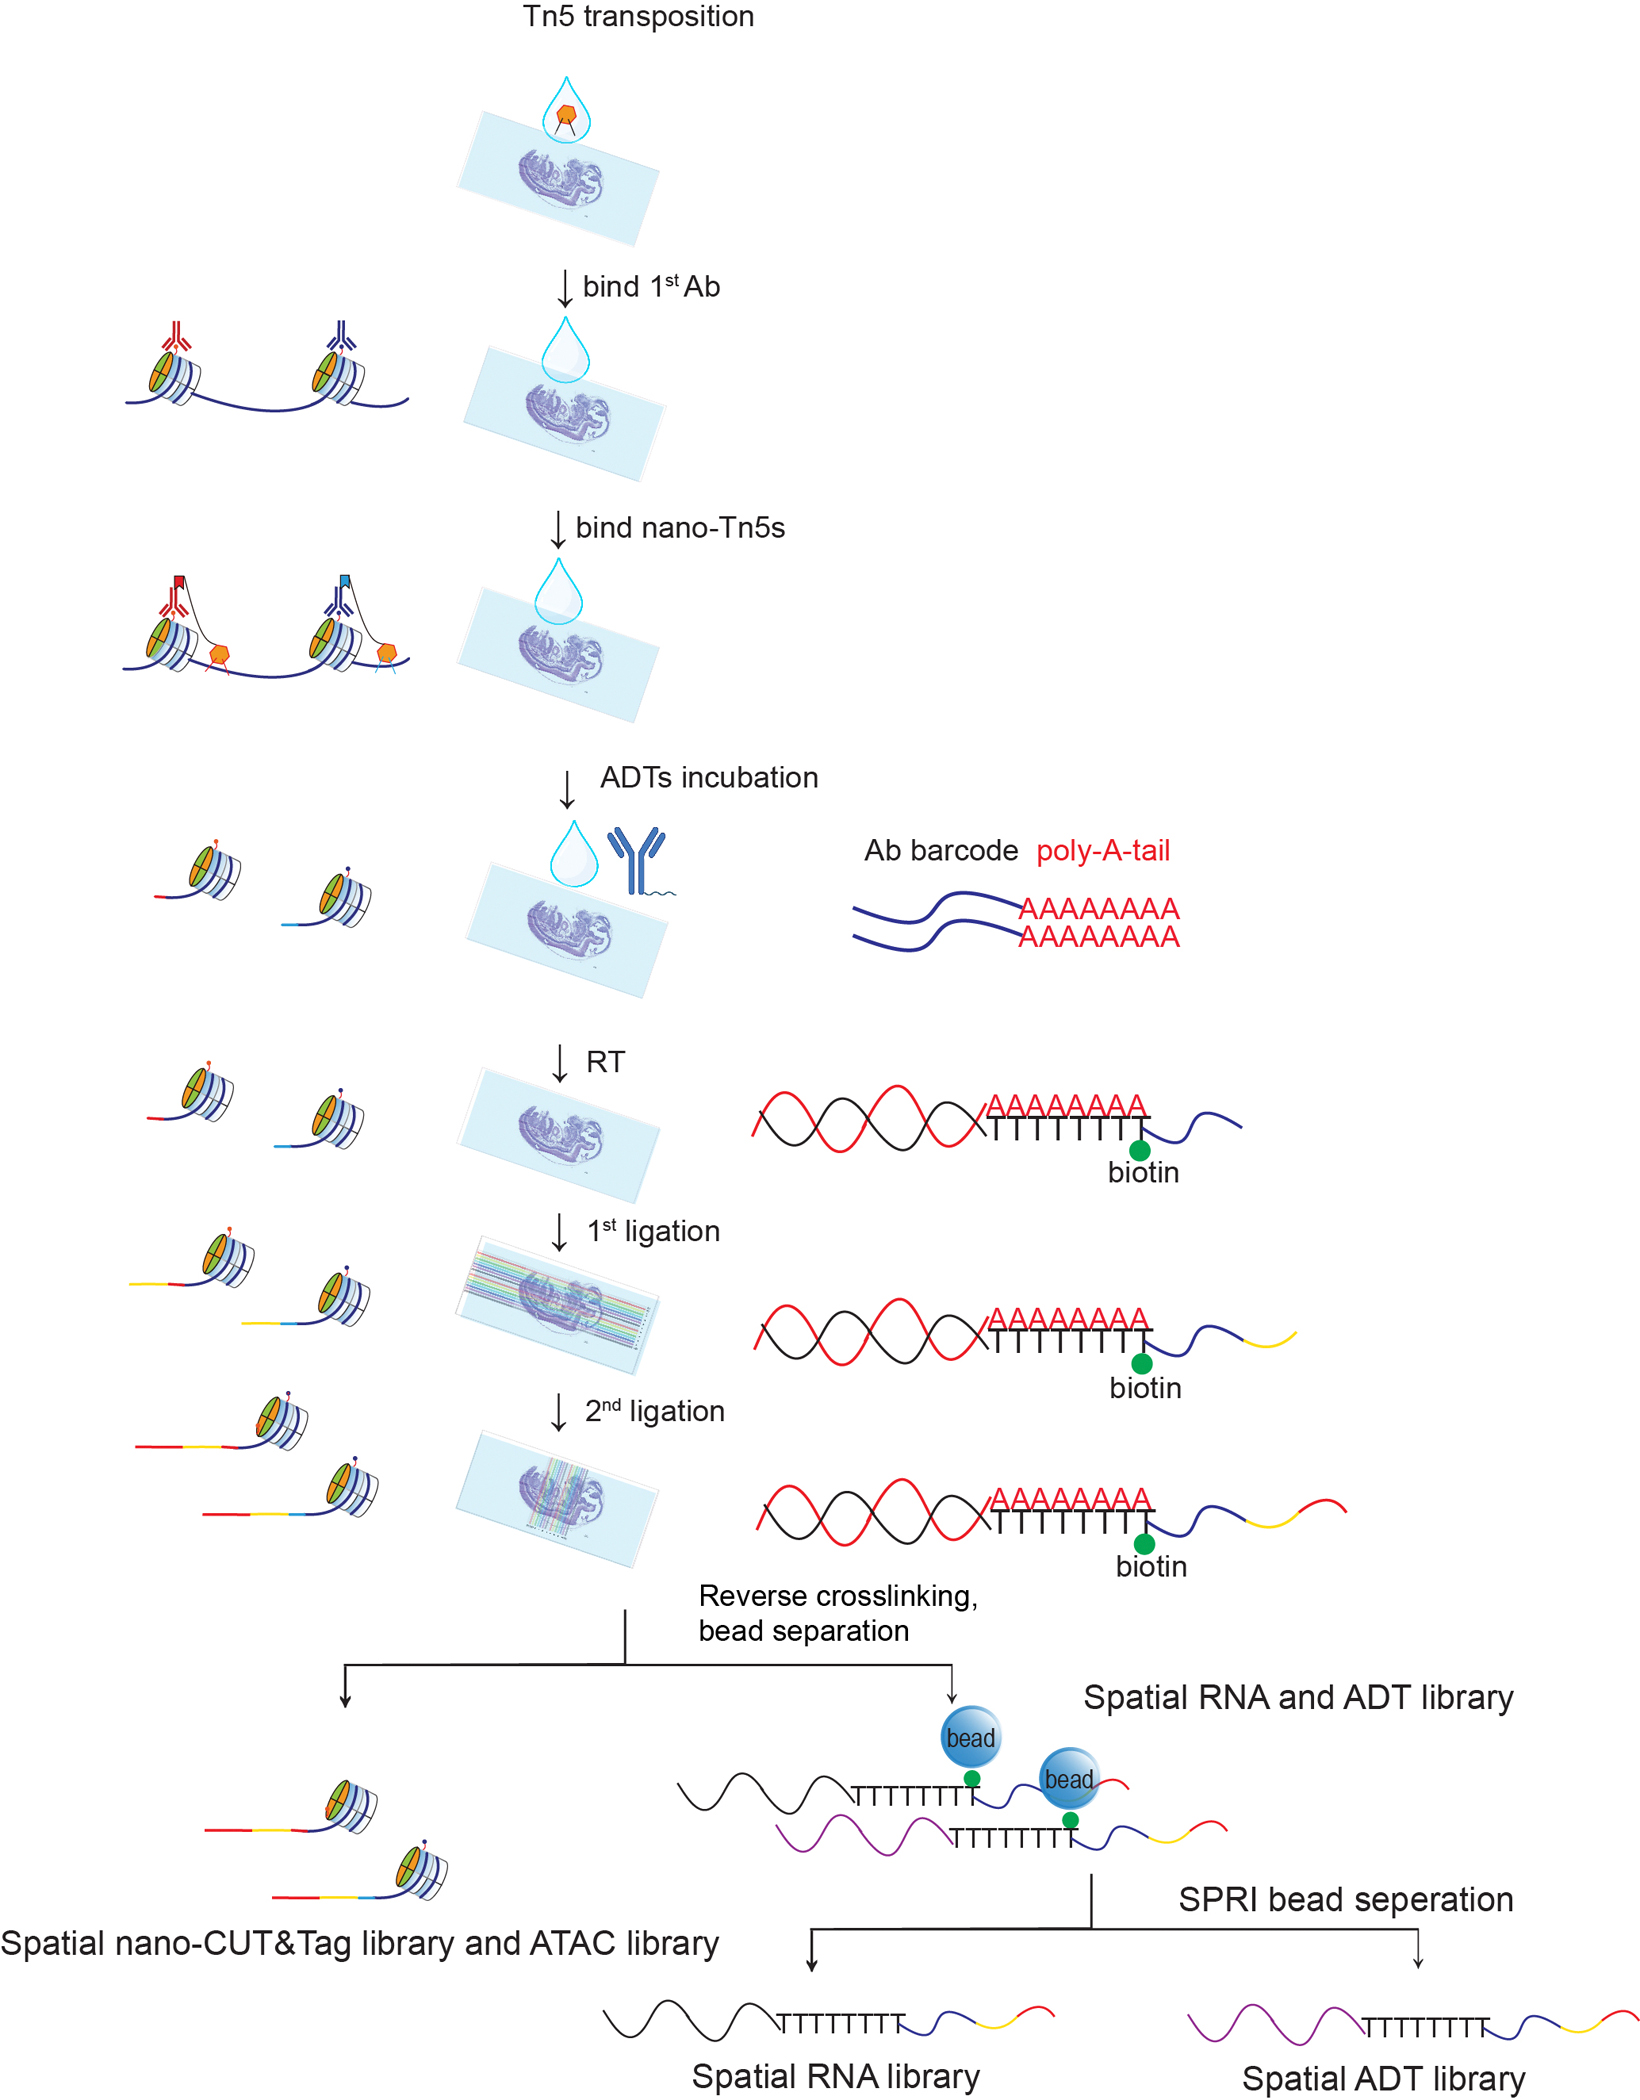
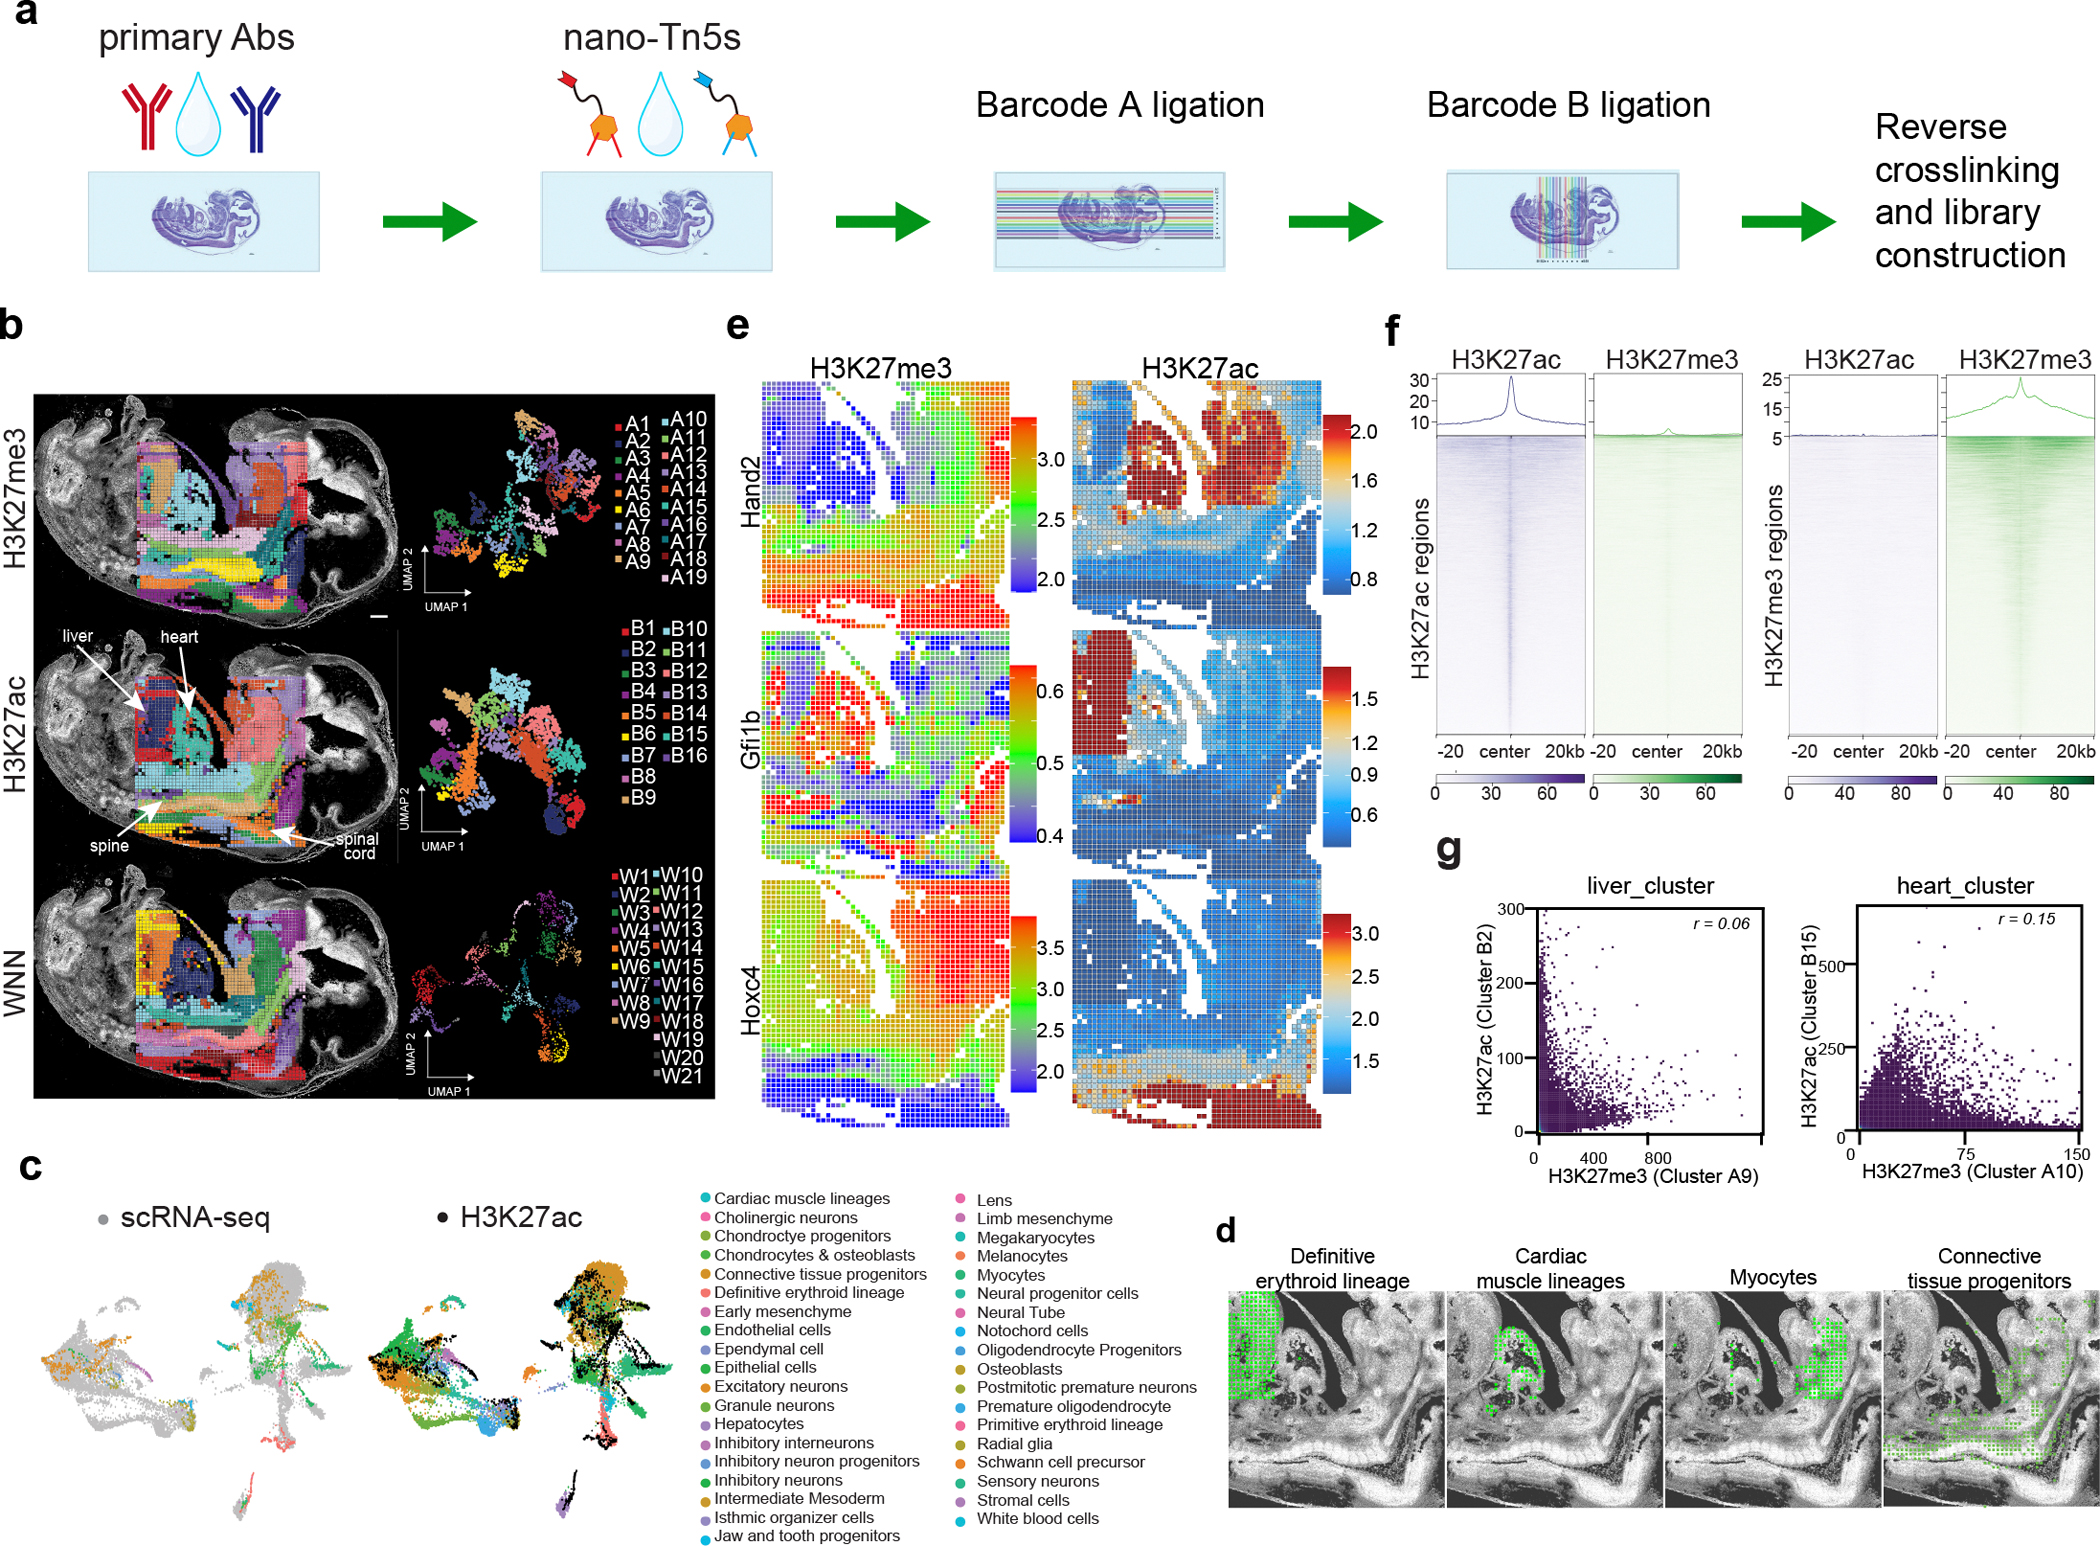
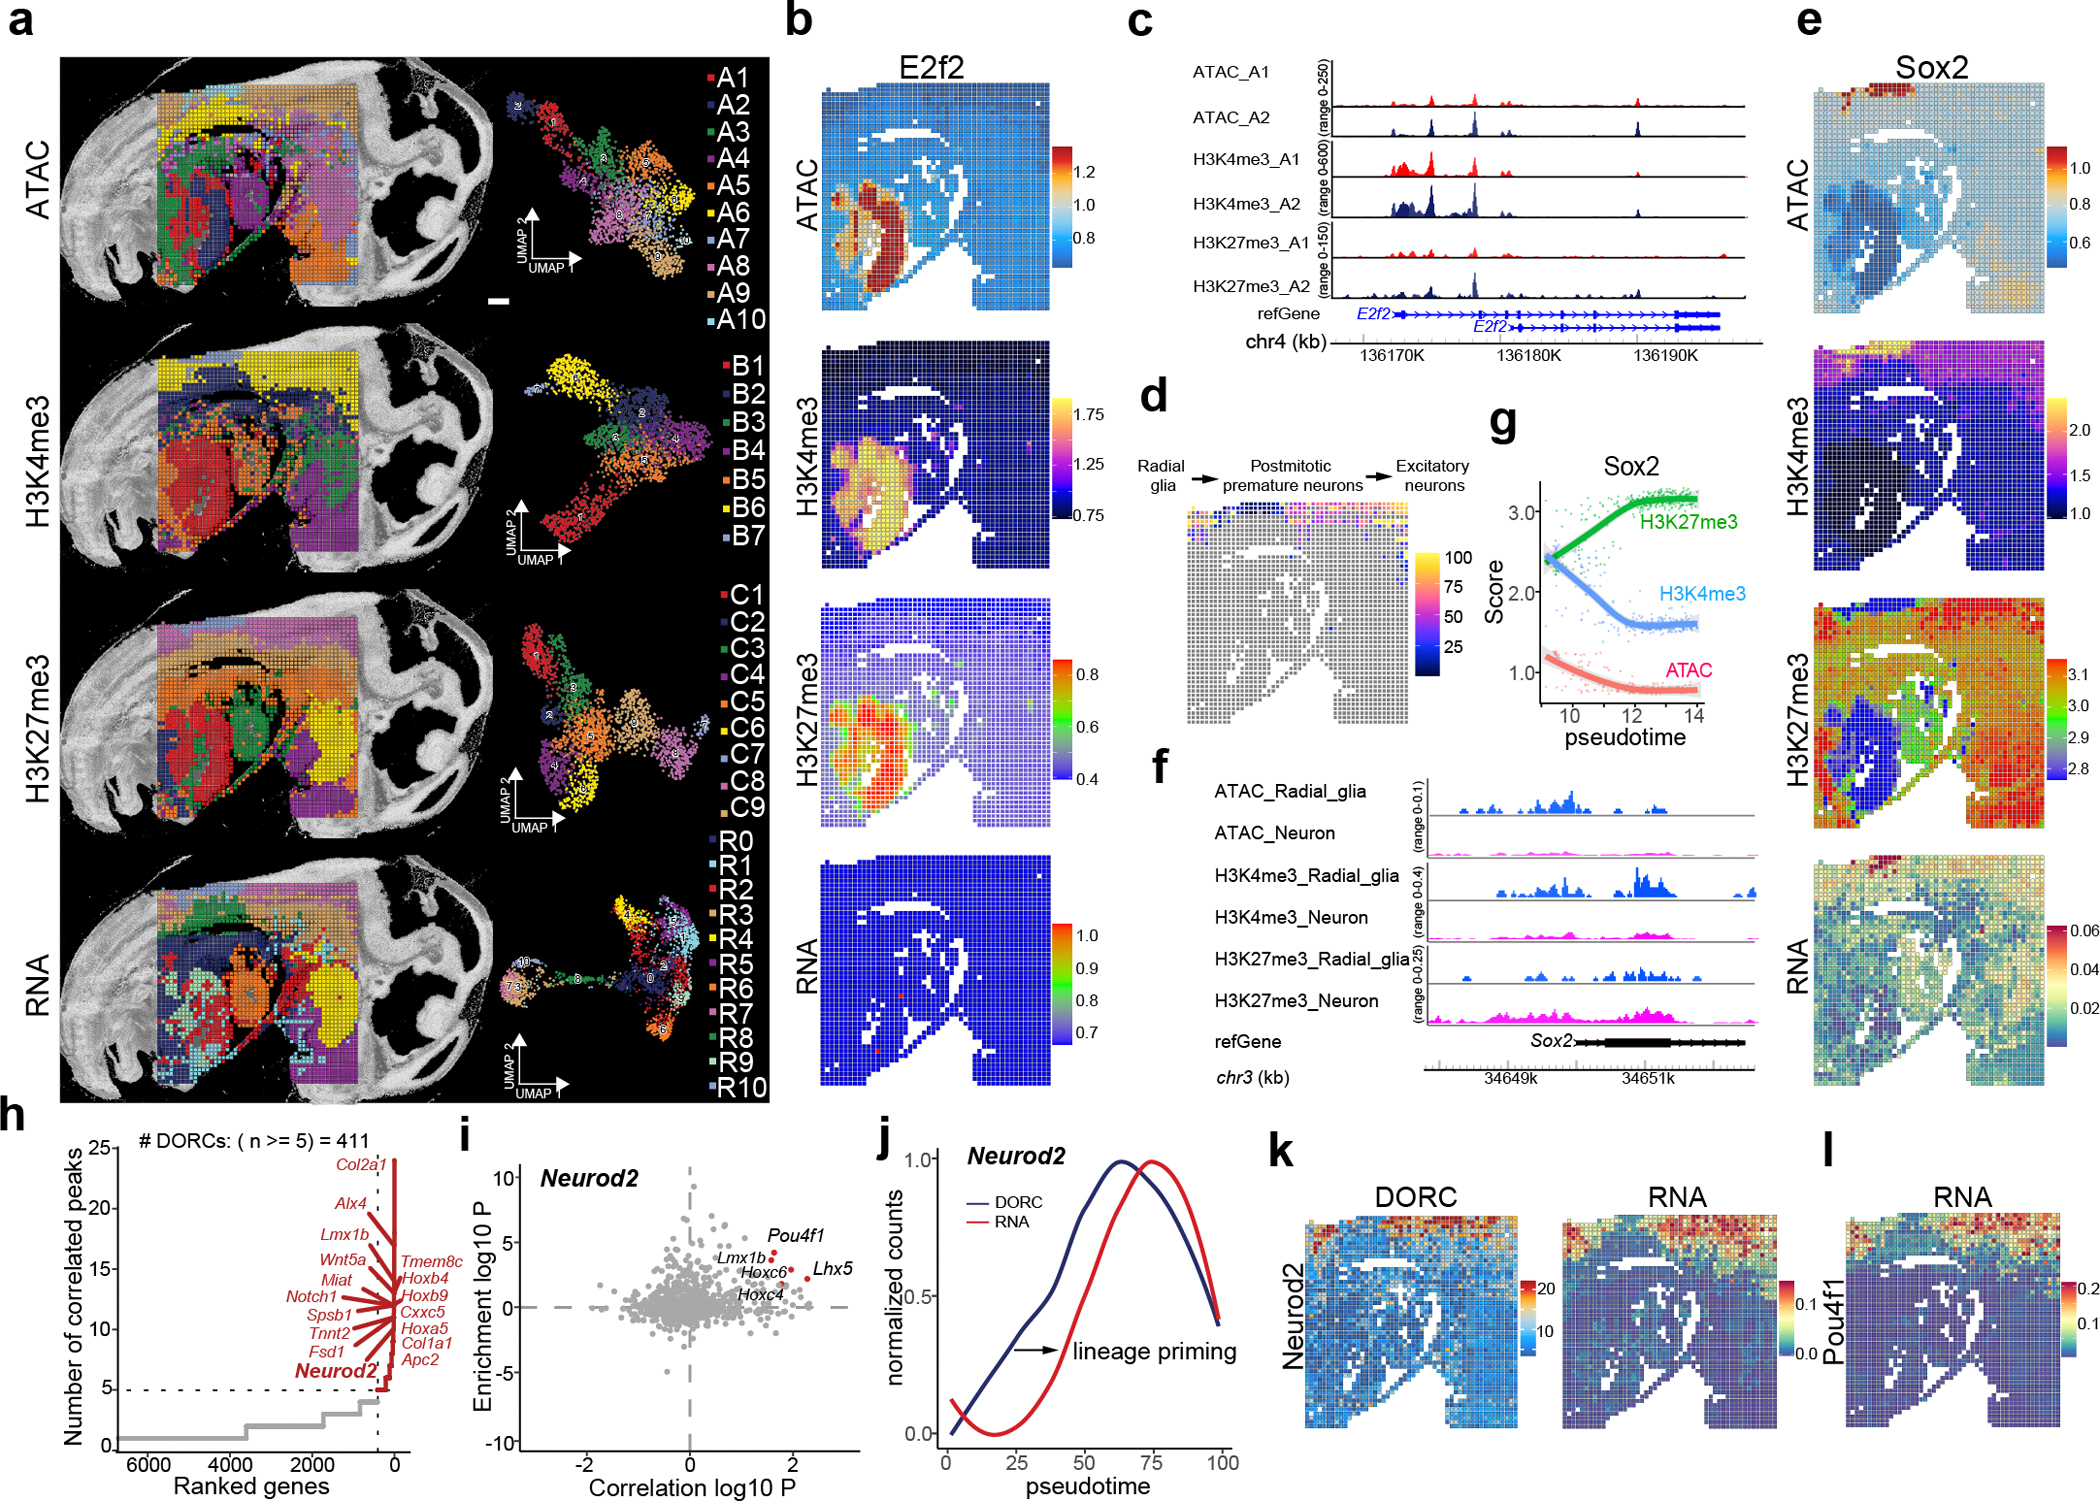
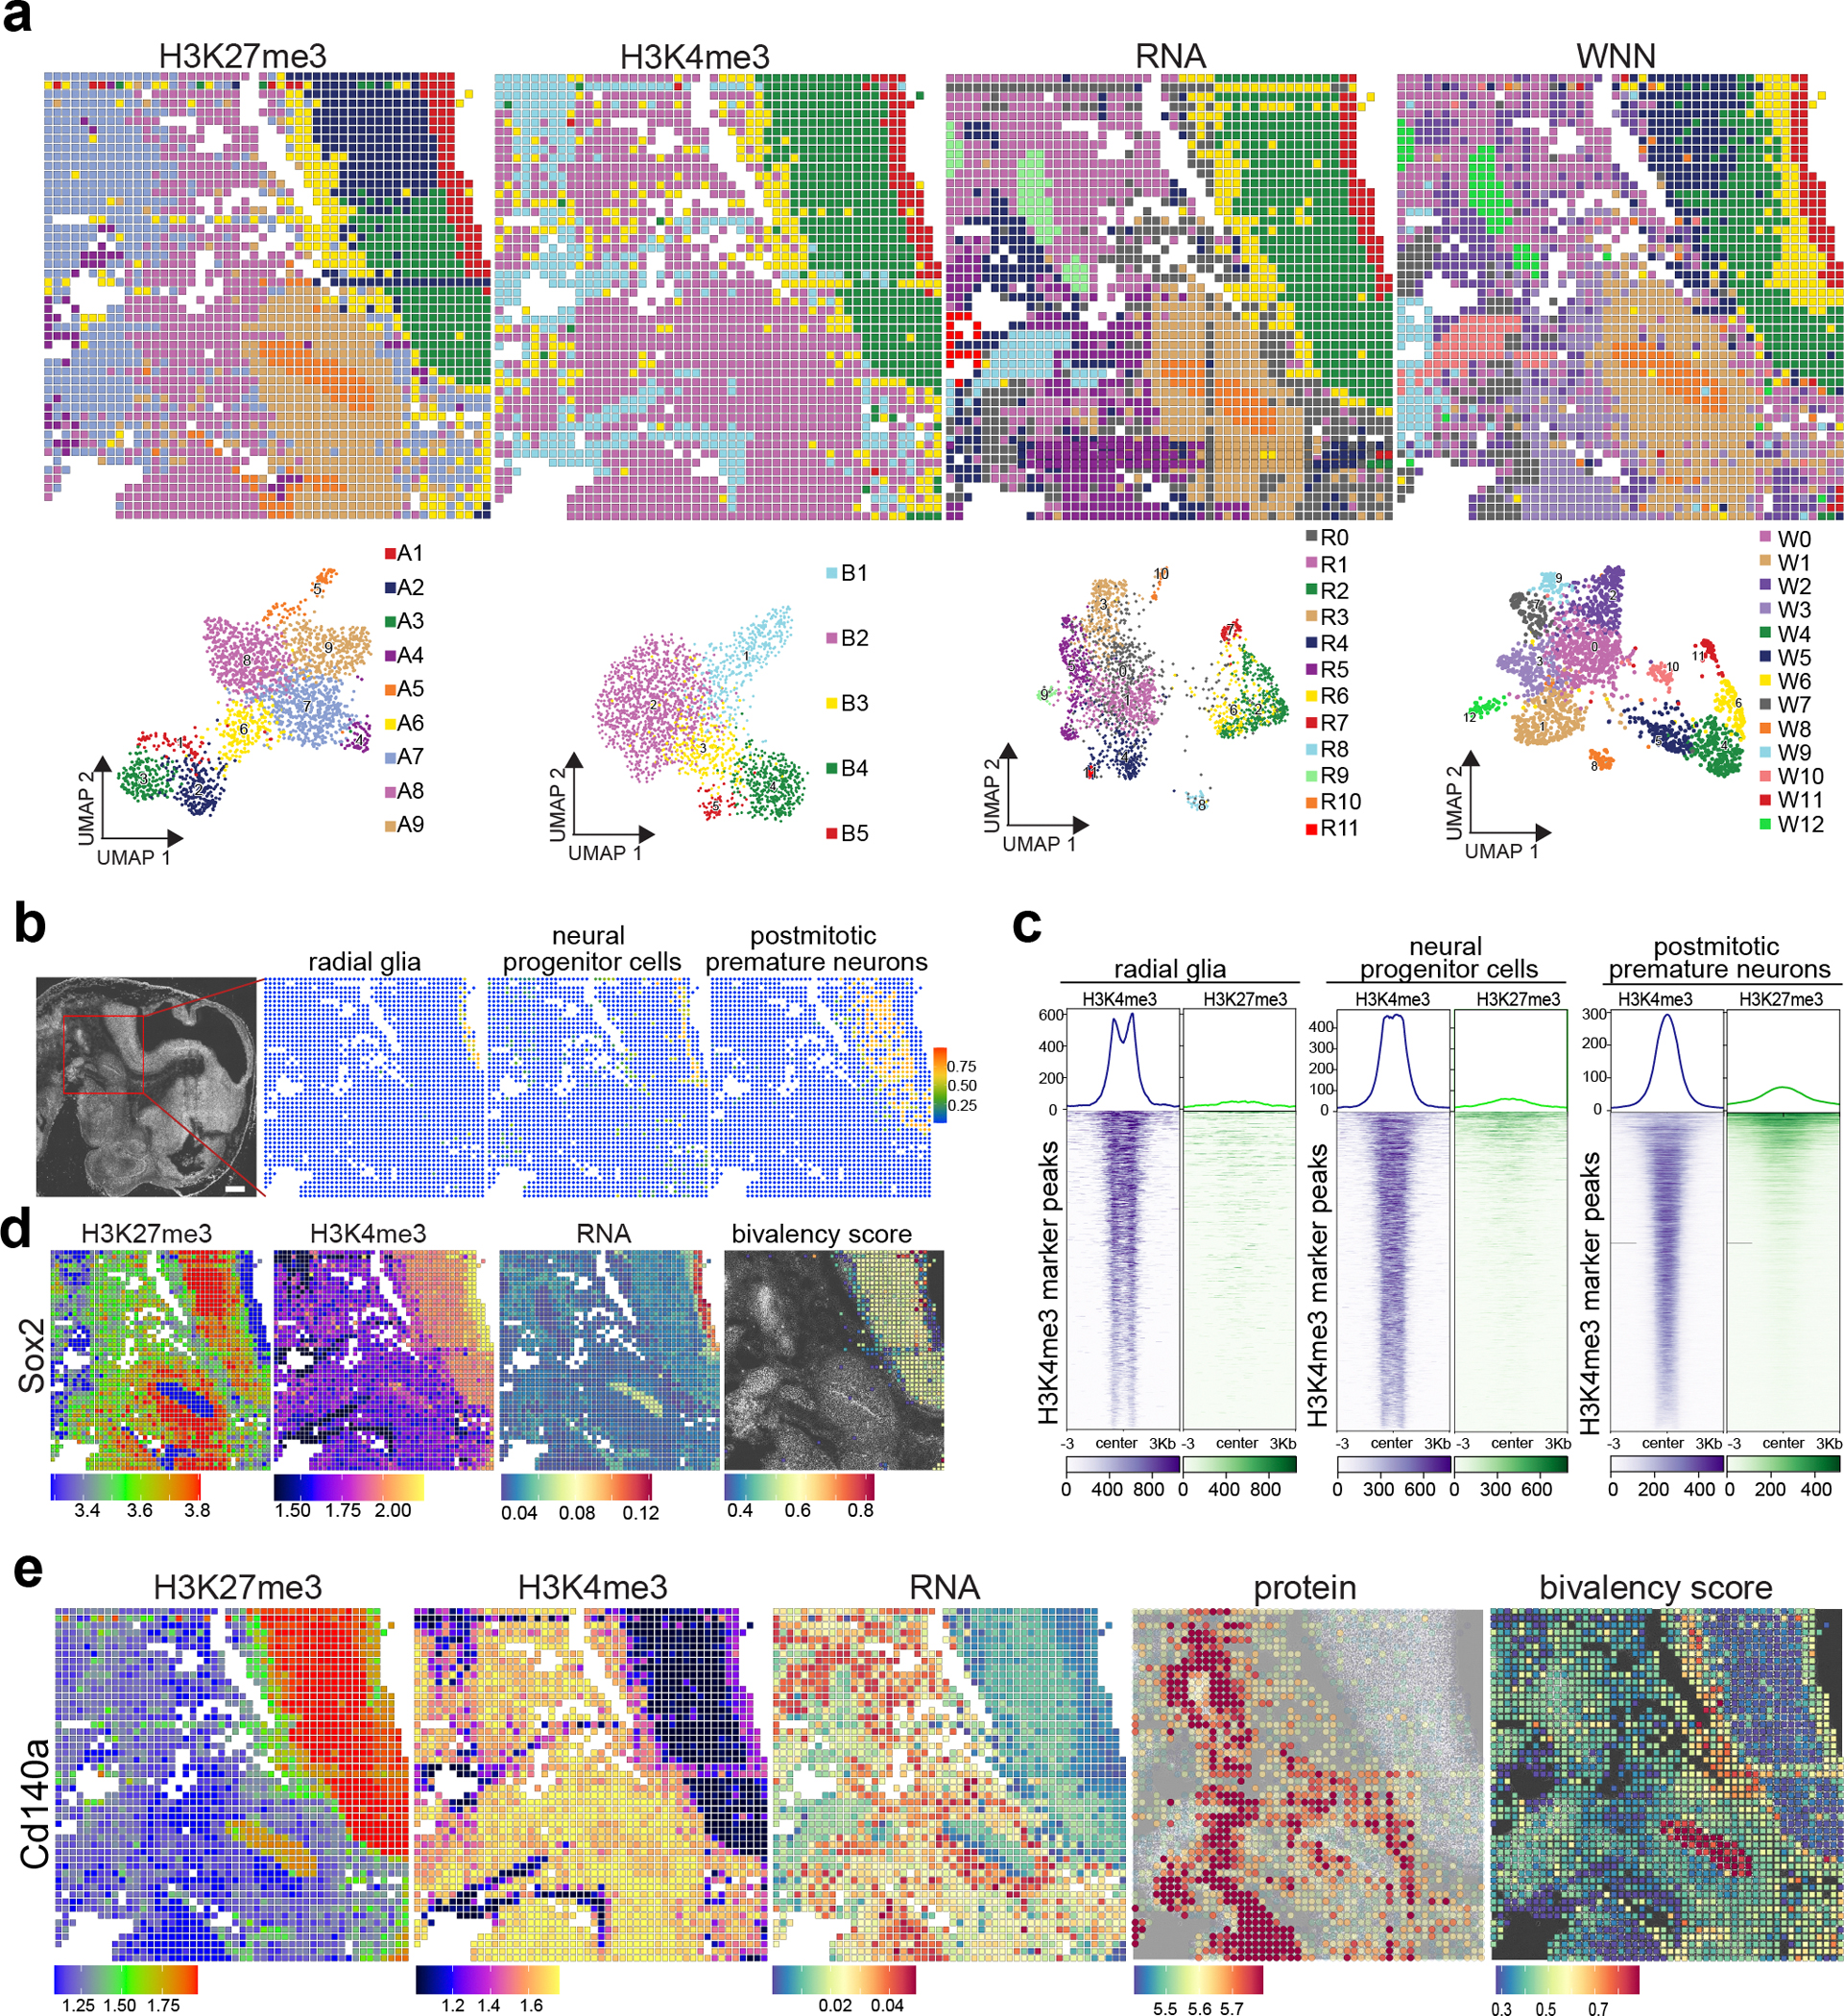
The phenotypic and functional states of cells are modulated by a complex interactive molecular hierarchy of multiple omics layers, involving the genome, epigenome, transcriptome, proteome and metabolome. Spatial omics approaches have enabled the study of these layers in tissue context but are often limited to one or two modalities, offering an incomplete view of cellular identity. Here we present spatial-Mux-seq, a multimodal spatial technology that allows simultaneous profiling of five different modalities: two histone modifications, chromatin accessibility, whole transcriptome and a panel of proteins at tissue scale and cellular level in a spatially resolved manner. We applied this technology to mouse embryos and mouse brains, generating detailed multimodal tissue maps that identified more cell types and states compared to unimodal data. This analysis uncovered spatiotemporal relationships among histone modifications, chromatin accessibility, gene expression and protein levels during neuron differentiation, and revealed a radial glia niche with spatially dynamic epigenetic signals. Collectively, the spatial multi-omics approach heralds a new era for characterizing tissue and cellular heterogeneity that single-modality studies alone could not reveal.


Conflict of interest statement

Competing interests: Y.D. and P.G. are inventors of a patent application related to this work. Y.D. is the scientific advisor of AtlasXomics Inc. M.L. receives research funding from Biogen Inc. unrelated to the current paper and is a cofounder of OmicPath AI LLC. The other authors declare no competing interests.

Figures

Extended Data Fig. 1 |
Extended Data Fig. 1 |. Workflow of spatial-Mux-seq.
Schematic workflow for spatial co-profiling of ATAC, two histone modifications, transcriptomes, and cell surface proteins: A tissue section was first incubated with wildtype Tn5. Two primary antibodies against different histone marks were then added, followed by incubation with two secondary nanobody-Tn5s. Next, a panel of ADTs is used to label cell surface proteins. In situ reverse transcription was then performed, followed by two rounds of DNA barcoding to create a mosaic of tissue pixels. Finally, gDNA and cDNA were collected and separated, and library construction was completed with PCR amplification.
Extended Data Fig. 2 |
Extended Data Fig. 2 |. Reproducibility of Spatial-Mux-seq.
Spatial-Mux-seq profiling of a mouse embryo tissue section (sample: E13_50_μm_2). a, Scatterplots showing TSS enrichment score versus unique nuclear fragments per pixel. b, Unique fragment counts in spatial-Mux-seq epigenome mapping of sample E13_μm_2 (50 μm pixel size: H3K27me3 and H3K27ac). c, Unsupervised clustering analysis is performed, revealing the spatial distribution of clusters corresponding to H3K27me3 and H3K27ac mark. d, Reproducibility between two biological replicates (samples E13_μm_1 and E13_μm_2) is shown, comparing the data for H3K27me3 and H3K27ac histone modifications. e, Venn diagram shows the overlap of peaks from two different spatial-Mux-seq experiments (co-profiled H3K27me3/H3K27ac). f, Distribution of insert size for histone modification fragments in the spatial-Mux-seq datasets.
Extended Data Fig. 3 |
Extended Data Fig. 3 |. Spatial-Mux-seq (co-profiled H3K27me3/H3K27ac) mapping of marker genes in E13 mouse embryos.
The spatial mapping (top) and genome browser tracks (bottom) illustrate gene silencing marked by H3K27me3, and gene activity marked by H3K27ac modifications. Two marker genes are highlighted: Nprl3 (a), representing gene silencing through H3K27me3, and Sox2 (b), showcasing gene activity associated with H3K27ac modification. Nprl3 and Sox2 genes were shown as a gray box.
Extended Data Fig. 4 |
Extended Data Fig. 4 |. Spatial-Mux-seq (co-profiled H3K27me3/H3K27ac) mapping of marker genes in E13 mouse embryo.
a, Spatial mapping of excitatory neurons identified through label transferring, overlaid on a tissue section. Neuronal clusters are visualized with distinct patterns, emphasizing their spatial distribution within the embryo. b, Correlation of H3K27ac GAS and scRNA-seq data in the cluster of excitatory neurons, highlighting the transcriptional activity associated with these regions. c, Correlation of H3K27me3 CSS and scRNA-seq data in the cluster of excitatory neurons, emphasizing the gene silencing characteristics of these neurons. d, Heatmaps showing spatial mapping of marker genes associated with H3K27me3 and H3K27ac modifications, with variations in color intensity indicating differential expression and histone modification patterns across the embryo tissue.
Extended Data Fig. 5 |
Extended Data Fig. 5 |. Spatial-Mux-seq (co-profiled H3K4me3/H3K27me3/ATAC/RNA) mapping of E13 mouse embryos
a, Spatial ATAC data and H3K4me3 data were integrated with scRNA-seq from mouse embryo (E13.5). Unsupervised clustering of the combined data was colored by different cell types. b, Spatial mapping of selected cell types identified by label transferring from scRNA-seq to spatial H3K4me3 data or spatial ATAC data. c, Spatial mapping of Ank3 and Gria2 genes with RNA, ATAC, H3K4me3, and H3K27me3 modalities. d-e, Scatter plot showing scaled values of Ank3 and Gria2 ATAC, H3K4me3, and H3K27me3 score across pseudotime from radial glia to differentiated neurons. f-g, GO enrichment analysis for genes from radial glia (f) to differentiated neurons (g). The P adj value indicates the Benjamini–Hochberg adjusted P value obtained from the one-tailed Fisher’s exact test. The top ten significant GO terms for each category are displayed.
Extended Data Fig. 6 |
Extended Data Fig. 6 |. Spatial co-profiling of protein, RNA, H3K4me3, and H3K27me3 in mouse embryos.
a, Spatial RNA data were integrated with scRNA-seq from E13.5 mouse embryos. This integration enabled the spatial mapping of specific cell types, including osteoblasts, sensory neurons, and epithelial cells within the embryonic tissue. The spatial patterns of marker genes of each cell type are performed with RNA modality. The red square highlights the region captured for spatial analysis. b, Spatial mapping of selected genes with RNA, H3K4me3, H3K27me3 and bivalency score. Scale bar: 500 μm.
Extended Data Fig. 7 |
Extended Data Fig. 7 |. Spatial co-profiling of RNA, H3K27ac, and H3K27me3 in mouse juvenile brain.
a, Spatial mapping of selected genes with RNA, H3K27ac, and H3K27me3 modalities. b, Unsupervised clustering analysis and spatial distribution of each modality with different resolution from Fig. 4a: H3K27me3 (Resolution: 3), H3K27ac (Resolution: 3), and RNA (Resolution: 5). c, Genome browser tracks of Prox1 gene in clusters DG-sg and DG-sgz. The selected TSS region of Prox1 was shown as a light blue box. d-e, Pearson correlation between Prox1 expression and histone mark H3K27me3 (d) or H3K27ac (e) gene scores. The gene scores are derived based on the gene model surrounding the transcription start site (TSS). Arrows indicate the high expression region of marker genes.
Extended Data Fig. 8 |
Extended Data Fig. 8 |. Quality control metrics for spatial-Mux-seq datasets.
Sample: 5M_20_μm. a, Spatial-Mux-seq profiling of ATAC, H3K27me3, H3K27ac, RNA, and proteins from EAE mouse brain section. Left: tissue scanning of the region of interest, aligned with the region annotation of a corresponding section from Allen Mouse Brain Atlas (P56). Middle and right: 20-μm-microfluidic device with 100×100 pixels. Two-time spatial barcodes (A1–100 and B1–100) were sequentially flowed over tissue section. The red square highlights the region captured for spatial analysis. b, Unique fragments, gene feature counts, and protein counts in spatial-Mux-seq mapping of five months mouse brain obtained with 20-μm pixel size. c, Scatterplots showing the TSS enrichment score vs unique nuclear fragments per pixel for three modalities: ATAC, H3K27me3 and H3K27ac. d, Violin plots of unique fragments and TSS enrichment values of ATAC, H3K27ac, and H3K27me3. e, Violin plots of gene counts and gene UMIs distribution. f, Violin plots of protein counts and protein UMIs distribution. d-f, Number of pixels in 5M_20_μm, 9,688. Box plots show the median (center line), the first and third quartiles (box limits) and 1.5x interquartile range (whiskers). Scale bar: 500 μm.
Extended Data Fig. 9 |
Extended Data Fig. 9 |. Spatial co-profiling of proteins, mRNA, H3K27me3, and H3K27ac in a EAE mouse brain.
Sample: 5M_20_μm. a, Spatial distribution and UMAP embeddings of unsupervised clustering analysis of ATAC (An), H3K27me3 (Bn), H3K27ac (Cn), RNA (Rn), and proteins (Pn) with five months old EAE mouse brain sample (20 μm pixel size). b, Spatial ATAC, H3K27ac, and RNA data were integrated with scRNA-seq from mouse brain. c, Spatial mapping of cell types identified by label transfer from scRNA-seq to ATAC (top), H3K27ac (middle), and RNA (bottom). MSN: medium spiny neurons. MOL: mature oligodendrocytes 2. TEGLU: Telencephalic Glutamatergic Neurons.
Extended Data Fig. 10 |
Extended Data Fig. 10 |. Spatial co-profiling of ATAC, H3K27me3, H3K27ac, protein, and RNA of selected genes for 5M-old mouse brain.
a, Spatial mapping marker genes: Cd63, Cd140a, Cd133, and Jaml by all five modalities: ATAC, H3K27me3, H3K27ac, protein, and RNA. b, Genome browser tracks of Cd140a (Pdgfra) gene expression and H3K27me3 signal in corpus callosum defined by spatial H3K27me3 data (cluster B8 from Extended Data Fig.18a). The selected TSS and 3’ coding regions of Cd140a longest isoforms were labeled with yellow and blue boxes respectively.
Fig. 1 |
Fig. 1 |. Spatial-Mux-seq co-profiling of H3K27me3 and H3K27ac modifications in E13 mouse embryos with integrative analysis.
Sample: E13_50_μm_1. a, A schematic overview illustrating the workflow for spatial multimodal profiling of chromatin modifications at the tissue scale. b, Spatial distribution and Uniform Manifold Approximation and Projection (UMAP) embeddings derived from unsupervised clustering analysis of H3K27me3 and H3K27ac histone modifications. The integrated analysis uses the Weighted Nearest Neighbor (WNN) methodology. c, Integration of single-cell RNA sequencing (scRNA-seq) data with spatial-Mux-seq H3K27ac profiling. The alignment of cell types identified in scRNA-seq (left) with spatially resolved H3K27ac data (middle). The cell types identified through scRNA-seq are listed (right). d, Spatial mapping of selected cell types identified through label transfer from scRNA-seq to H3K27ac data. e, Spatial mapping of key developmental marker genes with H3K27me3 and H3K27ac histone modifications. f, Metagene plots showing the distribution of H3K27me3 and H3K27ac in fetal liver clusters obtained by spatial-Mux-seq around specific H3K27me3 and H3K27ac peaks. The peaks were defined from ENCODE datasets. g, Scatter plots showing correlation of H3K27me3 and H3K27ac signal in the liver and heart clusters. The peaks were defined from ENCODE datasets. r, Pearson correlation coefficient. scale bar: 500 μm.
Fig. 2 |
Fig. 2 |. Spatial co-profiling of ATAC, RNA, H3K4me3, and H3K27me3 in mouse embryos.
Sample: E13_50_μm_3. a, Spatial distribution and UMAP embeddings from unsupervised clustering analysis of four different modalities—ATAC, RNA, H3K4me3, and H3K27me3—profiling in E13 mouse embryos at a 50 μm pixel resolution. b, Spatial mapping of E2f2 gene with ATAC, RNA, H3K4me3 and H3K27me3 marks. c, Genome browser tracks of the E2f2 gene showing ATAC, H3K4me3, H3K27me3, and RNA expression in liver clusters A1 and A2, as defined by ATAC-seq clustering. d, Integration of ATAC data with scRNA-seq data from E13.5 mouse embryos, followed by pseudotime analysis. The pseudotime trajectory from radial glia to postmitotic premature neurons and excitatory neurons is plotted in spatial coordinates. e, Spatial mapping of the Sox2 gene across ATAC, RNA, H3K4me3, and H3K27me3 modalities in the developing mouse brain. f, Genome browser tracks of Sox2 gene in ATAC, H3K4me3, and H3K27me3 modalities. The selected cell types are radial glia and postmitotic premature neurons. g, Scatter plot showing the dynamics of ATAC, H3K4me3, and H3K27me3 signals for Sox2 locus across pseudotime as determined in (d). h, ATAC and RNA data are used for domains of regulatory chromatin (DORCs) analysis with FigR package. The plot highlights the top-hit genes based on the number of significant gene-peak correlations across all cell types. (one-tailed t-test, FDR < 1×10⁻⁴, and P < 0.05). i, Identification of candidate transcription factor regulators of Neurod2 using DORC analysis. Highlighted points represent top-hit TFs with regulation score ⩾ 1 (−log10 scale), with all other TFs shown in gray. j, Comparison of chromatin (DORC) dynamics versus gene expression (RNA-seq) for Neurod2. k, Spatial patterns of DORCs Neurod2 and its gene expression. l, Spatial gene expression of the transcription factor Pou4f1. Scale bar: 500 μm.
Fig. 3 |
Fig. 3 |. Spatial co-profiling of protein, RNA, H3K4me3, and H3K27me3 in mouse embryos.
Sample: E13_20_μm. a, Spatial distribution and UMAP embeddings of unsupervised clustering analysis performed on each modality—H3K27me3, H3K4me3, RNA, and WNN integration—at a 20 μm pixel resolution in E13 mouse embryos. b, Integration of spatial RNA data with scRNA-seq data from E13.5 mouse embryos enables high-resolution mapping of selected cell types, including radial glia, neural progenitor cells, and postmitotic premature neurons. The red square highlights the region captured for spatial analysis. c, Deconvolution analysis of potential H3K4me3/H3K27me3 bivalency for clusters as determined in (b). d, Spatial mapping of the Sox2 gene across RNA, H3K4me3, H3K27me3 modalities, and the calculated Sox2 bivalency score. The bivalency score is calculated by chromatin bivalency analysis and described in Methods. e, Spatial patterns of the Cd140a gene, visualized across protein levels (using antibody-derived DNA tags), RNA expression, H3K4me3, H3K27me3, and the Cd140a bivalency score. Scale bar: 500 μm.
Fig. 4 |
Fig. 4 |. Spatial mapping of RNA, H3K27ac, and H3K27me3 in mouse juvenile brain.
Sample: P21_20_μm. a, Spatial distribution and UMAP embeddings of unsupervised clustering analysis of H3K27me3, H3K27ac, RNA, and WNN with mouse juvenile brain (P21: 20 μm pixel size). b, Hematoxylin and Eosin (H&E) stained image of an adjacent tissue section from the juvenile mouse brain (n = 1). c, Spatial mapping of two distinct hippocampal dentate gyrus subclusters: the dentate gyrus subgranular zone (DG-sgz) and the dentate gyrus granular cell layer (DG-sg). d, UMAP embeddings of the DG-sgz and DG-sg clusters, illustrating their distinct separation based on their molecular signatures. e, Differential expression of genes in DG-sgz clusters and DG-sg clusters. Volcano plot depicting the differentially expressed genes in DG-sgz clusters compared with DG-sg clusters (two-tailed t-test, P adj <0.05, logFC.threshold = 0.25). f, Spatial mapping of the Igfbpl1 gene, showing its expression across RNA, H3K27ac, and H3K27me3 modalities. g, Genome browser tracks for the Igfbpl1 gene within the DG-sg and DG-sgz clusters, detailing the chromatin landscape at this locus. The selected TSS region of Igfbpl1 was shown as a gray box. h-i, Pearson correlation between Igfbpl1 expression and histone mark H3K27ac (h) or H3K27me3 (i) gene scores. The gene scores are derived based on the gene model surrounding the transcription start site (TSS) covering the DG-sg and DG-sgz clusters. j, Correlation of H3K27ac GAS and RNA gene expression. k, Correlation of H3K27me3 CSS and gene expression. Scale bar: 500 μm.

Update of

References

    1. Vandereyken K, Sifrim A, Thienpont B & Voet T Methods and applications for single-cell and spatial multi-omics. Nature Reviews Genetics 24, 494–515 (2023). 10.1038/s41576-023-00580-2 - DOI - PMC - PubMed
    1. Deng Y, Bai Z & Fan R Microtechnologies for single-cell and spatial multi-omics. Nature Reviews Bioengineering 1, 769–784 (2023). 10.1038/s44222-023-00084-y - DOI
    1. Baysoy A, Bai Z, Satija R & Fan R The technological landscape and applications of single-cell multi-omics. Nature Reviews Molecular Cell Biology 24, 695–713 (2023). 10.1038/s41580-023-00615-w - DOI - PMC - PubMed
    1. Zhang D et al. Spatial epigenome-transcriptome co-profiling of mammalian tissues. Nature 616, 113–122 (2023). 10.1038/s41586-023-05795-1 - DOI - PMC - PubMed
    1. Jiang F et al. Simultaneous profiling of spatial gene expression and chromatin accessibility during mouse brain development. Nat Methods 20, 1048–1057 (2023). 10.1038/s41592-023-01884-1 - DOI - PubMed

MeSH terms

LinkOut - more resources