. 2025 Jan 27;87(1):179.
doi: 10.1007/s00248-025-02495-3.

A Multimarker Approach to Identify Microbial Bioindicators for Coral Reef Health Monitoring-Case Study in La Réunion Island

Affiliations

A Multimarker Approach to Identify Microbial Bioindicators for Coral Reef Health Monitoring-Case Study in La Réunion Island

Pierre-Louis Stenger et al. Microb Ecol. .

Abstract

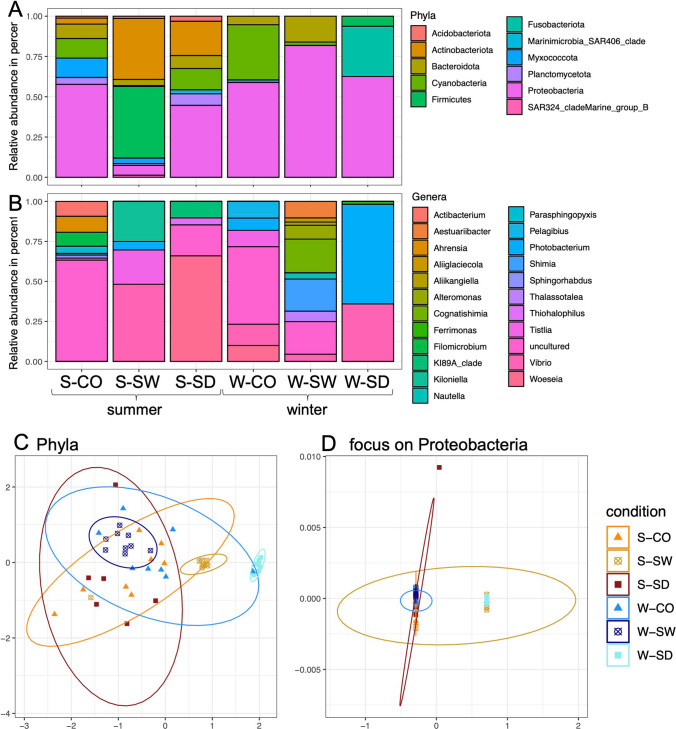
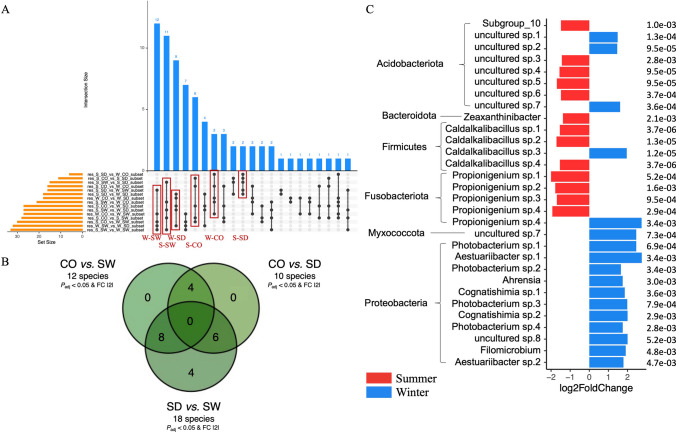
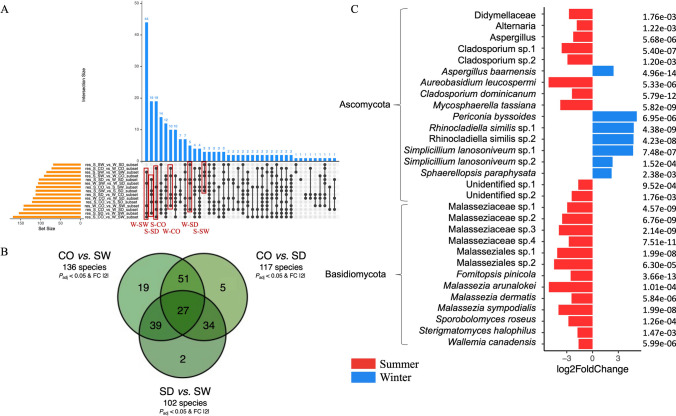
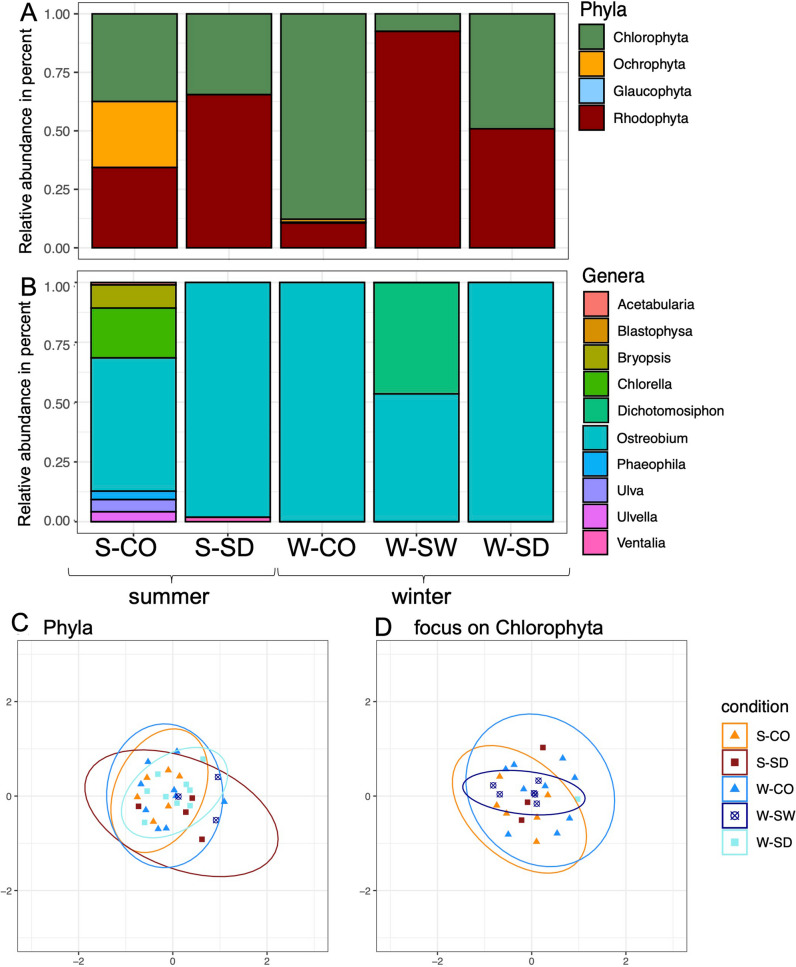
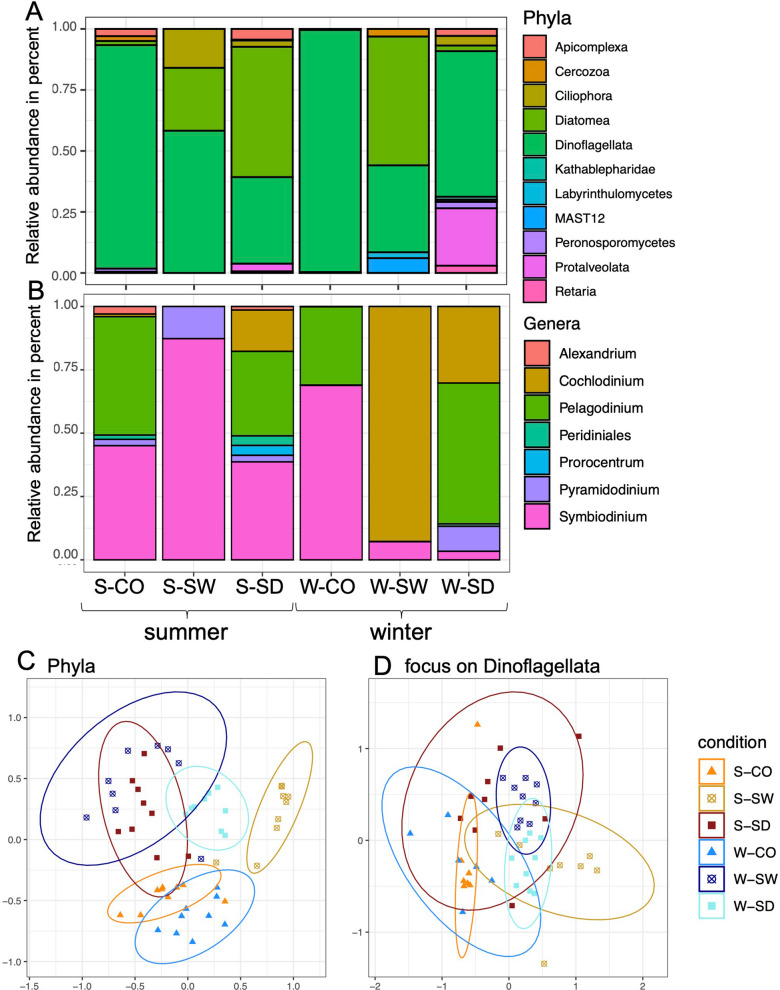
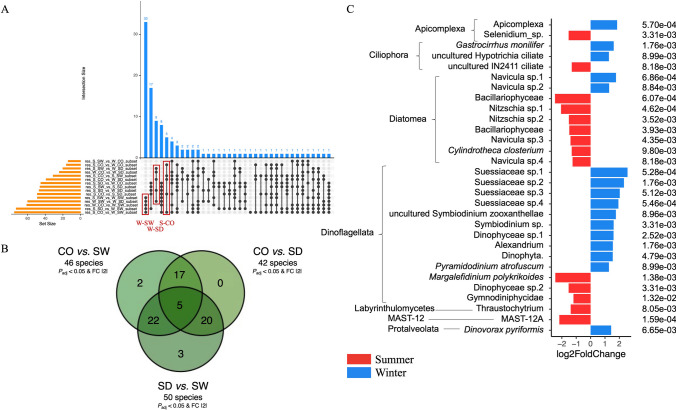
The marine microbiome arouses an increasing interest, aimed at better understanding coral reef biodiversity, coral resilience, and identifying bioindicators of ecosystem health. The present study is a microbiome mining of three environmentally contrasted sites along the Hermitage fringing reef of La Réunion Island (Western Indian Ocean). This mining aims to identify bioindicators of reef health to assist managers in preserving the fringing reefs of La Réunion. The watersheds of the fringing reefs are small, steeply sloped, and are impacted by human activities with significant land use changes and hydrological modifications along the coast and up to mid-altitudes. Sediment, seawater, and coral rubble were sampled in austral summer and winter at each site. For each compartment, bacterial, fungal, microalgal, and protist communities were characterized by high throughput DNA sequencing methodology. Results show that the reef microbiome composition varied greatly with seasons and reef compartments, but variations were different among targeted markers. No significant variation among sites was observed. Relevant bioindicators were highlighted per taxonomic groups such as the Firmicutes:Bacteroidota ratio (8.4%:7.0%), the genera Vibrio (25.2%) and Photobacterium (12.5%) dominating bacteria; the Ascomycota:Basidiomycota ratio (63.1%:36.1%), the genera Aspergillus (40.9%) and Cladosporium (16.2%) dominating fungi; the genus Ostreobium (81.5%) in Chlorophyta taxon for microalgae; and the groups of Dinoflagellata (63.3%) and Diatomea (22.6%) within the protista comprising two dominant genera: Symbiodinium (41.7%) and Pelagodinium (27.8%). This study highlights that the identified bioindicators, mainly in seawater and sediment reef compartments, could be targeted by reef conservation stakeholders to better monitor La Réunion Island's reef state of health and to improve management plans.

Keywords: Bioindicators; Fringing coral reef; La Réunion Island; Microbiome.


Conflict of interest statement

Declarations. Competing Interests: The authors declare no competing interests.

Figures

Fig. 1
Fig. 1
Location map of La Réunion Island in the southwest Indian Ocean close to Madagascar and Mauritius Island, and map of La Réunion Island including the two major cities and the study site location (red rectangle). Location of the three sampling sites (Toboggan, Copacabana, and Livingstone), near l’Hermitage-les-Bains city, on La Réunion Island. The right side shows the three sampling conditions (seawater, coral rubble, and sediment). Landsat satellite image, worldwide map from creative commons, pictures from PLS
Fig. 2
Fig. 2
Bar plot for bacterial communities. A Bacterial phyla relative abundance; B focus on the more abundant phylum Proteobacteria genera relative abundance; C, D NMDS for bacterial phyla communities (D) and focus on the Proteobacteria phylum, the most abundant one (E). S-CO, summer-coral; S-SW, summer-seawater; S-SD, summer-sediment; W-CO, winter-coral; W-SW, winter-seawater; W-SD, winter-sediment
Fig. 3
Fig. 3
Identification of condition-, compartment-, and season-specific ASVs using targeted Bayesian analysis. A Upset plot of the condition-specific bacterial ASVs identified in the six experimental conditions (S-CO, S-SW, S-SD, W-CO, W-SW, and W-SD) (in red) collected from the comparison of comparisons (the common denominator corresponding to the condition sought must be present in five comparisons, and to retrieve these ASVs a comparison of these comparisons must be made) based on the criteria of adjusted P value < 0.05 and Log2FoldChange >|2|. B Compartment-specific ASVs were determined across coral rubble, sediment, and seawater compartments, highlighting bacterial taxa with differential representation (adjusted P value < 0.05 and Log2FoldChange >|2|). C Season-specific ASVs were determined across the austral summer vs. winter revealed comparison highlighting bacterial taxa with differential representation (adjusted P value < 0.05 and Log2FoldChange >|2|). No overlaps with condition-specific ASVs (A) were detected in analyses (B and C). S-CO, summer-coral; S-SW, summer-seawater; S-SD, summer-sediment; W-CO, winter-coral; W-SW, winter-seawater; W-SD, winter-sediment
Fig. 4
Fig. 4
Bar plot for fungal communities. A Fungal phyla relative abundance; B focus on the more abundant phylum Ascomycota genera relative abundance; C, D NMDS for bacterial phyla communities (C) and focus on the Ascomycota phylum, the most abundant one (D). S-CO, summer-coral; S-SW, summer-seawater; S-SD, summer-sediment; W-CO, winter-coral; W-SW, winter-seawater; W-SD, winter-sediment
Fig. 5
Fig. 5
Identification of condition-, compartment-, and season-specific ASVs using targeted Bayesian analysis. A Upset plot of the condition-specific fungal ASVs identified in the six experimental conditions (S-CO, S-SW, S-SD, W-CO, W-SW, and W-SD) (in red) collected from the comparison of comparisons (the common denominator corresponding to the condition sought must be present in five comparisons, and to retrieve these ASVs a comparison of these comparisons must be made) based on the criteria of adjusted P value < 0.05 and Log2FoldChange >|2|. B Compartment-specific ASVs were determined across coral rubble, sediment, and seawater compartments, highlighting fungal taxa with differential representation (adjusted P value < 0.05 and Log2FoldChange >|2|). C Season-specific ASVs were determined across the austral summer vs. winter revealed comparison highlighting fungal taxa with differential representation (adjusted P value < 0.05 and Log2FoldChange >|2|). No overlaps with condition-specific ASVs (A) were detected in analyses (B and C). S-CO, summer-coral; S-SW, summer-seawater; S-SD, summer-sediment; W-CO, winter-coral; W-SW, winter-seawater; W-SD, winter-sediment
Fig. 6
Fig. 6
Bar plot for microalgae communities. A Microalgae phyla relative abundance; B focus on the more abundant phylum Chlorophyta genera relative abundance; C, D NMDS for microalgae phyla communities (C) and focus on the Chlorophyta phylum, the most abundant one (D). S-CO, summer-coral; S-SW, summer-seawater; S-SD, summer-sediment; W-CO, winter-coral; W-SW, winter-seawater; W-SD, winter-sediment
Fig. 7
Fig. 7
Identification of condition-, compartment-, and season-specific ASVs using targeted Bayesian analysis. A Upset plot of the condition-specific microalgae ASVs identified in the six experimental conditions (S-CO, S-SW, S-SD, W-CO, W-SW, and W-SD) based on the criteria of adjusted P value < 0.05 and Log2FoldChange >|2|. B Compartment-specific ASVs were determined across coral rubble, sediment, and seawater compartments, highlighting no taxa with differential representation (adjusted P value < 0.05 and Log2FoldChange >|2|). S-CO, summer-coral; S-SW, summer-seawater; S-SD, summer-sediment; W-CO, winter-coral; W-SW, winter-seawater; W-SD, winter-sediment
Fig. 8
Fig. 8
Bar plot for protista communities. A Protista phyla relative abundance; B focus on the more abundant phylum Dinoflagellata genera relative abundance; C, D: NMDS for protista phyla communities (C) and focus on the Dinoflagellata phylum, the most abundant one (D). S-CO, summer-coral; S-SW, summer-seawater; S-SD, summer-sediment; W-CO, winter-coral; W-SW, winter-seawater; W-SD, winter-sediment
Fig. 9
Fig. 9
Identification of condition-, compartment-, and season-specific ASVs using targeted Bayesian analysis. A Upset plot of the condition-specific Protista ASVs identified in the six experimental conditions (S-CO, S-SW, S-SD, W-CO, W-SW, and W-SD) (in red) collected from the comparison of comparisons (the common denominator corresponding to the condition sought must be present in five comparisons, and to retrieve these ASVs a comparison of these comparisons must be made) based on the criteria of adjusted P value < 0.05 and Log2FoldChange >|2|. B Compartment-specific ASVs were determined across coral rubble, sediment, and seawater compartments, highlighting protista taxa with differential representation (adjusted P value < 0.05 and Log2FoldChange >|2|). C Season-specific ASVs were determined across the austral summer vs. winter revealed comparison highlighting protista taxa with differential representation (adjusted P value < 0.05 and Log2FoldChange >|2|). No overlaps with condition-specific ASVs (A) were detected in analyses (B) and (C). S-CO, summer-coral; S-SW, summer-seawater; S-SD, summer-sediment; W-CO, winter-coral; W-SW, winter-seawater; W-SD, winter-sediment

References

    1. Hoegh-Guldberg O, Poloczanska ES, Skirving W, Dove S (2017) Coral reef ecosystems under climate change and ocean acidification. Front Mar Sci 4. 10.3389/fmars.2017.00158
    1. Sweet M, Burian A, Bulling M (2021) Corals as canaries in the coalmine: towards the incorporation of marine ecosystems into the ‘One Health’ concept. J Invertebr Pathol 186:107538. 10.1016/j.jip.2021.107538 - PubMed
    1. Voolstra CR, Raina JB, Dörr M et al (2024) The coral microbiome in sickness, in health and in a changing world. Nat Rev Microbiol 22:460–475. 10.1038/s41579-024-01015-3 - PubMed
    1. Mohamed AR, Ochsenkühn MA, Kazlak AM et al (2023) The coral microbiome: towards an understanding of the molecular mechanisms of coral-microbiota interactions. FEMS Microbiol Rev 47:1–26. 10.1093/femsre/fuad005 - PMC - PubMed
    1. Roitman S, Joseph Pollock F, Medina M (2018) Coral microbiomes as bioindicators of reef health. 39–57. 10.1007/13836_2018_29

MeSH terms

LinkOut - more resources