. 2025 Jan;533(1):e70023.
doi: 10.1002/cne.70023.

Asymmetries in the Architecture of ON and OFF Arbors in ON-OFF Direction-Selective Ganglion Cells

Affiliations

Asymmetries in the Architecture of ON and OFF Arbors in ON-OFF Direction-Selective Ganglion Cells

Sheba Annie Philip et al. J Comp Neurol. 2025 Jan.

Abstract

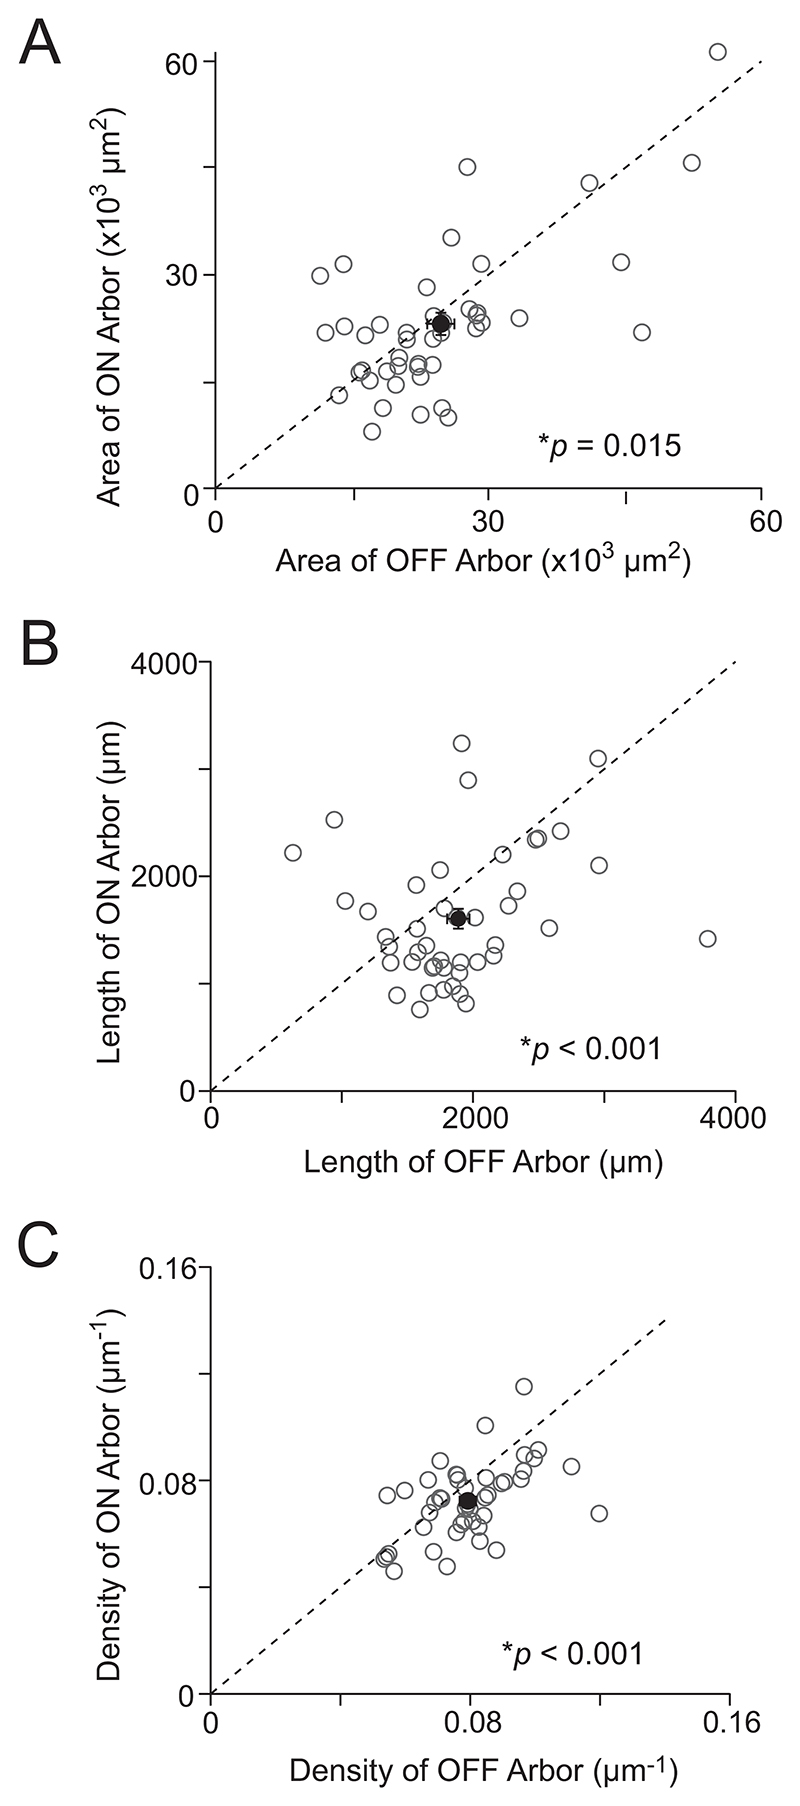
Direction selectivity is a fundamental feature in the visual system. In the retina, direction selectivity is independently computed by ON and OFF circuits. However, the advantages of extracting directional information from these two independent circuits are unclear. To gain insights, we examined the ON-OFF direction-selective ganglion cells (DSGCs), which recombine signals from both circuits. Specifically, we investigated the dendritic architecture of these neurons with the premise that asymmetries in architecture will provide insights into function. Scrutinizing the dendrites of dye-filled ON-OFF DSGCs reveals that the OFF arbors of these neurons are substantially denser. The increase in density can be primarily attributed to the higher branching seen in OFF arbors. Further, analysis of ON-OFF DSGCs in a previously published serial block-face electron microscopy dataset revealed that the denser OFF arbors packed more bipolar synapses per unit dendritic length. These asymmetries in the dendritic architecture suggest that the ON-OFF DSGC preferentially magnifies the synaptic drive of the OFF pathway, potentially allowing it to encode information distinct from the ON pathway.

Keywords: ON–OFF; dendritic architecture; dendritic density; direction selectivity; morphology; retinal ganglion cell; synaptic inputs.


Conflict of interest statement

Conflicts of Interest

The authors declare no conflicts of interest.

Figures

Figure 1
Figure 1. Dendritic morphology of the ON and OFF arbors of ON–OFF DSGCs.
(A) Retinal cross-section illustrating the neuronal cell types involved in the direction-selective circuit. Photoreceptors stimulate bipolar cells (ON/OFF—BCs), which in turn activate downstream starburst amacrine cells (SACs) and direction-selective ganglion cells (DSGCs). DSGCs are of two types: ON DSGCs and ON–OFF DSGCs. ON DSGCs receive connections from ON bipolar cells and ON SACs, while ON–OFF DSGCs form connections with both ON and OFF bipolar cells and SACs. Importantly, the ON and OFF cells stratify at distinct strata of the inner plexiform layer (IPL). (B) Polar plot depicting the spike responses of an ON–OFF DSGC to spots of light moving in eight different directions. The ON and OFF responses are shown in red and blue, respectively. These responses were measured using loose patch recordings in the wholemount retina (see Methods). The total number of spikes generated by each direction is plotted. The radial line indicates the preferred direction of the DSGC, with the length of the line indicating the direction selectivity index (DSI) (see Methods). (C) Top panel shows an image of the dendrites of an ON–OFF DSGC filled with Alexa 488. The middle panel shows the rotated view of the same DSGC’s stratification in the inner plexiform layer. The green trace indicates the fluorescence intensity profile along the IPL depth. The minima between the two peaks was used to separate the ON and OFF arbors. The bottom panel shows the manual tracings of identified ON (red) and OFF (blue) dendrites. Scale bar represents 50 µm. (D, E) Similar to C, but show the ON (D) or OFF (E) dendrites of the DSGC separately.
Figure 2
Figure 2. Reconstruction of ON–OFF DSGC dendrites.
(A) The dendritic trees of six ON–OFF DSGCs are shown here. ON dendrites are labeled in red; OFF dendrites are labeled in blue. The soma is represented by the shaded circle. Note that the thickness of the dendrites is not drawn to scale. (B) The ON dendrites of the corresponding cells shown in A. (C) The OFF dendrites of the corresponding cells shown in A and B. Scale bar represents 50 µm. The reconstructions of all the cells are shown in Supporting Information.
Figure 3
Figure 3. OFF arbor is denser in ON–OFF DSGCs.
(A) Scatter plots comparing the dendritic area of the ON and OFF arbors in DSGCs (n = 44). Open circles indicate individual cells, while the solid circle indicates the population mean. Data represented as mean ± SEM. (B, C) Similar to A, but for dendritic length and dendritic density. *indicates statistical significance when p is less than or equal to 0.05.
Figure 4
Figure 4. OFF arbor has higher branching.
(A) Scatter plots comparing the tortuosity of the ON and OFF arbors in DSGCs. Open circles indicate individual cells, while the solid circle indicates the population mean (n = 44). Data represented as mean ± SEM. (B) Similar to A, but for the number of branch points. *indicates statistical significance when p is less than or equal to 0.05.
Figure 5
Figure 5. ON and OFF arbors have similar substructure.
(A) Illustration of Sholl analysis showing the intersections of dendrites of an OFF arbor (black) with a series of concentric circles (gray). The radius of the circles is 10 µm apart. (B) Distribution of the number of dendritic intersections of ON (black) and OFF (gray) arbors with increasing radial distance from the soma. At peak, the number of intersections in the OFF arbor was significantly greater than the ON arbor (n = 44, p < 0.01; paired t-test). Data represented as mean ± SEM. (C) Cumulative frequency distribution of the data shown in B. Data represented as mean ± SEM. (D) Similar to C, but the values are normalized. Data represented as mean ± SEM. *indicates statistical significance when p is less than or equal to 0.05.
Figure 6
Figure 6. Anatomical reconstruction of bipolar and starburst inputs on ON–OFF DSGC dendrites.
(A) The side-view of dendrites of two ON–OFF DSGCs (gray) reconstructed from a publicly available SBEM volume. Synaptic connections were identified in short 50 µm segments in the ON and OFF dendrites, indicated in green and pink, respectively. The open square indicates the soma. Two of the three DSGCs that were traced are shown here. (B) Top view of the same cells shown in A. (C) A 3D reconstruction of the synaptic connections onto a small 13-µm dendritic section of a DSGC (green) shown in A and B. A bipolar cell terminal is shown in blue, while two putative starburst terminals are shown in red. The black arrows indicate the synaptic sites. (D) An SBEM cross-section showing one of the starburst-DSGC synapses. The green color highlights the DSGC dendrite, and red indicates the presynaptic starburst terminal. The red arrow indicates the location of the synapse. (E) An SBEM cross-section showing a bipolar terminal (blue) forming a dyad with the DSGC dendrite (pink) and a second unidentified post-synaptic partner (yellow). The small red arrow shows the site of the ribbon synapse.
Figure 7
Figure 7. Density of synaptic inputs to ON and OFF dendrites of ON–OFF DSGCs.
(A) Skeletons of ON dendritic segments in ON–OFF DSGCs (each approximately 50 µm), with the location of the bipolar synapses shown in solid black circles. Six dendritic segments were reconstructed from three DSGCs (two segments each). Note that the same segments were analyzed for the bipolar and starburst synapses but were oriented differently to display the synaptic distribution clearly (D, E). (B) Same as A, but for the OFF dendrites. (C) A plot comparing the number of bipolar synapses made by ON and OFF dendrites. The solid black circle represents mean ± SEM (* indicates p = 0.004; unpaired t-tests), while individual dendrites are shown as hollow gray circles. (D–F) Similar to A–C, but for starburst synapses.

Similar articles

References

    1. Amthor FR, Oyster CW, Takahashi ES. Morphology of ON-OFF Direction-Selective Ganglion Cells in the Rabbit Retina. Brain Research. 1984;298:187–190. - PubMed
    1. Amthor FR, Takahashi ES, Oyster CW. Morphologies of Rabbit Retinal Ganglion Cells With Complex Receptive Fields. Journal of Comparative Neurology. 1989;280:97–121. - PubMed
    1. Ariel M, Daw NW. Pharmacological Analysis of Directionally Sensitive Rabbit Retinal Ganglion Cells. Journal of Physiology. 1982;324:161–185. doi: 10.1113/jphysiol.1982.sp014105. - DOI - PMC - PubMed
    1. Baden T, Berens P, Franke K, Román Rosón M, Bethge M, Euler T. The Functional Diversity of Retinal Ganglion Cells in the Mouse. Nature. 2016;529:345–350. doi: 10.1038/nature16468. - DOI - PMC - PubMed
    1. Bae JA, Mu S, Kim JS, et al. Digital Museum of Retinal Ganglion Cells With Dense Anatomy and Physiology. Cell. 2018;173:1293.e19–1306.e19. doi: 10.1016/j.cell.2018.04.040. - DOI - PMC - PubMed

MeSH terms

LinkOut - more resources