

Identification and validation of prognostic biomarkers in ccRCC: immune-stromal score and survival prediction
- PMID: 39871215
- PMCID: PMC11771106
- DOI: 10.1186/s12885-025-13534-0
Identification and validation of prognostic biomarkers in ccRCC: immune-stromal score and survival prediction
Abstract
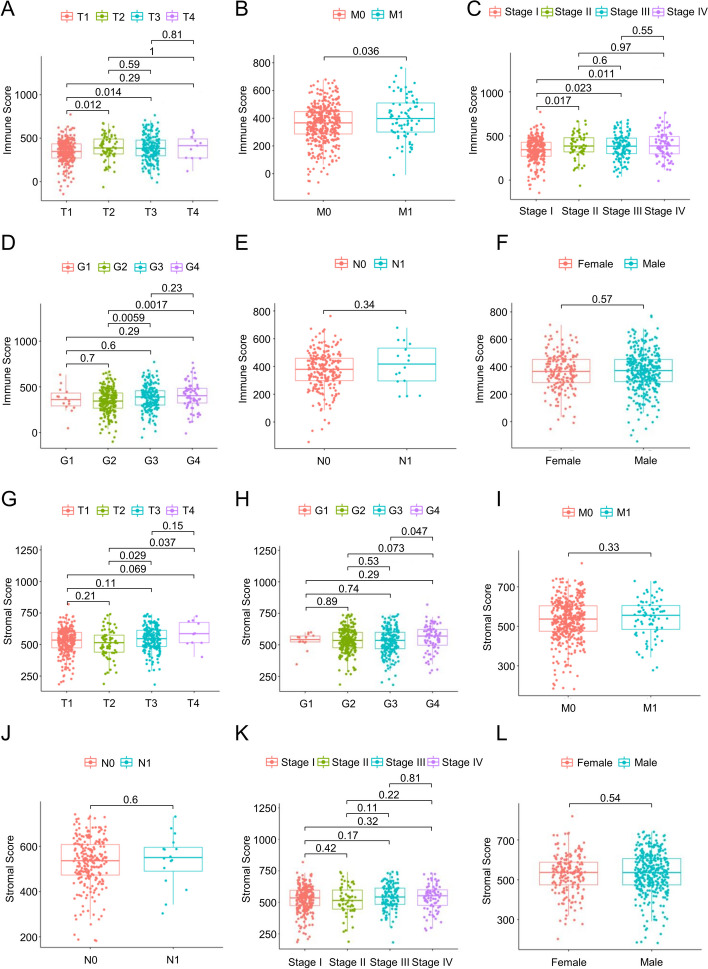
Background: The tumor microenvironment (TME) is integral to tumor progression. However, its prognostic implications and underlying mechanisms in clear cell renal cell carcinoma (ccRCC) are not yet fully elucidated. This study aims to examine the prognostic significance of genes associated with immune-stromal scores and to explore their underlying mechanisms in ccRCC.
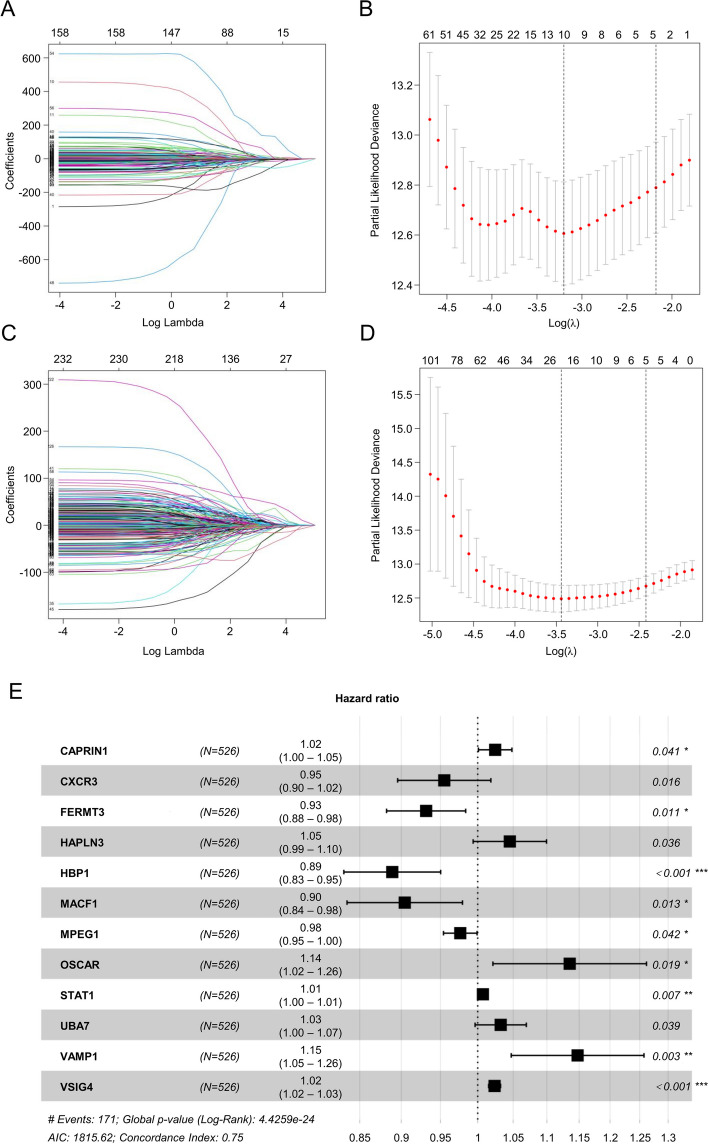
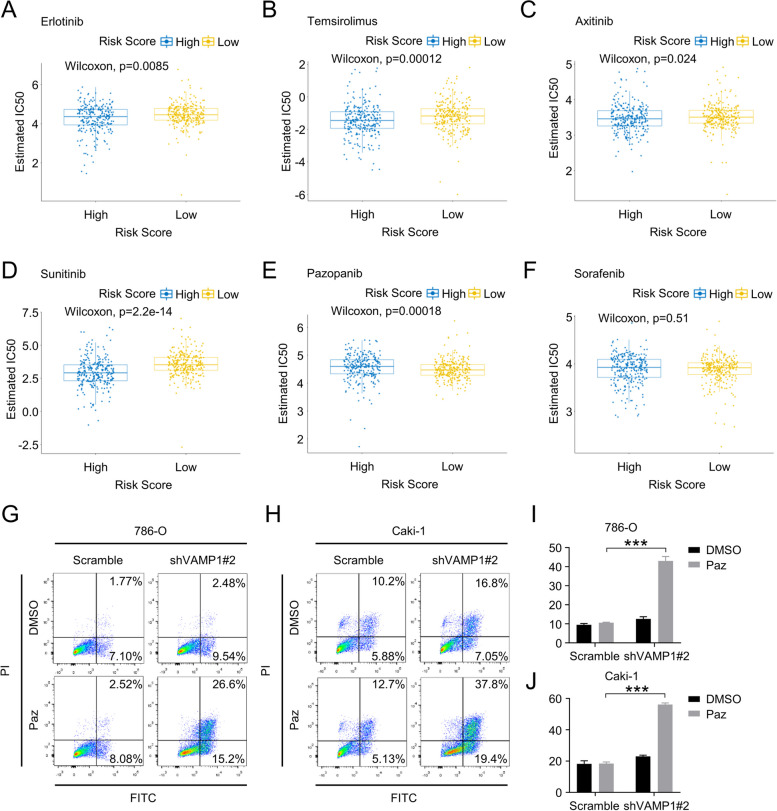
Methods: Data from the Cancer Genome Atlas (TCGA) and International Cancer Genome Consortium (ICGC) were subjected to analysis to compute immune and stromal scores utilizing the ESTIMATE algorithm. The weighted gene co-expression network analysis (WGCNA) was employed to identify gene modules associated with these scores. Differentially expressed genes were assessed using the limma package. Prognostic biomarkers were subsequently identified through univariate, LASSO, and multivariate Cox regression analyses, culminating in the development of a risk score model. Gene expression was confirmed in ccRCC cell lines (786-O, Caki-1) and tumor tissues. Functional assays, such as wound healing and Transwell assays, were employed to evaluate tumor invasion and migration. The prognostic accuracy was assessed through ROC curve analysis, and a nomogram integrating risk scores with clinical variables was constructed. Analyses of immune infiltration, human leukocyte antigen (HLA) expression, immune checkpoint expression, immunophenoscore (IPS), tumor immune dysfunction and exclusion (TIDE) scores, and responses to six targeted therapies were conducted across different risk groups.
Results: Twelve critical prognostic markers, including CAPRIN1, CXCR3, FERMT3, HAPLN3, HBP1, MACF1, MPEG1, OSCAR, STAT1, UBA7, VAMP1, and VSIG4, were identified. The risk score model exhibited a high degree of predictive accuracy for survival outcomes in ccRCC. Immune profiling revealed significant differences in the TME between risk groups, with high-risk patients displaying elevated expression of HLA and immune checkpoints. Drug sensitivity analyses suggested that high-risk patients had a better response to erlotinib, temsirolimus, axitinib, and sunitinib, whereas low-risk patients demonstrated greater sensitivity to pazopanib. Variability in immunotherapy responsiveness between groups was observed based on IPS and TIDE analyses.
Conclusion: This study highlights the prognostic value and TME-related mechanisms of immune-stromal score signatures in ccRCC, developing a risk score model and nomogram for predicting patient prognosis.
Keywords: Clear cell renal cell carcinoma; Immune score; Prognosis; Risk score; Stromal score.
© 2025. The Author(s).
Conflict of interest statement
Declarations. Ethics approval and consent to participate: This study was approved by the Ethics Committee of Union Hospital of Huazhong University of Science and Technology (Batch number: 2023 − 147). (The name and affiliation of the ethics committee that approved this study: Ethics Committee of Union Hospital of Huazhong University of Science and Technology, No. 2023 − 147). The patient’s written informed consent was obtained for publication. Competing interests: The authors declare no competing interests.
Figures


Similar articles
-
A novel glycogene-related signature for prognostic prediction and immune microenvironment assessment in kidney renal clear cell carcinoma.Ann Med. 2025 Dec;57(1):2495762. doi: 10.1080/07853890.2025.2495762. Epub 2025 May 7. Ann Med. 2025. PMID: 40329678 Free PMC article.
-
Deciphering potential molecular mechanisms in clear cell renal cell carcinoma based on the ubiquitin-conjugating enzyme E2 related genes: Identifying UBE2C correlates to infiltration of regulatory T cells.Biofactors. 2025 Jan-Feb;51(1):e2143. doi: 10.1002/biof.2143. Epub 2024 Nov 29. Biofactors. 2025. PMID: 39614426
-
Comprehensive insights on pivotal prognostic signature involved in clear cell renal cell carcinoma microenvironment using the ESTIMATE algorithm.Cancer Med. 2020 Jun;9(12):4310-4323. doi: 10.1002/cam4.2983. Epub 2020 Apr 20. Cancer Med. 2020. PMID: 32311223 Free PMC article.
-
Biomarker-informed care for patients with renal cell carcinoma.Nat Cancer. 2025 Apr;6(4):573-583. doi: 10.1038/s43018-025-00942-1. Epub 2025 Apr 16. Nat Cancer. 2025. PMID: 40240621 Review.
-
Persisting challenges in the development of predictive biomarkers for immuno-oncology therapies for renal cell carcinoma.Expert Rev Anticancer Ther. 2025 Feb;25(2):97-103. doi: 10.1080/14737140.2025.2457373. Epub 2025 Jan 23. Expert Rev Anticancer Ther. 2025. PMID: 39835433 Review.
Cited by
-
Integrative Analysis of Immune- and Metabolism-Related Genes Identifies Robust Prognostic Signature and PYCR1 as a Carcinogenic Regulator in Clear Cell Renal Cell Carcinoma.Int J Mol Sci. 2025 May 21;26(10):4953. doi: 10.3390/ijms26104953. Int J Mol Sci. 2025. PMID: 40430095 Free PMC article.
-
Identification and Experimental Validation of Prognostic Signature and Peroxisome-Related Key Genes in Clear Cell Renal Cell Carcinoma.Int J Gen Med. 2025 May 23;18:2687-2702. doi: 10.2147/IJGM.S513102. eCollection 2025. Int J Gen Med. 2025. PMID: 40433044 Free PMC article.
-
Regulatory T cells and matrix-producing cancer associated fibroblasts contribute on the immune resistance and progression of prognosis related tumor subtypes in ccRCC.Sci Rep. 2025 Jul 1;15(1):20533. doi: 10.1038/s41598-025-06051-4. Sci Rep. 2025. PMID: 40596367 Free PMC article.
References
-
- Ljungberg B, Bensalah K, Canfield S, Dabestani S, Hofmann F, Hora M, et al. EAU Guidelines on renal cell carcinoma: 2014 update. Eur Urol. 2015;67(5):913–24. - PubMed
-
- Choueiri TK, Motzer RJ. Systemic therapy for metastatic renal-cell carcinoma. N Engl J Med. 2017;376(4):354–66. - PubMed
-
- Ljungberg B, Campbell SC, Cho HY, Jacqmin D, Lee JE, Weikert S, et al. The epidemiology of renal cell carcinoma. Eur Urol. 2011;60(4):615–21. - PubMed
Publication types
MeSH terms
Substances
Grants and funding
LinkOut - more resources
Full Text Sources
Medical
Research Materials
Miscellaneous
