. 2025 Jan 27;25(1):25.
doi: 10.1186/s12935-025-03656-7.

DLAT is involved in ovarian cancer progression by modulating lipid metabolism through the JAK2/STAT5A/SREBP1 signaling pathway

Affiliations

DLAT is involved in ovarian cancer progression by modulating lipid metabolism through the JAK2/STAT5A/SREBP1 signaling pathway

Hui Wang et al. Cancer Cell Int. .

Abstract

Background: Ovarian cancer (OC) remains a lethal gynecological malignancy with an alarming mortality rate, primarily attributed to delayed diagnosis and a lack of effective treatment modalities. Accumulated evidence highlights the pivotal role of reprogrammed lipid metabolism in fueling OC progression, however, the intricate underlying molecular mechanisms are not fully elucidated.

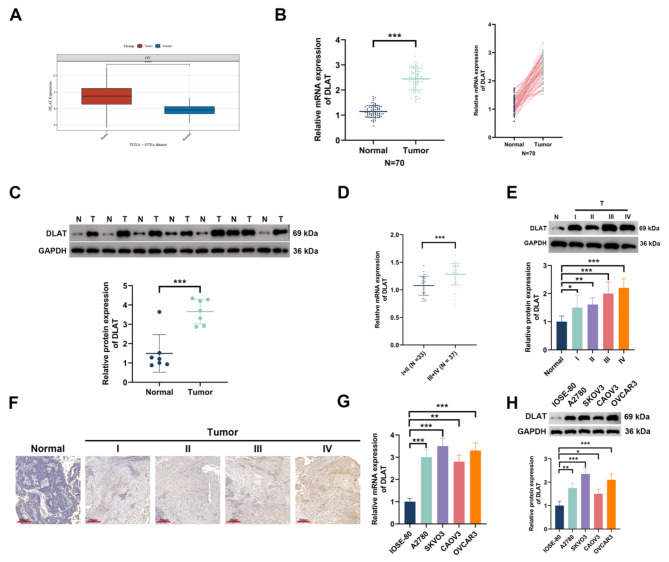
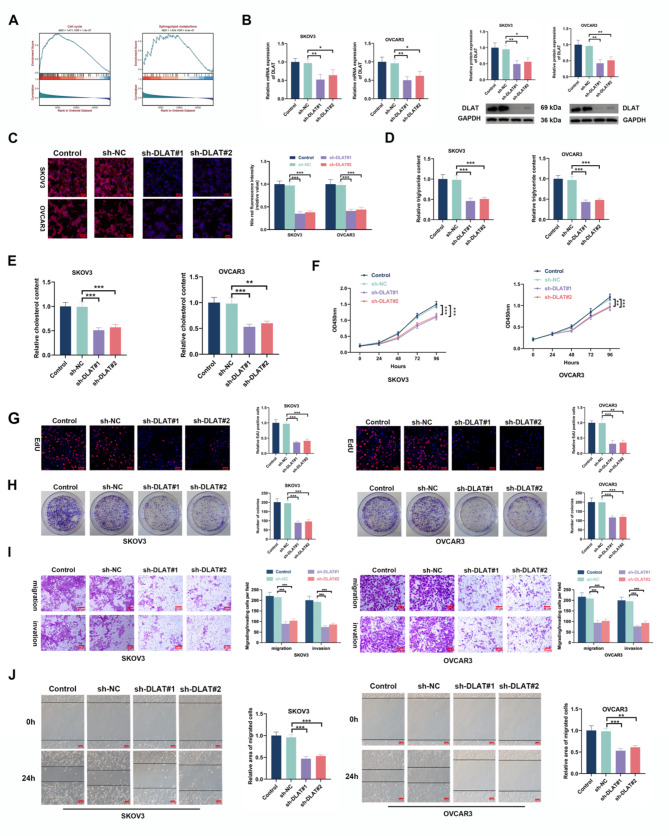
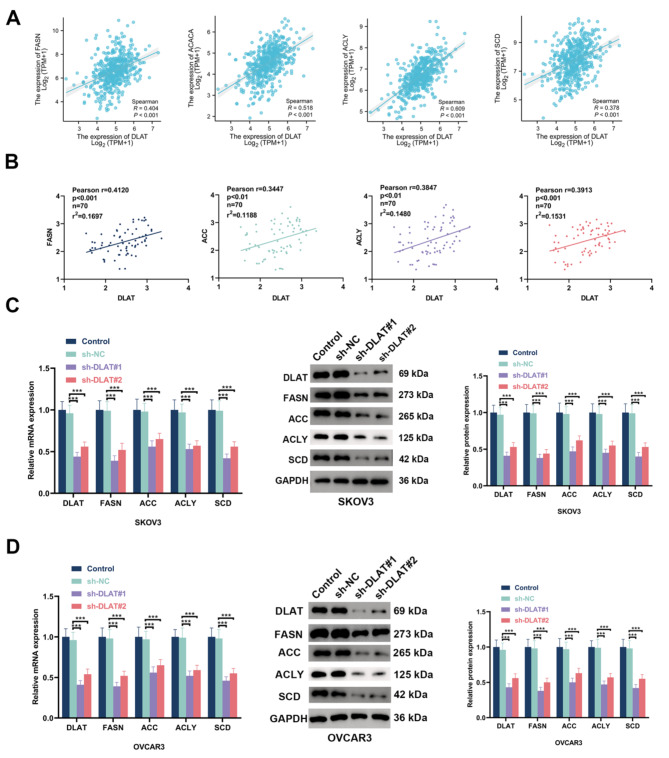
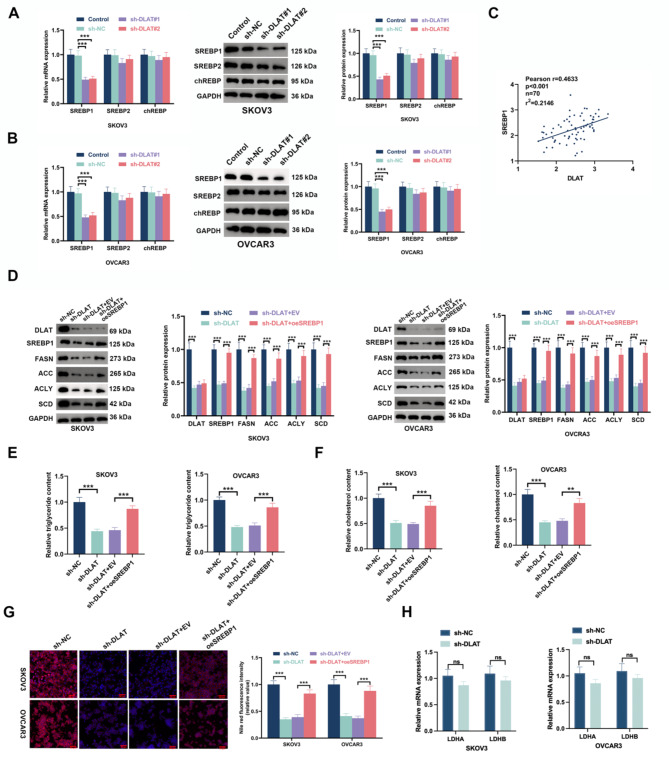
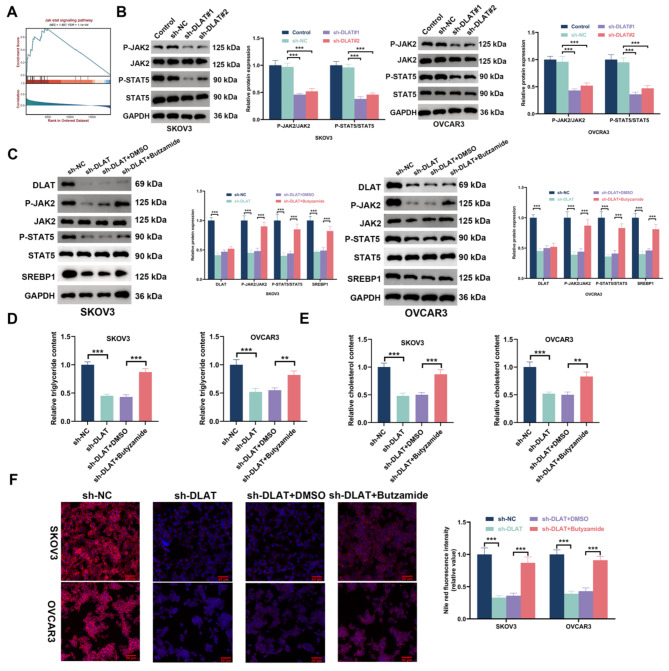
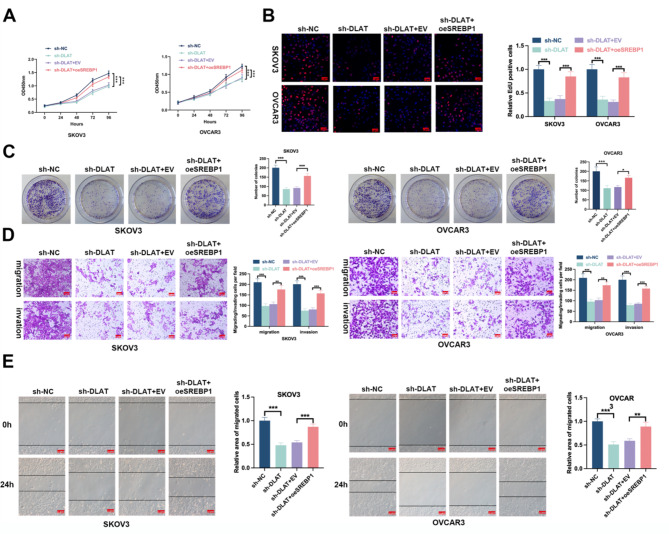
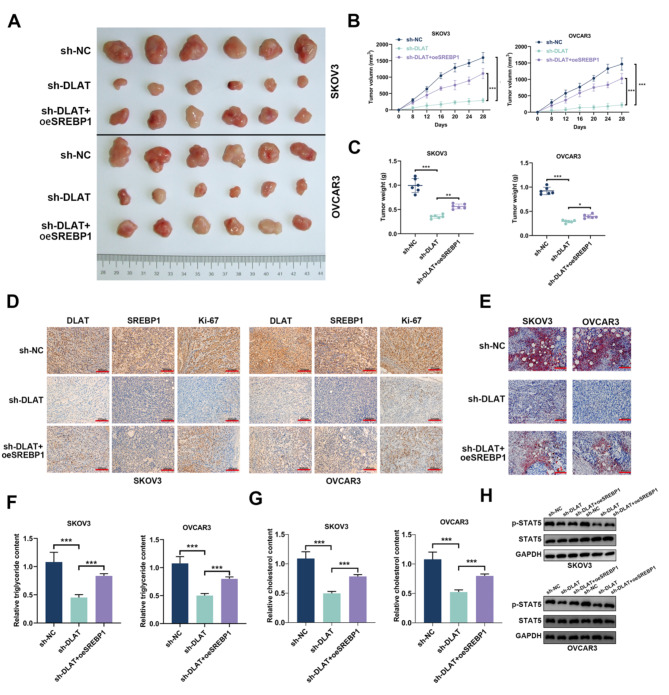
Methods: DLAT expression was assessed in OC tissues and cell lines by immunohistochemistry, western blot and qRT-PCR analysis. The effects of DLAT silencing on changes in lipid metabolism, cell viability, migration, and invasion were examined in SKOV3 and OVCAR3 cells using CCK-8, colony formation, Transwell migration and invasion, and wound-healing assays. GSEA analysis was used to examine the relationship between DLAT and lipid metabolism-related enzymes. Rescue experiments in which SREBP1 was overexpressed in DLAT-silenced cells were carried out. Western blot analysis was performed to determine whether the JAK2/STAT5 signaling pathway was involved in DLAT-regulated SREBP1 expression. Commercially available triglyceride and cholesterol detection kits, as well as Nile Red and Oil red O staining were used to measure lipid metabolism. A subcutaneous tumor model was established in BALB/c mice to confirm the role of the DLAT/SREBP1 axis in OC growth and metastasis in vivo.

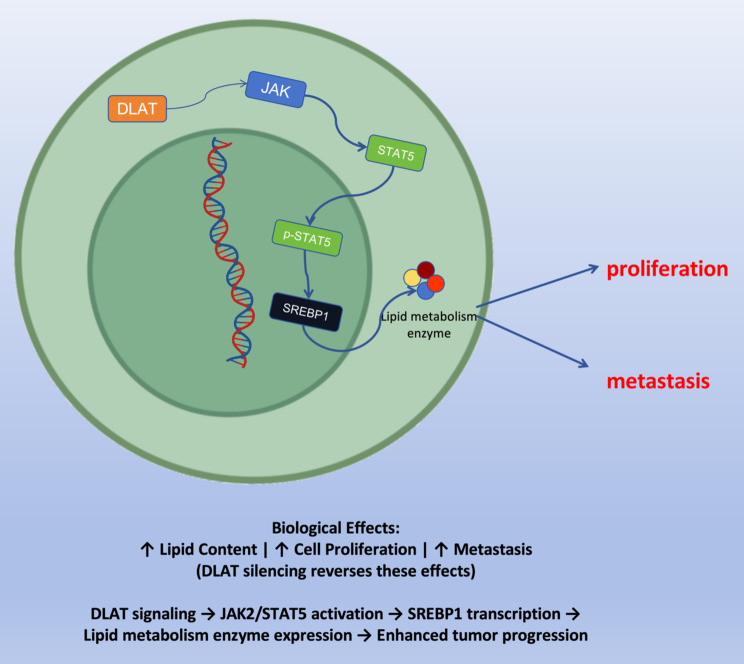
Results: DLAT expression was significantly upregulated in OC patient tissue and associated with poor prognosis. Silencing DLAT reduced lipid content and impaired OC cell proliferation, migration, and invasion. DLAT upregulated SREBP1 expression via the JAK2/STAT5 signaling pathway, enhancing expression of fatty acid synthesis enzymes and altering lipid metabolism. SREBP1 was essential for DLAT-dependent OC cell growth and metastasis both in vitro and in vivo.

Conclusion: This study uncovers a novel DLAT/JAK2/STAT5/SREBP1 axis that reprograms lipid metabolism in OC, providing insights into metabolic vulnerabilities and potential therapeutic targets for OC treatment.

Keywords: DLAT; JAK2/STAT5 signaling; Lipid metabolism; Ovarian cancer; SREBP1.


Conflict of interest statement

Declarations. Ethics approval and consent to participate: This study was approved by the Ethics Committee of Obstetrics & Gynecology Hospital of Fudan University. All patients provided written informed consent prior to participation in the study. The study was conducted in accordance with the Declaration of Helsinki and followed the relevant institutional and national guidelines. All animal experiments were performed following protocols approved by the Institutional Animal Care and Use Committee of Obstetrics & Gynecology Hospital of Fudan University. Competing interests: The authors declare no competing interests.

Figures

Fig. 1
Fig. 1
DLAT is upregulated in OC patient tissue and OC cells and is associated with poor clinical outcomes. (A) Analysis of OC patient tissue data from the TCGA and GTEx databases revealed upregulation of DLAT mRNA expression levels in OC tumor tissues (n = 376) compared with normal tissues (n = 180) by box plot. (B) qRT-PCR analysis of DLAT mRNA expression levels in 70 paired normal and OC tumor tissue samples. (C) Western blot analysis of DLAT protein expression levels in 7 paired normal and OC tumor tissue samples. (D) qRT-PCR analysis was used to compare DLAT mRNA expression levels in patients with OC stages I-II and OC stages III–IV. (E) Western blot analysis of DLAT protein expression levels in 5 paired normal and OC tumor tissue samples with OC stages I–IV. (F) Representative IHC images showing DLAT staining in 5 paired normal and OC tumor tissue samples with OC stages I–IV. Scale bar = 200 μm. (G) qRT-PCR analysis of DLAT mRNA expression levels in normal human ovarian epithelial cells (IOSE-80) and OC cells (A2780, SKOV3, OVCAR3, and CAOV3), n = 3. (H) Western blot analysis of DLAT protein expression levels in IOSE-80 and OC tumor cells, n = 3. Data are presented as the mean ± SD. ***P < 0.001, **P < 0.01, and *P < 0.05
Fig. 2
Fig. 2
DLAT silencing significantly reduces lipid content in OC cells and impairs OC cell proliferation and metastasis in vitro. (A) GSEA analysis of TCGA ovarian cancer dataset showing positive correlation between DLAT expression and ‘Cell Cycle’ and ‘Sphingolipid Metabolism’ gene signatures. (B) qRT-PCR and western blot analysis were used to confirm the transfection efficiency of two specific DLAT shRNAs (sh-DLAT#1 and sh-DLAT#2) in SKOV3 or OVCAR3 cells. (C-J) SKOV3 or OVCAR3 cells were transduced using sh-NC, sh-DLAT#1, or sh-DLAT#2 lentiviruses. Cells that were not transduced with lentivirus were used as controls. (C) Nile Red staining was used to measure cellular neutral lipids. Nuclei were stained with Hoechst. Scale bar = 50 μm. (D) Triglyceride levels were measured using a commercially available kit. Values were normalized to cellular proteins. Data are presented as mean ± SD and are representative of three independent experiments. (E) Cellular cholesterol content was measured using a commercially available kit. (F) Cell proliferation was assessed using the CCK-8 assay. (G) The EdU assay was used to assess cellular proliferation. Scale bar = 50 μm. (H) The colony formation assay was used to assess colony formation. (I) Transwell migration and invasion assays were used to assess the migratory and invasive abilities of cells. (J) The wound-healing migration assay was used to assess the effects of DLAT knockdown on cellular migration. Scale bar = 100 μm. Data are presented as the mean ± SD, n = 3. Statistical significance was determined by comparing each experimental group to the sh-NC control group. ***P < 0.001, **P < 0.01, and *P < 0.05
Fig. 3
Fig. 3
DLAT increases the expression of lipid metabolism-related enzymes in OC cells. (A) Correlation analysis between DLAT expression and the expression of lipid metabolism-related enzymes (FASN, ACLY, ACC1, and SCD1) in ovarian cancer patients from the TCGA database. (B) Scatter plot analysis showing the correlation between the mRNA expression levels of DLAT and lipid metabolism-related enzymes in 70 paired normal and OC tumor tissues. (C, D) qRT-PCR and western blot analysis were used to examine the effects of DLAT knockdown on the mRNA and protein expression levels of lipid metabolism-related enzymes in SKOV3 or OVCAR3 cells transduced with sh-NC, sh-DLAT#1, or sh-DLAT#2 lentiviruses. SKOV3 or OVCAR3 cells that were not transduced with lentivirus were used as controls. GAPDH was used as a loading control. Statistical significance was determined by comparing each experimental group to the sh-NC control group. Data are presented as the mean ± SD, n = 3. ***P < 0.001
Fig. 4
Fig. 4
DLAT enhances FASN expression by upregulating SREBP1. (A-B) The effects of DLAT knockdown on SREBP1, SREBP2, and chREBP mRNA and protein expression levels were examined in OC cells by qRT-PCR and western blot analysis, respectively. SKOV3 or OVCAR3 cells were transduced with sh-NC, sh-DLAT#1, or sh-DLAT#2 lentiviruses. Cells not transduced with lentivirus were used as controls. GAPDH was selected as the internal control. (C) Scatter plot analysis showing the correlation between DLAT and SREBP1 mRNA expression levels in 70 OC tissues. (D-G) SKOV3 or OVCAR3 cells were divided into the following treatment groups: sh-NC, sh-DLAT, sh-DLAT + EV (empty vector) and sh-DLAT + oeSREBP1. (D) Western blot analysis of SREBP1, ACLY, FASN, ACC, and SCD protein expression levels in the indicated treatment groups. GAPDH was used as a loading control. (E-F) Cellular contents of triglyceride (E) and cholesterol (F) were measured in the indicated cells. (G) Nile Red staining was used to measure cellular neutral lipids in the indicated cells. Nuclei were stained with Hoescht (blue). Scale bar = 50 μm. (H) qRT-PCR analysis of LDHA and LDHB mRNA expression levels in SKOV3 and OVCAR3 cells with indicated treatments. Data are presented as the mean ± SD, n = 3. For statistical analysis, comparisons were made between two specific groups: (1) sh-NC versus sh-DLAT to evaluate the effects of DLAT knockdown, and (2) sh-DLAT + EV versus sh-DLAT + oeSREBP1 to assess the rescue effects of SREBP1 overexpression. Ns, no significance, ***P < 0.001, and **P < 0.01
Fig. 5
Fig. 5
DLAT upregulates SREBP1 expression and affects lipid metabolism through the JAK2/STAT5 signaling pathway in OC cells. (A) GSEA analysis of TCGA ovarian cancer dataset showing positive correlation between DLAT expression and the JAK-STAT signaling pathway. (B) Western blot analysis was used to examine changes in key JAK2/STAT5 signaling molecules (p-JAK2, p-STAT5, JAK2 and STAT5) in DLAT-silenced SKOV3 or OVCAR3 cells. Non-transduced SKOV3 or OVCAR3 cells were used as the controls. (C-F) DLAT-silenced SKOV3 or OVCAR3 cells were treated with the JAK2/STAT5 activator Butyzamide (3 µM) for 24 h. (C) Western blot analysis of p-JAK2, p-STAT5, JAK2, STAT5 and SREBP1 expression levels. (D-E) Triglyceride (D) and cholesterol (E) contents were determined in the indicated cells. (F) Nile Red staining was used to assess cellular neutral lipids. Nuclei were stained with Hoechst (blue). Scale bar = 50 μm. Data are presented as the mean ± SD, n = 3. Statistical comparisons were made between sh-NC versus sh-DLAT groups, and between sh-DLAT + DMSO versus sh-DLAT + Butyzamide groups. ***P < 0.001 and **P < 0.01
Fig. 6
Fig. 6
SREBP1 is critical for DLAT-mediated OC cell growth and metastasis in vitro. SKOV3 or OVCAR3 cells were divided into the following treatment groups: sh-NC, sh-DLAT, sh-DLAT + EV (empty vector), and sh-DLAT + oeSREBP1. (A) The CCK-8 assay was used to assess the proliferative ability of cells in the indicated treatment groups. (B) The EdU assay was used to determine the proliferative ability of the indicated cells. Scale bar = 50 μm. (C) The colony formation assay was used to examine the proliferative ability of the indicated cells. (D) Transwell migration and invasion assays were used to determine the migratory and invasive abilities of the indicated cells. Scale bar = 50 μm. (E) The wound-healing migration assay was used to determine the migratory ability of the indicated cells. Scale bar = 100 μm. Data are presented as the mean ± SD, n = 3. Statistical comparisons were made between sh-NC versus sh-DLAT groups, and between sh-DLAT + EV versus sh-DLAT + oeSREBP1 groups. ***P < 0.001, **P < 0.01, and *P < 0.05
Fig. 7
Fig. 7
DLAT promotes OC cell growth and metastasis by regulating lipid metabolism through modulation of SREBP1 in vivo. In vivo subcutaneous tumor models were established by injecting mice with sh-NC-, sh-DLAT- or sh-DLAT + oeSREBP1-treated SKOV3 or OVCAR3 cells. (A-C) Representative images showing resected subcutaneous tumors from indicated SKOV3 or OVCAR3 cell-injected groups in nude mice (A), n = 6. Tumor growth rates and weights were measured (B, C). (D) IHC staining of DLAT, Ki-67 and SREBP1 in tumor tissue sections from the various treatment groups. Scale bar = 200 μm. (E) Oil red O staining was used to measure neutral lipids in tumor tissue sections from the various treatment groups. Scale bar = 200 μm, n = 5. (F) Triglyceride levels were measured in tumor tissue sections from the various treatment groups, n = 5. (G) Cholesterol levels were assessed in tumor tissue sections from the various treatment groups, n = 5. (H) Western blot analysis of p-STAT5 and STAT5 expression in xenograft tumor tissues derived from SKOV3 and OVCAR3 cells with indicated treatments (sh-NC, sh-DLAT, or sh-DLAT + oeSREBP1), n = 2. Data are presented as the mean ± SD. ***P < 0.001, **P < 0.01, and *P < 0.05
Fig. 8
Fig. 8
DLAT promotes ovarian cancer progression via JAK2/STAT5/SREBP1-mediated lipid metabolism. Schematic diagram showing the mechanism of DLAT in promoting ovarian cancer progression. In ovarian cancer cells, DLAT activates JAK2/STAT5 signaling pathway, leading to STAT5 phosphorylation and nuclear translocation. Nuclear p-STAT5 promotes SREBP1 transcription. Subsequently, SREBP1 enhances the expression of lipid metabolism-related enzymes (including FASN, ACC, ACLY, and SCD). The activation of this pathway results in increased lipid synthesis, ultimately promoting ovarian cancer cell proliferation and metastasis. Conversely, DLAT silencing suppresses this signaling cascade, reduces cellular lipid content, and impairs tumor progression

Similar articles

References

    1. Webb PM, Jordan SJ. Global epidemiology of epithelial ovarian cancer. Nat Reviews Clin Oncol. 2024;21(5):389–400. - PubMed
    1. Siegel RL, Miller KD, Wagle NS, Jemal A. Cancer statistics, 2023. Cancer J Clin. 2023;73(1):17–48. - PubMed
    1. Saman S, Srivastava N, Yasir M, Chauhan I. A Comprehensive Review on Current treatments and challenges involved in the treatment of Ovarian Cancer. Curr Cancer Drug Targets. 2024;24(2):142–66. - PubMed
    1. Wilson EM, Eskander RN, Binder PS. Recent therapeutic advances in Gynecologic Oncology: a review. Cancers 2024;16(4). - PMC - PubMed
    1. Satora M, Kułak K, Zaremba B, Grunwald A, Świechowska-Starek P, Tarkowski R. New hopes and promises in the treatment of ovarian cancer focusing on targeted treatment-a narrative review. Front Pharmacol. 2024;15:1416555. - PMC - PubMed

LinkOut - more resources