

Polarization optical coherence tomography optoretinography: verifying light-induced photoreceptor outer segment shrinkage and subretinal space expansion
- PMID: 39872019
- PMCID: PMC11770343
- DOI: 10.1117/1.NPh.12.1.015005
Polarization optical coherence tomography optoretinography: verifying light-induced photoreceptor outer segment shrinkage and subretinal space expansion
Abstract
Significance: Stimulus-evoked intrinsic optical signal (IOS) changes in retinal photoreceptors are critical for functional optoretinography (ORG). Optical coherence tomography (OCT), with its depth-resolved imaging capability, has been actively explored for IOS imaging of retinal photoreceptors. However, recent OCT studies have reported conflicting results regarding light-induced changes in the photoreceptor outer segments (OSs), with both elongation and shrinkage being observed. These discrepancies may stem from the difficulty in reliably identifying OS boundaries, particularly the inner segment/outer segment (IS/OS) junction and OS tip, as well as potential confusion with subretinal space dynamics. Gaining a better understanding of these light-induced OS changes is essential for accurate interpretation of ORG measurements and for optimizing IOS imaging systems to enhance sensitivity.
Aim: We aim to develop a method for the reliable identification of OS boundaries and to verify light-induced photoreceptor OS shrinkage and subretinal space expansion.
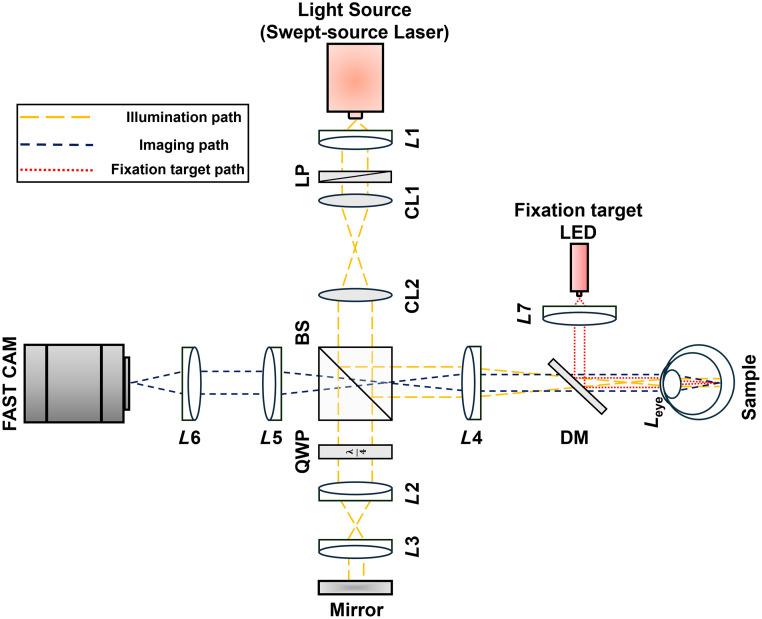
Approach: We employed a polarization-resolved full-field swept-source optical coherence tomography system capable of sequentially capturing parallel-polarization and cross-polarization OCT signals. The parallel-polarization mode is optimized to detect ballistically reflected photons from well-defined retinal boundaries, such as the IS/OS junction and the photoreceptor tips, whereas cross-polarization primarily captures multiply scattered photons. This differentiation enables parallel-polarization OCT to minimize the interference from scattered photons, enhancing the precision of OCT band quantification.
Results: Parallel-polarization OCT revealed photoreceptor OS shrinkage and subretinal space expansion in light conditions compared with dark conditions. Moreover, the overall outer retinal length appeared to swell under light. These observations were consistently confirmed in four healthy adult human subjects.
Conclusions: Parallel-polarization OCT provides a reliable method for identifying the IS/OS junction and OS tip, confirming light-induced photoreceptor OS shrinkage and subretinal space expansion.
Keywords: intrinsic optical signal; optical coherence tomography; optoretinography; photoreceptor; polarization; retina.
© 2025 The Authors.
Figures
Similar articles
-
Polarization-resolved analysis of outer retinal bands: investigating ballistic and multiply scattered photons using full-field swept-source optical coherence tomography.Biomed Opt Express. 2024 Jul 18;15(8):4749-4763. doi: 10.1364/BOE.523202. eCollection 2024 Aug 1. Biomed Opt Express. 2024. PMID: 39346986 Free PMC article.
-
In vivo optoretinography of phototransduction activation and energy metabolism in retinal photoreceptors.J Biophotonics. 2021 May;14(5):e202000462. doi: 10.1002/jbio.202000462. Epub 2021 Feb 18. J Biophotonics. 2021. PMID: 33547871 Free PMC article.
-
Functional optical coherence tomography enables in vivo optoretinography of photoreceptor dysfunction due to retinal degeneration.Biomed Opt Express. 2020 Aug 27;11(9):5306-5320. doi: 10.1364/BOE.399334. eCollection 2020 Sep 1. Biomed Opt Express. 2020. PMID: 33014616 Free PMC article.
-
Interpretation of anatomic correlates of outer retinal bands in optical coherence tomography.Exp Biol Med (Maywood). 2021 Oct;246(20):2140-2150. doi: 10.1177/15353702211022674. Epub 2021 Jun 10. Exp Biol Med (Maywood). 2021. PMID: 34111984 Free PMC article. Review.
-
Functional Optical Coherence Tomography for Intrinsic Signal Optoretinography: Recent Developments and Deployment Challenges.Front Med (Lausanne). 2022 Apr 4;9:864824. doi: 10.3389/fmed.2022.864824. eCollection 2022. Front Med (Lausanne). 2022. PMID: 35445037 Free PMC article. Review.
References
-
- Curcio C. A., et al. , “Photoreceptor loss in age-related macular degeneration,” Investig. Ophthalmol. Vis. Sci. 37(7), 1236–1249 (1996).IOVSDA - PubMed
Grants and funding
LinkOut - more resources
Full Text Sources
