. 2023 Apr 11;2(2):lnad015.
doi: 10.1093/lifemedi/lnad015. eCollection 2023 Apr.

Restoring carboxypeptidase E rescues BDNF maturation and neurogenesis in aged brains

Affiliations

Restoring carboxypeptidase E rescues BDNF maturation and neurogenesis in aged brains

Hongmei Liu et al. Life Med. .

Abstract

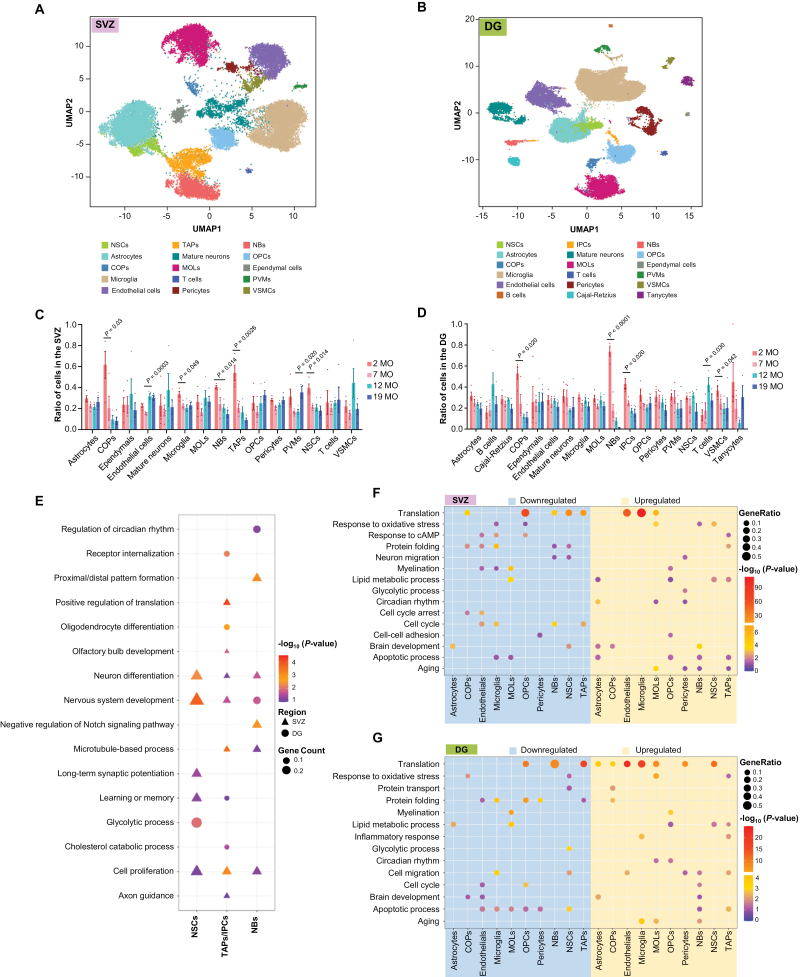
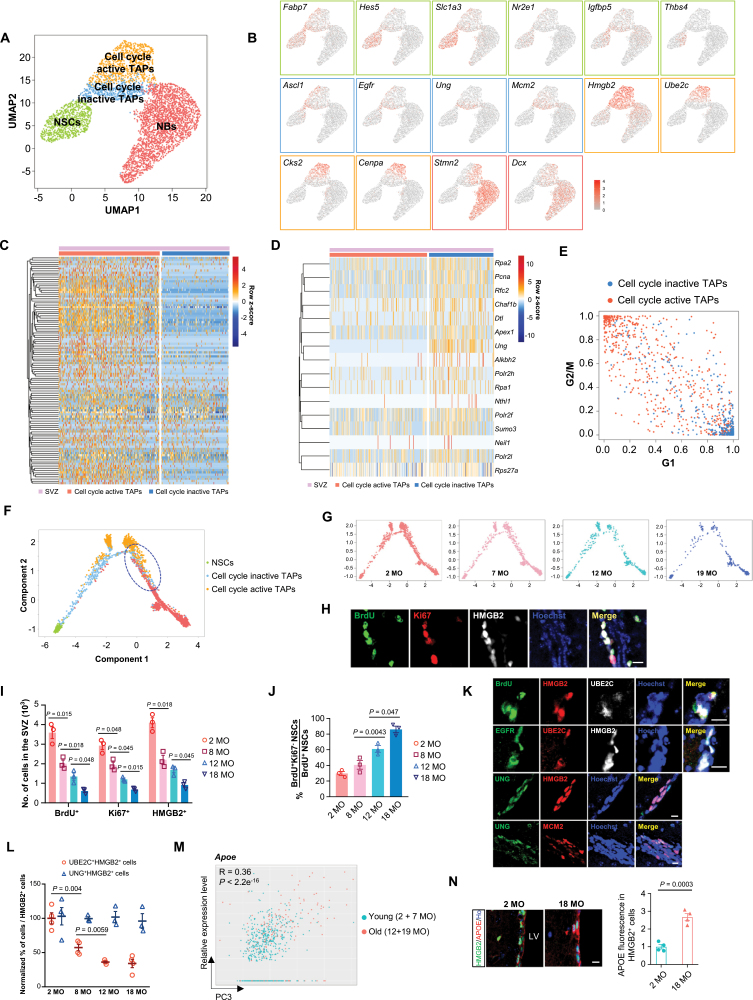
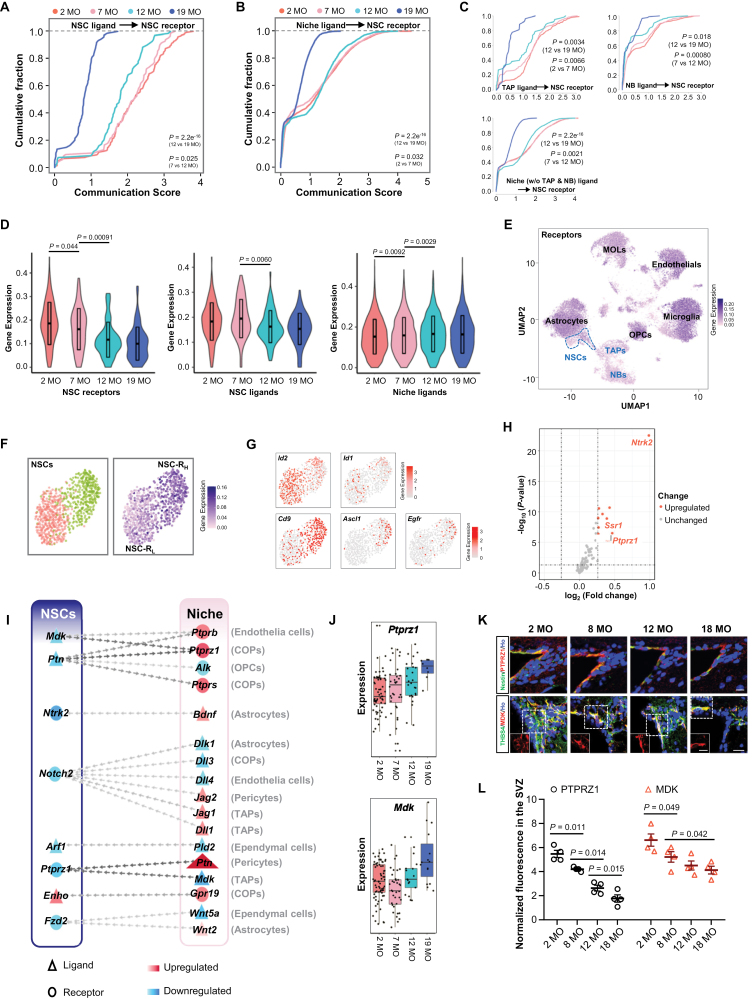
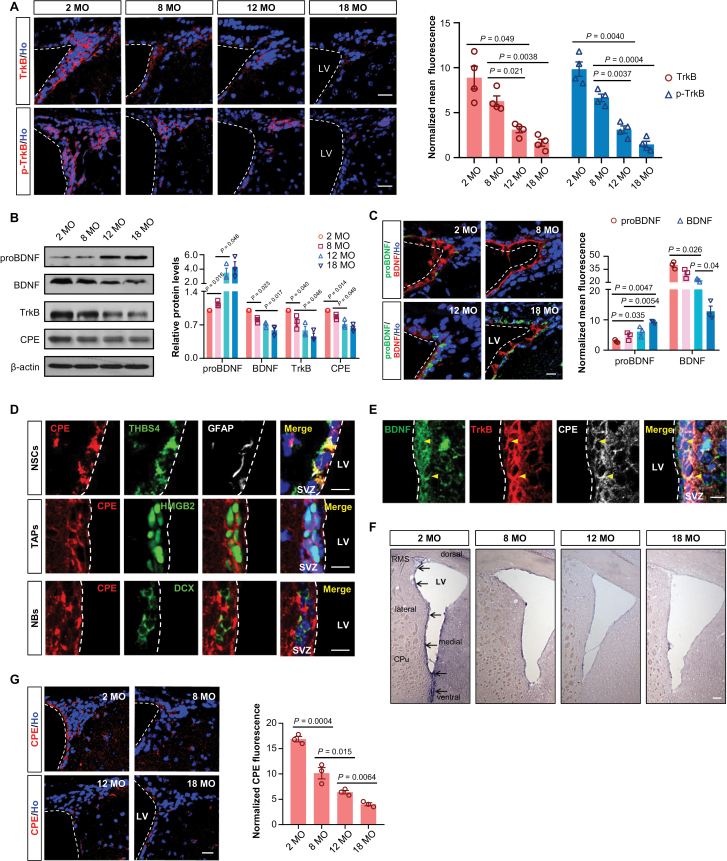
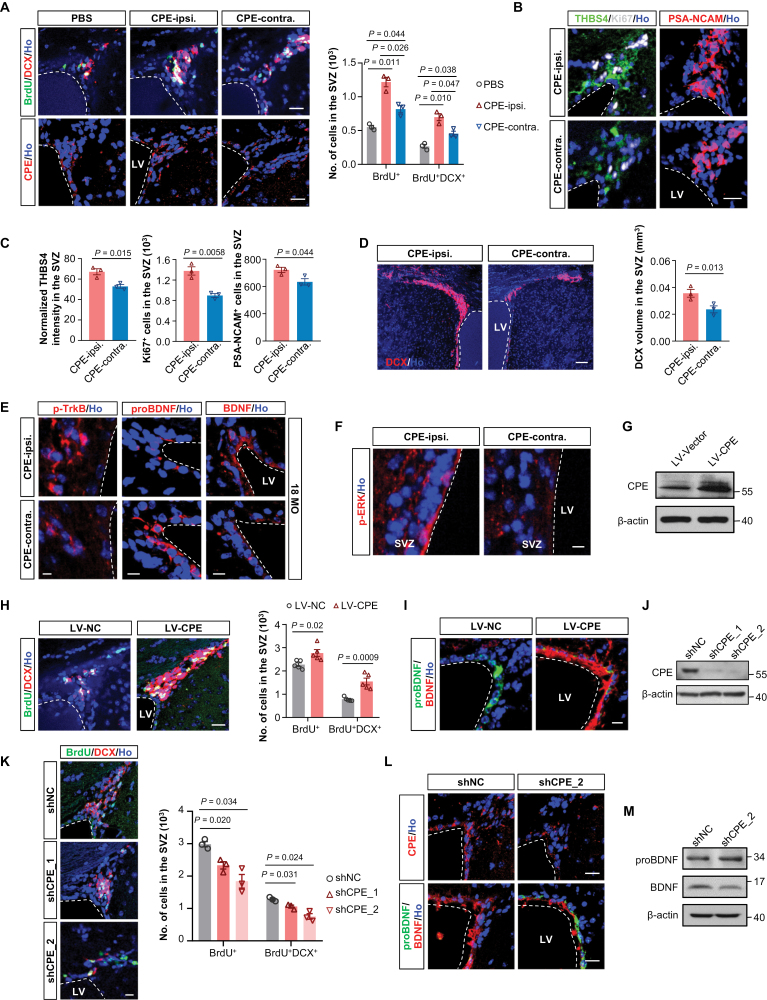
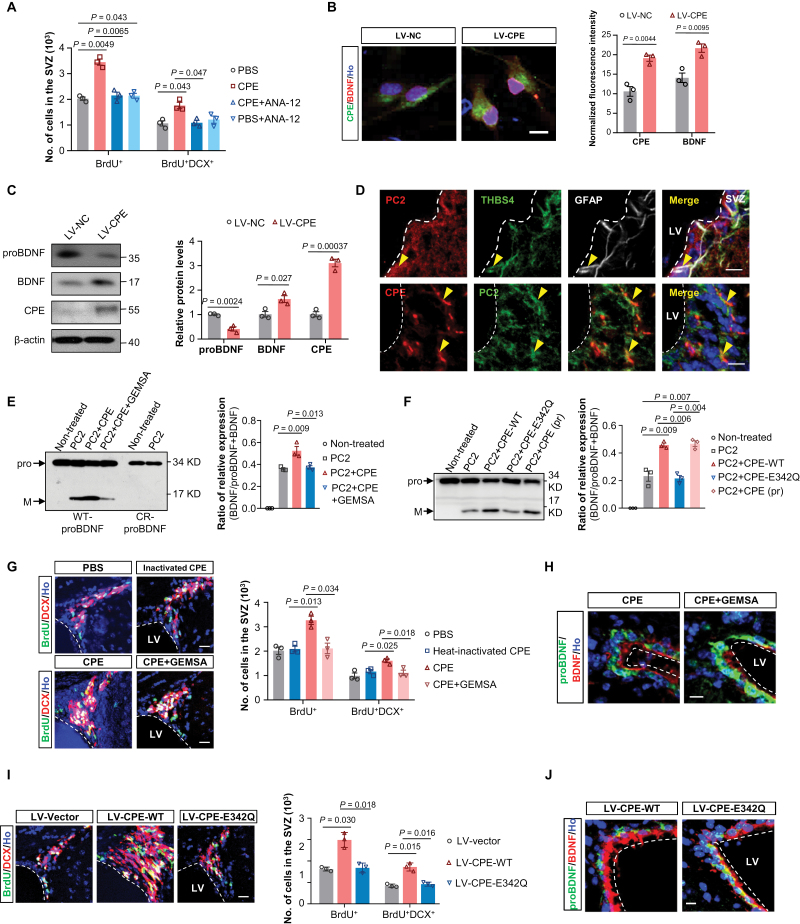
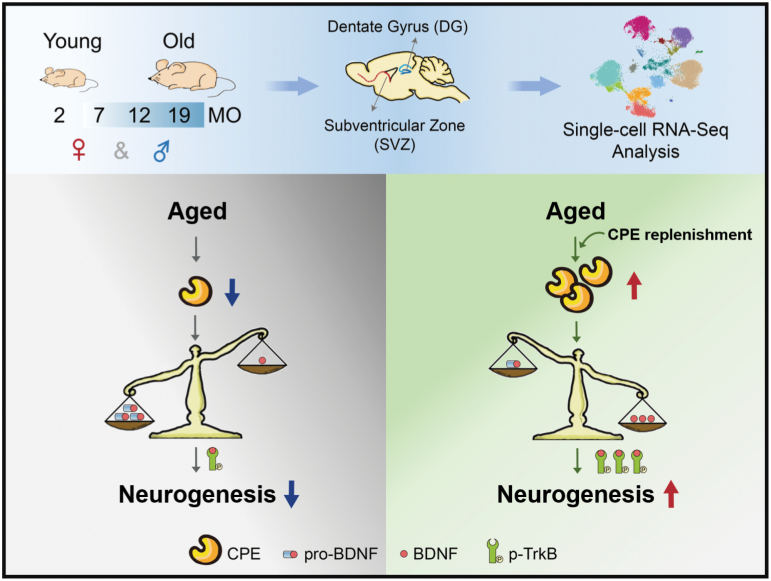
Adult neurogenesis declines with age due to the less functional neural stem cells (NSCs) and niches, but the underlying molecular bases for this impaired condition remain unclear. Here we analyzed >55,000 single-cell transcriptomes from two discrete neurogenic niches across the mouse lifespan, and identified new features and populations in NSCs, new markers, and neurogenic regional-specific alternations during aging. Intercellular communication analysis revealed defects in brain-derived neurotrophic factor (BDNF)-TrkB signaling cascade in old NSCs. Carboxypeptidase E (CPE) was found to be highly enriched in NSCs, and played a crucial role in mature/proBDNF balance and adult neurogenesis. Diminishment of CPE with aging resulted in impaired generation of BDNF, thus limiting the neurogenesis in old neurogenic niches. Restoring CPE expression markedly rescued the adult neurogenesis by increasing the production of mature BDNF, offering an attractive therapeutic strategy for the treatment of certain disorders in regions associated with constitutive neurogenesis.

Keywords: BDNF; adult neurogenesis; aging; carboxypeptidase E.


Conflict of interest statement

The authors declare no competing interests.

Figures

Figure 1.
Figure 1.
Profiling and comparison of mouse single-cell atlases of different ages, and brain regions. (A and B) UMAP plot of the entire SVZ dataset (A, 8 samples, n = 28,543 cells, dataset A) and DG dataset (B, 8 samples, n = 26,623 cells, dataset A). Cells are colored by different cell types. SVZ, subventricular zone; DG, dentate gyrus; NSCs, quiescent neural stem cells; TAPs, transient amplifying progenitors; NBs, neuroblasts; OPCs, oligodendrocyte progenitor cells; COPs, differentiation-committed oligodendrocyte precursors; MOLs, mature oligodendrocytes; PVMs, perivascular macrophages; VSMCs, vascular smooth muscle cells; IPCs, intermediate progenitor cells. (C and D) For each cell type, bar plot shows the proportion of cells in 16 samples of SVZ (C) and DG (D). Combined analysis of dataset A and B. n = four mice each group. P values are indicated (one-way ANOVA). (E) Representative GO terms of DEGs of stem cells between SVZ and DG. (F) GO enrichment analysis with DAVID for the DEGs of each cluster in the SVZ between 2 MO and 19 MO. (G) GO Enrichment analysis with DAVID for the DEGs of each cluster in the DG between 2 MO and 19 MO.
Figure 2.
Figure 2.
Classification of cell cycle active and inactive TAPs. (A) UMAP plot of the NSCs, TAPs, and NBs in the SVZ from dataset A. (B) UMAP visualization of (A) colored by the expression of representative stem cell marker genes. Different color indicates different markers used to identify each cell type. Green: NSCs; blue: cell cycle inactive TAPs; orange: cell cycle active TAPs; red: NBs. (C and D) Heatmap plot for expression of cell cycle-related genes (C) and DNA damage repair-related genes (D) in cell cycle active and inactive TAPs. (E) Cell cycle status (G1 phase and G2/M phase) inference of the cell cycle active and inactive TAPs. (F) Pseudotime trajectory of stem cells in the SVZ colored by different cell types. TAPs at the stage of transition to NBs are circled with blue dashed line. (G) Pseudotime trajectory of stem cells in the SVZ colored by different ages. (H) Immunostaining for BrdU, Ki67, and HMGB2 in the SVZ of 2 MO WT mice. Scale bar, 20 µm. (I) Reduction of TAPs during aging. Quantification of total number of BrdU+, Ki67+, and HMGB2+ cells in the SVZ of 2, 8, 12, and 18 MO mice. Data are represented as mean ± S.E.M. n = three mice per age. P values are indicated (one-way ANOVA). (J) Quantification of the fraction of proliferating NSCs that exit the cell cycles (BrdU+Ki67-/BrdU+) in the SVZ of 2, 8, 12, and 18 MO mice. Data are represented as mean ± S.E.M. n = three mice per age. P values are indicated (one-way ANOVA). (K) Representative images of co-staining for UBE2C with BrdU, HMGB2, and EGFR (top two panels) and for UNG with HMGB2 and MCM2 (lower two panels) in the adult SVZ. Scale bars, 10 µm. (L) Quantification of the percentages of UBE2C+HMGB2+ and UNG+HMGB2+ cells out of all HMGB2+ cells in the SVZ at 2, 8, 12, and 18 MO mice. Data are represented as mean ± S.E.M. n = three to four mice per group. P values are indicated (one-way ANOVA). (M) Scatter plots showing the relative expression level of one of the top upregulated aging-associated DEG, APOE, in NSCs along PC3 dimension. Each point indicates a single cell. Pearson’s correlation coefficient (R) and statistical significance (P) are indicated. (N) Representative images of co-staining for APOE with HMGB2 in the TAPs of adult SVZ from 2 MO and 18 MO mice. Ho, Hoechst. Scale bar, 10 µm. Quantification of APOE fluorescence intensity in HMGB2+ cells normalized to the SVZ area is shown on the right panel. Data are represented as mean ± S.E.M. n = four mice each group. P value is indicated (two-tailed t-test).
Figure 3.
Figure 3.
Cell-to-cell communication analysis and ligand/receptor influences calculation in the SVZ. (A) Cumulative fraction of each NSC in the SVZ according to global communication scores between NSC ligands and NSC receptors. (B) Cumulative fraction of each niche cell (including TAP, NB, and other cell types in the SVZ) in the SVZ according to global communication scores between niche ligands and NSC receptors. (C) Cumulative fraction of each TAP/NB/niche cell without TAP and NB in the SVZ according to global communication scores between niche ligands and NSC receptors. (D) Violin plots with data in TPM showing ligands/receptors expression levels for each age. The expression of receptors/ligands in each cell at each age (two mice at each age) was used. Ligands are those correspond to receptors expressed by NSCs. Data are represented as mean ± S.D. P values are indicated (one-way ANOVA). (E) Expression plot of receptors involved in ligand-receptor interactions over the UMAP map to assess ligand-receptor interaction prevalence in the SVZ. Outlined region indicates the NSC cluster. (F) Analysis about heterogeneity of NSCs in the SVZ based on the receptor expressions. Subclustering analysis using unsupervised hierarchical clustering of NSCs revealed two subclusters (left). UMAP plot of NSCs showing the expression of receptors involved in ligand-receptor interactions (right). (G) UMAP visualization of (F) colored by the expression of NSC quiescence-related marker genes (Id2 and Id1) and genes involved in activation of qNSCs (Cd9, Ascl1, and Egfr). NSC-RH show higher expression of activation markers. (H) Volcano plot of differentially expressed receptor genes between NSC-RH and NSC-RL in the SVZ. Top leading significant receptors are labeled by gene names. (I) Aging-related changes in intercellular communication in the SVZ. Triangles and ellipses indicate ligands and receptors, respectively. The differentially expressed ligands and receptors in NSCs (left column) and the corresponding receptors or ligands in the niche (right column) are listed on columns. Dot colors means the fold change of each gene, while red for up-regulated genes in 19 MO and blue for down-regulated in 19 MO. Ligands and receptors that interact are lined by a chain of arrows, the color of which means the nMI of the given ligand and receptor. The exact niche cell types that interact with NSCs for each ligand or receptor were shown on the right. (J) Boxplot for the expression of Ptprz1 and Mdk in the NSCs of the SVZ that do express the gene at each age group. (K) Representative images of co-staining for PTPRZ1/MDK with NSC markers (THBS4 and Nestin) in the NSCs of adult SVZ from mice at 2, 8, 12, and 18 MO. Ho, Hoechst. Scale bars, 20 µm. (L) Normalized PTPRZ1 and MDK fluorescence intensity in the SVZ of mice at 2, 8, 12, and 18 MO, respectively. Data are represented as mean ± S.E.M. Each dot represents mean normalized protein fluorescence in three sections from one mouse. n = four mice each age. P values are indicated (one-way ANOVA).
Figure 4.
Figure 4.
Aging causes deficiency of BDNF-TrkB pathway and defect in CPE in the SVZ. (A) Representative images (left) and normalized fluorescence intensity (right) of TrkB and p-TrkB in the SVZ of mice at 2, 8, 12, and 18 MO. Ho, Hoechst. Scale bars, 20 µm. Data are represented as mean ± S.E.M. n = four mice each age. (B) Western blotting analyses (left) and relative quantification of expression level (right) of proteins extracted from the mixed tissues of SVZ from three mice at each age. β-actin is used as a loading control. Data are represented as the mean protein intensity normalized to β-actin ± S.E.M. n = three mice each age. (C) Representative images (left) and normalized fluorescence intensity (right) of proBDNF and BDNF expression in the SVZ of mice at 2, 8, 12, and 18 MO. Scale bars, 20 µm. Data are represented as mean ± S.E.M. n = three mice each age. (D) Characterization of CPE-positive NSCs (THBS4+GFAP+, top panel), TAPs (HMGB2+, middle panel), and NBs (DCX+, bottom panel) in the SVZ of 2 MO mice. Scale bars, 20 µm. (E) Representative picture of co-staining for BDNF, TrkB, and CPE in the SVZ. Scale bars, 10 μm. Yellow arrowheads indicate TrkB+CPE+BDNF+ cells. (F) In situ hybridization analysis of CPE mRNA in the SVZ of mice at 2, 8, 12, and 18 MO. Arrows indicate positive signals. Scale bars, 100 µm. RMS, rostral migratory stream; LV, lateral ventricles; Cpu, caudate putamen. (G) Representative images of CPE expression (Left) and its normalized fluorescence intensity (Right) in the SVZ of mice at 2, 8, 12, and 18 MO. Scale bars, 20 µm. Data are represented as mean ± S.E.M. n = three mice each age. P values are indicated (one-way ANOVA).
Figure 5.
Figure 5.
CPE promotes the adult SVZ neurogenesis through the BDNF-TrkB signaling pathway. (A) Left, representative images of BrdU and DCX double-labelled newly generated neurons (top panel) or CPE staining (bottom panel) in the SVZ of 18 MO mice one week after PBS or CPE infusion. Ho, Hoechst. Scale bars, 10 µm. ipsi., ipsilateral, the injection side; contra., side contralateral to CPE injection. Quantification of BrdU+ and BrdU+DCX+ cells in the SVZ was shown on the right. Data are represented as mean ± S.E.M. n = three mice per group. P values are indicated (one-way ANOVA). (B) Images of THBS4 (radial glia-like and projenitor cells marker, left panel), Ki67 (proliferating cells marker, left panel), and PSA-NCAM (immature neuron marker, right panel) expression demonstrate increased proliferation and neuronal differentiation in the ipsilateral SVZ compared with contralateral SVZ from 18 MO mice one week after CPE infusion. Scale bars, 20 µm. (C) Normalized THBS4 fluorescence intensity and quantification of numbers of Ki67+ and PSA-NCAM+ cells in (B). Data are represented as mean ± S.E.M. n = three mice per group. P values are indicated (two-tailed t-test). (D) DCX volume is significantly increased in the ipsilateral SVZ compared with contralateral SVZ from 18 MO mice one week after CPE infusion. Scale bars, 100 µm. Quantification of the DCX volume was shown on the right panel. Data are represented as mean ± S.E.M. n = three mice per group. P values are indicated (two-tailed Student's t test). (E and F) Representative images of p-TrkB, proBDNF, and BDNF (E) and p-ERK (F) expression in the ipsilateral SVZ compared with contralateral SVZ from 18 MO mice one week after CPE infusion. Scale bars, 10 µm. (G) Western blotting analysis of CPE expression levels in the SVZ of mice injected with lentiviruses expressing NC (LV-NC) or wild-type CPE (LV-CPE). β-actin is used as a loading control. (H) Left, Representative images of BrdU and DCX double-labelled newly generated neurons in the SVZ of mice with grafted LV-NC or LV-CPE. Quantification of the number of BrdU+ and BrdU+DCX+ cells was shown on the right. Data are represented as mean ± S.E.M. n = five mice each group. P values are indicated (two-tailed t-test). (I) Representative images of proBDNF and BDNF expression in the SVZ with grafted lentivirus expressing LV-NC or LV-CPE. Scale bars, 10 µm. (J) Western blot analysis of the efficacy of the shRNA against mouse CPE in N2a cells. β-actin is used as a loading control. (K) Left, Representative images of BrdU and DCX double-labelled newly generated neurons in the SVZ of middle-aged mice injected with lentiviruses expressing shNC, shCPE_1, or shCPE_2. Quantification of the number of BrdU+ and BrdU+DCX+ cells in the SVZ was shown on the right. Data are represented as mean ± S.E.M. n = three mice each group. P values are indicated (one-way ANOVA). (L) Representative images of CPE, proBDNF, and BDNF expression in the SVZ of mice injected with lentiviruses expressing shNC or shCPE_2. Scale bars, 10 µm. (M) Western blotting analyses of proteins extracted from the mixed tissues of SVZ from three mice injected with lentiviruses expressing shNC or shCPE_2. β-actin is used as a loading control.
Figure 6.
Figure 6.
CPE upregulates BDNF levels through promoting the cleavage efficiency of convertases in NSCs. (A) Quantification of BrdU+ and BrdU+DCX+ cells in the SVZ of PBS- or CPE-infused mice with or without the TrkB antagonist ANA-12 treatment. Data are represented as mean ± S.E.M. n = three mice each group. P values are indicated (one-way ANOVA). (B) Representative immunofluorescence images of primary NSCs stained with CPE and BDNF and Hoechst after LV-NC/CPE infection at adherent conditions. Ho, Hoechst. Scale bar, 10 μm. Normalized CPE and BDNF fluorescence intensity was shown on the right. Data are represented as mean ± S.E.M. n = three independent experiments. P values are indicated (Student’s t test). (C) Western blotting analyses of proteins extracted from the primary NSCs 48 h after LV-NC or LV-CPE infection. β-actin is used as a loading control. Relative quantification of Western blotting analysis of protein levels was shown on the right. Data is represented as the mean protein intensity normalized to actin ± S.E.M. from three independent experiments. P values are indicated (two-tailed t-test). (D) Representative image of co-staining for PC2, THBS4, and GFAP (top panel) in the SVZ and for colocalization of CPE and PC2 (bottom panel) in NSCs in the SVZ. Scale bars, 10 μm. Yellow arrowheads indicate PC2+THBS4+GFAP+ or CPE+PC2+ cells. (E) Western blotting analyses (left) and relative quantification of the fraction of BDNF/(proBDNF + BDNF) (right) by incubating commercial recombinant wild-type proBDNF (WT-proBDNF) or cleavage-resistant proBDNF (CR-proBDNF) with PC2, CPE, and GEMSA in vitro. Bar graphs represent the mean ± SEM from three independent assays. P values are indicated (one-way ANOVA). (F) Western blotting analyses (left) and relative quantification of the fraction of BDNF/(proBDNF + BDNF) (right) by incubating commercial recombinant proBDNF with PC2, recombinant CPE-WT, recombinant CPE-E342Q or commercial CPE protein (CPE pr) in vitro. Bar graphs represent the mean ± SEM from three independent assays. P values are indicated (one-way ANOVA). (G) Left, Representative images of BrdU and DCX double-labelled newly generated neurons in the SVZ of PBS-, heat-inactivated CPE-(top panel), or native CPE-infused mice with or without GEMSA treatment (bottom panel). Quantification of BrdU+ and BrdU+DCX+ cells in the SVZ was shown on the right. Data are represented as mean ± S.E.M. n = three mice each group. P values are indicated (one-way ANOVA). (H) Representative images of proBDNF and BDNF expression in the SVZ of CPE-infused mice with or without GEMSA. Scale bar, 10 μm. (I) Left, representative images of BrdU and DCX double-labelled newly generated neurons in the SVZ of mice with grafted LV-vector, LV-CPE-WT, or LV-CPE-E342Q. Quantification of BrdU+ and BrdU+DCX+ cells in the SVZ was shown on the right. Data are represented as mean ± S.E.M. n = three mice each group. P values are indicated (one-way ANOVA). (J) Representative images of proBDNF and BDNF expression in the SVZ of mice with grafted LV-CPE-WT and LV-CPE-E342Q. Scale bar, 10 μm.
Figure 7.
Figure 7.
Graphical summary. Comprehensive single-cell transcriptomic analyses of SVZ and DG identifies CPE as a target for stimulating adult neurogenesis in aging brain. A single-cell transcriptome examination of both SVZ and DG regions in the brains from female and male mice at four different ages (2-, 7-, 12-, and 19-months of age, representing adulthood onset, middle-aged, reproductive senescence, and senescence phase, respectively) was performed (upper panel). Aging caused a deficiency of BDNF-TrkB signal cascade in old NSCs due to decreased mature form of BDNF and its receptor TrkB, thus limiting the neurogenesis in old neurogenic niches (lower-left panel). CPE, a carboxypeptidase highly enriched in NSCs and significantly downregulated with aging, played a crucial role in mature BDNF generation. Restoring the expression of CPE in aged mice rebuilt BDNF generation and neurogenesis (lower-right panel).

Similar articles

Cited by

References

    1. Doetsch F, Caille I, Lim DA, et al. . Subventricular zone astrocytes are neural stem cells in the adult mammalian brain. Cell 1999;97:703–16. - PubMed
    1. Eriksson PS, Perfilieva E, Bjork-Eriksson T, et al. . Neurogenesis in the adult human hippocampus. Nat Med 1998;4:1313–7. - PubMed
    1. Jiang D, Li T, Guo C, et al. . Small molecule modulators of chromatin remodeling: from neurodevelopment to neurodegeneration. Cell Biosci 2023;13:10. - PMC - PubMed
    1. Sorrells SF, Paredes MF, Cebrian-Silla A, et al. . Human hippocampal neurogenesis drops sharply in children to undetectable levels in adults. Nature 2018;555:377–81. - PMC - PubMed
    1. Boldrini M, Fulmore CA, Tartt AN, et al. . Human hippocampal neurogenesis persists throughout aging. Cell Stem Cell 2018;22:589–599.e5. - PMC - PubMed

LinkOut - more resources