. 2024 Dec 10;12(2):nwae451.
doi: 10.1093/nsr/nwae451. eCollection 2025 Feb.

A deep learning framework for in silico screening of anticancer drugs at the single-cell level

Affiliations

A deep learning framework for in silico screening of anticancer drugs at the single-cell level

Peijing Zhang et al. Natl Sci Rev. .

Abstract

Tumor heterogeneity plays a pivotal role in tumor progression and resistance to clinical treatment. Single-cell RNA sequencing (scRNA-seq) enables us to explore heterogeneity within a cell population and identify rare cell types, thereby improving our design of targeted therapeutic strategies. Here, we use a pan-cancer and pan-tissue single-cell transcriptional landscape to reveal heterogeneous expression patterns within malignant cells, precancerous cells, as well as cancer-associated stromal and endothelial cells. We introduce a deep learning framework named Shennong for in silico screening of anticancer drugs for targeting each of the landscape cell clusters. Utilizing Shennong, we could predict individual cell responses to pharmacologic compounds, evaluate drug candidates' tissue damaging effects, and investigate their corresponding action mechanisms. Prioritized compounds in Shennong's prediction results include FDA-approved drugs currently undergoing clinical trials for new indications, as well as drug candidates reporting anti-tumor activity. Furthermore, the tissue damaging effect prediction aligns with documented injuries and terminated discovery events. This robust and explainable framework has the potential to accelerate the drug discovery process and enhance the accuracy and efficiency of drug screening.

Keywords: drug screening; machine learning; pan-cancer; scRNA-seq; targeted therapy.


Figures

Figure 1.
Figure 1.
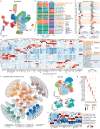
The pan-cancer cell landscape was constructed using Microwell-seq. (a) Overview of scRNA-seq experiments and bioinformatics workflow. Created with BioRender.com. (b) Stacked bar chart showing the number of analyzed cells from each tumor type and each patient, and pie chart showing the percentage of analyzed cells in tumor (CA) and adjacent (ADJ) tissues. (c) t-SNE visualization of 303 351 single cells from the pan-cancer landscape, colored by cluster identity (n = 51) and tumor type (n = 7). (d) Hierarchical clustering tree (top) showing the similarity among 51 cell clusters, and histogram (bottom) showing the percentage of tissue source for each cell cluster.
Figure 2.
Figure 2.
Identification of malignant and precancerous cells via single-sample analyses. (a) Stacked bar chart showing the number of samples from each tissue type and source in the pan-cancer landscape and HCL, and pie chart showing the percentage of analyzed samples in CA, ADJ, and normal (HCL) tissues. (b) The mutual cell interaction among 5 main cell lineages in TMEs from different tissue sources. (c) Interactions between 5 main cell lineages in TME. The length of arcs represents the predicted interaction counts. (d) UMAP visualization of 24 628 single cells from patient ICC_1012 (top left), colored by CD151 and EPCAM enrichment (top right), tissue sources (bottom left), and cell lineages (bottom right). (e) Malignant type classification (top) and tissue source distribution (bottom) of inferred CNV scores (x-axis) and CNV correlations (y-axis) for all epithelial cells of patient ICC_1012. (f) The cell interactions between cell clusters for patient ICC_1012. Malignant cell types are colored orange and non-malignant epithelial cell types are colored green. (g) Boxplot showing enrichment scores of ‘oxidative phosphorylation’, ‘glycolysis/gluconeogenesis’ and ‘pentose phosphate pathway’ metabolism pathways in epithelial clusters of corresponding normal tissue and patient ICC_1012. (h) Malignant type classification (left) and tissue source distribution (right) of inferred CNV scores (x-axis) and CNV correlations (y-axis) for all epithelial cells in the pan-cancer landscape.
Figure 3.
Figure 3.
Profiling malignant and tumor-associated stromal cells via pan-cancer analyses. (a) UMAP visualization of clusters (n = 23) for all epithelial cells from the pan-cancer landscape and HCL. (b) Bar plot showing the percentage of malignant type classification (left), tissue source (middle), and tissue type (right) for each epithelial cluster. (c) Boxplot showing enrichment scores for the ‘oxidative phosphorylation’ and ‘glycolysis/gluconeogenesis’ metabolism pathways in all epithelial clusters. (d) Heatmap showing cell type-specific TFs detected by SCENIC analysis. Malignant cell types are colored orange and precancerous cell types are colored blue. (e) Gene regulatory networks showing relationships between TFs and their target genes for epithelial cell clusters mainly originating in the lung. (f) UMAP visualization of all stromal cells from the pan-cancer landscape and HCL, colored by clusters (n = 11, top), tissue source (bottom left), and main cell type (bottom right). (g) Dot plots showing scaled average expression levels of cell type-specific markers in fibroblast/myofibroblast clusters. (h) Heatmap showing cell type-specific TFs detected in fibroblast/myofibroblast clusters by SCENIC analysis.
Figure 4.
Figure 4.
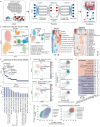
Interpretable single-cell level drug perturbation prediction using Shennong. (a) Workflow of the Shennong framework. The framework employs an interpretable conditional variational autoencoder, trained on perturbation data matrix and scRNA-seq count matrix for each cell to encode a set of significant features representing terms. The terms are pruned and enriched by the framework using a group lasso and gene-level sparsity regularization which was then fed into a linear decoder. The framework was interpretable by calculating the influence term score matrix of specific terms for each cell and the contribution of individual genes in each term. (b) UMAP representation of the prediction set (n = 42 517 cells) embedded in latent space extracted from the framework, colored by cell type (left) and cell lineage (right). (c) Heatmaps showing the scaled influence term scores of the top 10 significantly differential terms (columns) in stromal cells (left) and epithelial cells (right). (d) Dot plot showing counts of the top 10 significantly differential terms in each cell type in the single-lineage analyses with the compounds corresponding to the terms labeled. (e) Bar plot showing counts of the top 10 significantly differential terms in each cell type in stromal lineage. Terms that are further analyzed are colored blue. (f) UMAP representation of the influence term scores of all cells for terms LJP008_SKL_24H: G19_DOWN (top) and MOA001_U2OS_24H: P04_DOWN (bottom), corresponding to the FDA-approved drugs azacitidine and palbendazole, respectively. (g) Visualization of selected cell types (CAFs) in the context of the terms mentioned in (f). Each dot shows the influence term scores of each cell. (h) Violin plot showing the influence term scores for terms mentioned in (e) for all cell types in the stromal and endothelial lineages. (i) Visualization of cell lineages (top) and tumor-associated stromal or endothelial cell types (bottom) in the context of the terms mentioned in (e).
Figure 5.
Figure 5.
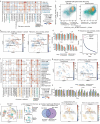
Identifying anticancer drugs and potential targets using Shennong. (a) Dot plot showing the influence term scores of terms across all epithelial cell types that are significantly different in epithelial cell types mainly from lung. Compounds corresponding to the terms and epithelial cell types mainly from lung are labeled. (b) UMAP representation of the influence term scores of all cells for terms LPROT004_YAPC_6H: BRD-A14634327: 1_DOWN (left) and PBIOA018_A549_24H: M02_DOWN (right), corresponding to the compounds GSK-126 and volasertib, respectively. (c) Visualization of cell types mainly from lung (left) and corresponding malignant types (right) in the terms mentioned in (b). Each dot shows the influence terms score of each cell. (d) Bar plot showing cell viability of A549 cell lines treated with the compounds gemcitabine, pemetrexed, fostamatinib, and volasertib across four dose regimens (1 μm, 5 μm, 10 μm and 20 μm) over time points of 6 hours (6 h), 12 h, 24 h and 48 h. Cell viability was assessed using a standard assay, with control cells receiving DMSO; data were presented as mean ± SEM for each treatment group at the indicated doses. (e) Dot plot showing the absolute weights of genes contribution to the term PBIOA018_A549_24H: M02_DOWN. (f) Dot plot showing the influence term scores of terms across all epithelial cell types that are significantly different in epithelial cell types mainly from liver. Compounds corresponding to the terms and epithelial cell types mainly from liver are labeled. (g) UMAP representation of the influence term scores of all cells for terms PBIOA019_HEPG2_24H: M19_DOWN (left) and LJP005_HCC515_24H: B14_DOWN (right) corresponding to the compounds parbendazole and tozasertib, respectively. (h) Bar plot showing cell viability of HepG2 cell lines treated with the compounds sorafenib, regorafenib, parbendazole and tozasertib across four dose regimens (1 μm, 5 μm, 10 μm and 20 μm) over time points of 6 h, 12 h, 24 h and 48 h. Cell viability was assessed using a standard assay, with control cells receiving DMSO; data were presented as mean ± SEM for each treatment group at the indicated doses. (i) UMAP visualization of cells from the LUAD dataset (112 176 cells), colored by cell clusters. (j) UMAP representation of cells in the LUAD dataset embedded in latent space extracted from the framework, colored by cell lineage (top) and tissue source (bottom). (k) Overlap of significantly different terms in lung malignant cells between pan-cancer landscape (C12) and the third-party LUAD dataset (clusters 15, 26, 29, and 35; only terms observed in at least two clusters were counted). (l) UMAP representation of influence term scores of all cells for terms CPC004_HCC515_24H: BRD-A27887842-001-03–2: 10_UP (left) and PBIOA018_A549_24H: M02_DOWN (right), corresponding to the compounds prednisolone and volasertib, respectively.
Figure 6.
Figure 6.
Identifying tissue damaging effects of anticancer drugs using Shennong. (a) UMAP representation of the influence term scores of all cells for the term CPC006_A549_24H: BRD-K56343971-001-02–3:10_UP, corresponding to the compound vemurafenib. (b) Visualization of malignant hepatocytes (left) and each epithelial cell type mainly from pancreas (right) in the context of the terms CPC006_A549_24H: BRD-K56343971-001-02–3:10_UP and PCL001_HEPG2_24H: BRD-K11413513:10_DOWN, corresponding to the compounds vemurafenib and BRD-K11413513. Each dot shows the influence terms score of each cell. (c) UMAP representation of the influence term scores of all cells for terms LJP005_SKBR3_24H: F19_DOWN (top) and ASG003_MCF7_48H: E07_UP (bottom), corresponding to compounds GSK-690693 and lopinavir, respectively. (d) Box plot showing influence score of the top 16 cell types in the term ASG003_MCF7_48H: E07_UP corresponding to the compound lopinavir. Epithelial cell types originating from HCL are colored green. (e) Visualization of tumor-associated fibroblasts or malignant hepatocytes (top) and each epithelial cell type mainly from liver (bottom) in the context of the terms LJP005_SKBR3_24H: F19_DOWN and ASG003_MCF7_48H: E07_UP. Each dot shows the influence terms score of each cell.

References

    1. McGranahan N, Swanton C. Biological and therapeutic impact of intratumor heterogeneity in cancer evolution. Cancer Cell 2015; 27: 15–26.10.1016/j.ccell.2014.12.001 - DOI - PubMed
    1. Barkley D, Moncada R, Pour M et al. Cancer cell states recur across tumor types and form specific interactions with the tumor microenvironment. Nat Genet 2022; 54: 1192–201.10.1038/s41588-022-01141-9 - DOI - PMC - PubMed
    1. Priestley P, Baber J, Lolkema MP et al. Pan-cancer whole-genome analyses of metastatic solid tumours. Nature 2019; 575: 210–6.10.1038/s41586-019-1689-y - DOI - PMC - PubMed
    1. Kinker GS, Greenwald AC, Tal R et al. Pan-cancer single-cell RNA-seq identifies recurring programs of cellular heterogeneity. Nat Genet 2020; 52: 1208–18.10.1038/s41588-020-00726-6 - DOI - PMC - PubMed
    1. Zheng L, Qin S, Si W et al. Pan-cancer single-cell landscape of tumor-infiltrating T cells. Science 2021; 374: abe6474.10.1126/science.abe6474 - DOI - PubMed

LinkOut - more resources