. 2025 Jan 13:15:1484143.
doi: 10.3389/fimmu.2024.1484143. eCollection 2024.

Specific immune response to M. tuberculosis and ability to in vitro control mycobacterial replication are not impaired in subjects with immune-mediated inflammatory disease and tuberculosis infection

Affiliations

Specific immune response to M. tuberculosis and ability to in vitro control mycobacterial replication are not impaired in subjects with immune-mediated inflammatory disease and tuberculosis infection

Chiara Farroni et al. Front Immunol. .

Abstract

Background: Subjects with immune-mediated inflammatory diseases (IMID), such as rheumatoid arthritis, with tuberculosis infection (TBI), have a high probability of progressing to tuberculosis disease (TB). We aim to characterize the impact of IMID on the immune response to M. tuberculosis (Mtb) in patients with TBI and TB disease.

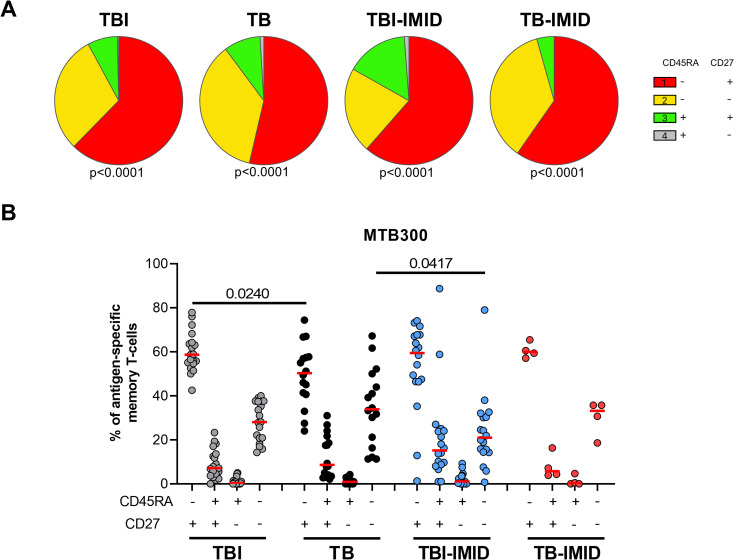
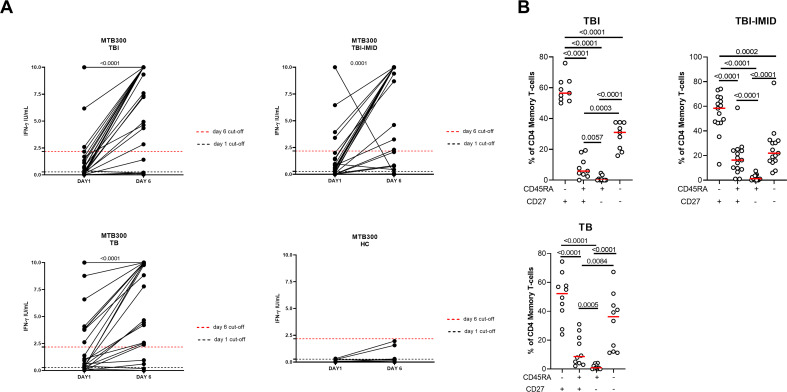
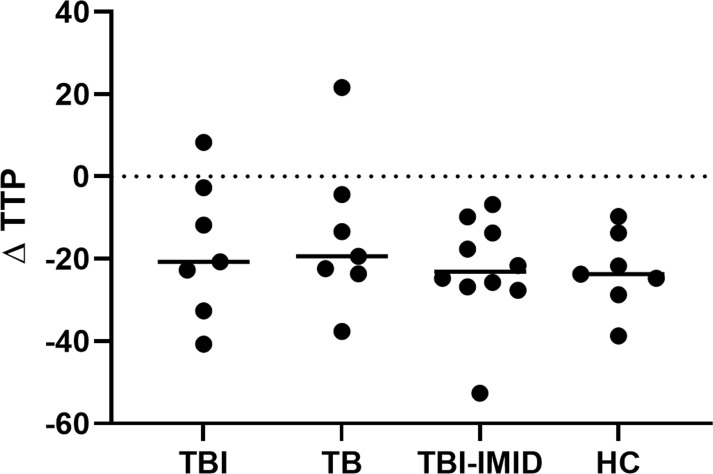
Methods: We enrolled TBI and TB patients with and without IMID. Peripheral blood mononuclear cells (PBMCs) were stimulated with Mtb-derived epitopes (MTB300). By flow-cytometry, we identified the Mtb-specific CD4+ T cells as cytokine-producing T cells or as CD25+ CD134+ CD4+ T cells. Memory and activation status of Mtb-specific T cells were assessed by evaluating: CD153, HLA-DR, CD45RA, CD27. Mycobacterial growth inhibition assay (MGIA) was used to evaluate the ability of PBMCs to inhibit mycobacteria growth. A long-term stimulation assay was used to detect a memory response.

Results: The IMID status and therapy did not affect the magnitude of response to Mtb-antigen stimulation and the number of responders. TBI-IMID showed a cytokine profile like TBI and TB patients. The Mtb response of TBI-IMID patients was characterized by an effector memory and central memory phenotype as in TBI and TB groups. This memory phenotype allowed the increased IFN-γ production after 6 days of MTB300-stimulation. HLA-DR expression on Mtb-specific T cells was associated with TB, whereas CD153 was associated with TBI status. Finally, the TBI-IMID had an MGIA response like TBI and TB patients.

Conclusion: IMID condition does not affect key aspects of the immune response to Mtb, such as the cytokine response, memory and activation profile, and the ability to contain the mycobacteria replication. The immunological characterization of the fragile population of TBI-IMID patients is fundamental to understanding the correlation between protection and disease.

Keywords: AIM assay, IFN-γ; MGIA; Th1; antigen-specific response; rheumatoid arthritis; tuberculosis; tuberculosis infection.


Conflict of interest statement

The authors declare that the research was conducted in the absence of any commercial or financial relationships that could be construed as a potential conflict of interest. The funding sources did not influence the study’s design, data analysis, interpretation, or the writing of the manuscript. The author(s) declared that they were an editorial board member of Frontiers, at the time of submission. This had no impact on the peer review process and the final decision.

Figures

Figure 1
Figure 1
Scheme of subjects enrolled in the study. A total of 132 patients, with different TB statuses and with or without IMID, were enrolled for the study. The number of subjects used for each methodology is reported (Created in BioRender.com).
Figure 2
Figure 2
Evaluation of Mtb-specific CD4 T-cell response in TB and TBI subject with and without IMID. PBMCs were stimulated with Mtb-specific antigens (MTB300) for 24 or 48 hours and immune response was evaluated by flow-cytometry. All the analyses were performed only among the responders. (A) Antigen-specific response evaluated as total CD4 Th1 cytokine-producing cells after 24 h of stimulation. (B) Antigen-specific response evaluated as total IFN-γ+ CD4 T cells after 24 h of stimulation. (C) Antigen-specific response evaluated as TNF-α+ CD4+ T cells after 24 h of stimulation. (D) Antigen-specific response evaluated as IL-2+ CD4+ T cells after 24 h of stimulation. (E) Antigen-specific response evaluated as CD25+ CD134+ CD4+ T cells after 48h of stimulation. (A–E) Tables under the graphs report the number of CD4+ T-cell responders to MTB300. Horizontal red lines indicate the median and each dot represents a single subject. Statistical analysis was performed using the Mann-Whitney test. (F) Pie charts representing the proportion of different cytokine-producing CD4+ T-cell subsets. (G) Pie charts representing the proportion of monofunctional and polyfunctional antigen-specific CD4+ T cells. (F, G) Boolean gate combination and Wilcoxon matched-pairs signed rank test were applied. TB, tuberculosis; TBI, tuberculosis infection; IMID, immune-mediated inflammatory disease; IFN-γ, interferon-gamma; IL-2, interleukine 2; TNF-α, tumor necrosis factor alpha.
Figure 3
Figure 3
HLA-DR- and CD153 expression on Mtb-specific CD4+ T cells in TB and TBI subjects with and without IMID. PBMCs were stimulated with Mtb-specific antigens (MTB300) for 24 hours and 48 hours and the immune response was evaluated by flow-cytometry. The activation profile (CD153+/-HLADR+/-) of Mtb specific T cells was evaluated only among the responders. (A) Activation profile of antigen-specific response, defined as total CD4 Th1 cytokine-producing cells; horizontal black lines indicate the median and each dot represents a single subject. (B) Activation profile of antigen-specific response, defined as CD25+ CD134+ CD4+ T- cell response; horizontal lines indicate the median and each dot represents a single subject. (C) Pie charts representing the proportion of different CD153+/-HLADR+/- CD4+ Th1 cytokine-producing cells. (D) Pie charts representing the proportion of different CD153+/-HLADR+/- CD25+ CD134+ CD4+ T cells. Statistical analysis was performed using the Mann-Whitney test and Wilcoxon test. TB, tuberculosis; TBI, tuberculosis infection; IMID, immune-mediated inflammatory disease; h, hours.
Figure 4
Figure 4
Activation profile of Mtb-specific CD4 Th1 cells in TB and TBI subject with and without IMID. PBMCs were stimulated with Mtb-specific antigens (MTB300) for 24 hours and the immune response was evaluated by flow-cytometry. Antigen-specific response was defined as total CD4 Th1 cytokine-producing cells and the activation profile was evaluated only among the responders. (A) Pie charts representing the proportion of CD27+/- CD153+/-HLADR+/- CD4 T-cell subsets; Wilcoxon matched-pairs signed rank test were applied. (B) Frequency of antigen-specific CD27+/- CD153+/-HLADR+/- CD4 T-cell subsets. Horizontal red lines indicate the median and each dot represents a single subject. Statistical analysis was performed using the Mann-Whitney test. TB, tuberculosis; TBI, tuberculosis infection; IMID, immune-mediated inflammatory disease.
Figure 5
Figure 5
Memory profile of Mtb-specific CD4 Th1 cells in TB and TBI subject with and without IMID. PBMCs were stimulated with Mtb-specific antigens (MTB300) for 24 hours and the immune response was evaluated by flow-cytometry. Antigen-specific response was defined as total CD4 Th1 cytokine-producing cells and the memory profile was evaluated only among the responders. (A) Pie charts representing the proportion of CD27+/- CD45RA+/- CD4 T-cell subsets; Wilcoxon matched-pairs signed rank test were applied. (B) Frequency of antigen-specific CD27+/- CD45RA+/- CD4 T-cell subsets. Horizontal red lines indicate the median and each dot represents a single subject. Statistical analysis was performed using the Mann-Whitney test. N, number; TB, tuberculosis; TBI, tuberculosis infection; IMID, immune-mediated inflammatory disease.
Figure 6
Figure 6
Long-term Mtb stimulation increases the IFN-γ production in subjects with different TB status with and without IMID and healthy controls. (A) PBMCs were stimulated with Mtb-specific antigens (MTB300) for 6 days in the presence of IL-2. IFN-γ was evaluated by ELISA on day 1 and day 6 on supernatants. (B) Memory profile of Mtb-specific CD4 Th1 cells. PBMCs were stimulated with Mtb-specific antigens (MTB300) for 24 hours and the immune response was evaluated by flow-cytometry. Antigen-specific response was defined as total CD4 Th1 cytokine-producing cells and the activation profile was evaluated only among the responders. The graph represents the frequency of MTB300-specific CD27+/- CD45RA+/- CD4 T-cell subsets of subjects tested in the long-term stimulation assay. Horizontal red lines indicate the median and each dot represents a single subject. Statistical analysis was performed using the Wilcoxon matched-pairs signed rank test. TB, tuberculosis; TBI, tuberculosis infection; IMID, immune-mediated inflammatory disease; HC, healthy control; IFN-γ, interferon-gamma.
Figure 7
Figure 7
Long-term Mtb stimulation increases the IFN-γ production in TBI-IMID individuals stratified according to the QFT-Plus response. (A) PBMCs were stimulated with Mtb-specific antigens (MTB300) for 6 days in the presence of IL-2. IFN-γ was evaluated by ELISA at day 1 and day 6 on supernatants in TBI-IMID QFT-Plus negative and QFT-Plus positive. (B) Memory profile of Mtb-specific CD4 Th1 cells. PBMCs were stimulated with Mtb-specific antigens (MTB300) for 24 hours and the immune response was evaluated by flow-cytometry. Antigen-specific response was defined as total CD4 Th1 cytokine-producing cells and the activation profile was evaluated only among the responders. (C) Antigen-specific response evaluated as total CD4 Th1 cytokine-producing cells after 24 h of stimulation. Pie charts represent the proportion of different cytokine-producing CD4+ T-cell subsets. Horizontal red lines indicate the median and each dot represents a single subject. Statistical analysis was performed using the Mann Whitney test and the Wilcoxon matched pairs signed rank test. TB, tuberculosis; TBI, tuberculosis infection; IMID, immune-mediated inflammatory disease; IFN-γ, interferon-gamma; IL-2, interleukine 2; TNF-α, tumor necrosis factor alpha.
Figure 8
Figure 8
Comparison of MGIA response as TTP in TBI, TB, TBI-IMID, and healthy control individuals. TPP is expressed in hours. As an experimental control, the bacterial inoculum used was added directly to an MGIT tube. The TTP of experimental control was subtracted by the TPP of each experimental condition. Data are represented as the median. Mann-Whitney test was applied. TB, tuberculosis, TBI, TB infection; TTP, time to positivity; HC, healthy control.

References

    1. Goletti D, Al-Abri S, Migliori GB, Arlehamn CL, Haldar P, Sundling C, et al. . World Tuberculosis Day 2024 theme “Yes! We can end TB” can be made a reality through concerted global efforts that advance detection, diagnosis, and treatment of tuberculosis infection and disease. Int J Infect Dis. (2024) 141S:106993. doi: 10.1016/j.ijid.2024.106993 - DOI - PubMed
    1. WHO . WHO Global Tuberculosis Report. (2024). Available online at: https://www.who.int/teams/global-tuberculosis-programme/tb-reports/globa....
    1. Houben RMGJ, Dodd PJ. The global burden of latent tuberculosis infection: A re-estimation using mathematical modelling. PloS Med. (2016) 13:e1002152. doi: 10.1371/journal.pmed.1002152 - DOI - PMC - PubMed
    1. Alonzi T, Repele F, Goletti D. Research tests for the diagnosis of tuberculosis infection. Expert Rev Mol Diagn. (2023) 23:783–95. doi: 10.1080/14737159.2023.2240230 - DOI - PubMed
    1. Kontsevaya I, Cabibbe AM, Cirillo DM, DiNardo AR, Frahm N, Gillespie SH, et al. . Update on the diagnosis of tuberculosis. Clin Microbiol Infect. (2023) 30(9):1115–22. doi: 10.1016/j.cmi.2023.07.014 - DOI - PubMed