. 2025 Jan 13:15:1522076.
doi: 10.3389/fimmu.2024.1522076. eCollection 2024.

Single-cell RNA-seq reveals immune cell heterogeneity and increased Th17 cells in human fibrotic skin diseases

Affiliations

Single-cell RNA-seq reveals immune cell heterogeneity and increased Th17 cells in human fibrotic skin diseases

Cheng-Cheng Deng et al. Front Immunol. .

Abstract

Background: Fibrotic skin disease represents a major global healthcare burden, characterized by fibroblast hyperproliferation and excessive accumulation of extracellular matrix components. The immune cells are postulated to exert a pivotal role in the development of fibrotic skin disease. Single-cell RNA sequencing has been used to explore the composition and functionality of immune cells present in fibrotic skin diseases. However, these studies detected the gene expression of all cells in fibrotic skin diseases and did not enrich immune cells. Thus, the precise immune cell atlas in fibrotic skin diseases remains unknown. In this study, we plan to investigate the intricate cellular landscape of immune cells in keloid, a paradigm of fibrotic skin diseases.

Methods: CD45+ immune cells were enriched by fluorescence-activated cell sorting. Single-cell RNA sequencing was used to analyze the cellular landscape of immune cells in keloid and normal scar tissues. Ki-67 staining, a scratch experiment, real-time PCR, and Western blotting were used to explore the effect of the Th17 cell supernatant on keloid fibroblasts.

Results: Our findings revealed the intricate cellular landscape of immune cells in fibrotic skin diseases. We found that the percentage of Th17 cells was significantly increased in keloids compared to normal scars. All the subclusters of macrophages and dendritic cells (DCs) showed similar proportions between keloid samples and normal scar samples. However, upregulated genes in keloid M1 macrophages, M2 macrophages, and cDC2 are associated with the MHC class II protein complex assembly and antigen assembly, indicating that macrophages and cDC2 are active in keloids. Functional studies suggested that the supernatant of Th17 cells could promote proliferation, collagen expression, and migration of keloid fibroblasts through interleukin 17A. Importantly, increased Th17 cells are also found in other fibrotic skin diseases, such as hypertrophic scars and scleroderma, suggesting this represents a broad mechanism for skin fibrosis.

Conclusion: In summary, we built a single-cell atlas of fibrotic skin diseases in this study. In addition, we explored the function of Th17 cell-fibroblast interaction in skin fibrosis. These findings will help to understand fibrotic skin disease pathogenesis in depth and identify potential targets for fibrotic skin disease treatment.

Keywords: IL-17; Th17 cell; dendritic cell; fibrotic skin diseases; immune cell; keloid; macrophage.


Conflict of interest statement

The authors declare that the research was conducted in the absence of any commercial or financial relationships that could be construed as a potential conflict of interest.

Figures
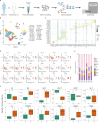
Figure 1
Figure 1
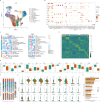
Single-cell transcriptome map of immune cells in fibrotic skin disease and normal scar dermis samples. (A) Workflow depicting the collection and processing of keloid, a paradigm of fibrotic skin diseases, and normal scar CD45+ cells for scRNA-seq. (B) Unsupervised clustering of the 41,084 single cells from three keloid samples and three normal scar samples, including 25 clusters and 16 major clusters. KC, keratinocyte; SMC, smooth muscle cell; Fib, fibroblast; EC, endothelial cell; ILC, innate lymphoid cell; NK, natural killer; DC, dendritic cell; Mono, monocyte; Macro, macrophage. (C) Dot plot of the expression of key cell type marker genes in each cell cluster. Bubble size is proportional to the percentage of cells expressing a gene in a cluster and color intensity is related to the average scaled gene expression. (D) Feature plots of expression distribution for cell type-specific markers. (E) The proportion of each cell type in three keloid samples and three normal scar samples. K, keloid; N, normal scar. (F) The percentage of cells for each immune cell type in keloids and normal scars. Ns, not significant; *, P<0.05; K, keloid; N, normal scar.
Figure 2
Figure 2
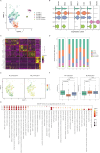
Transcriptional diversity of CD4+ and CD8+ T cells. (A) Uniform Manifold Approximation and Projection (UMAP) of 13 subclusters identified in CD4+ and CD8+ T cells. (B) Dot plots showing distinct expressions of the selected marker genes in each subcluster. (C) Heatmap illustrating the scaled score calculated based on the expression of curated gene signatures across CD4+ T cell subclusters (left) and CD8+ T cell subclusters (right). (D) Heatmap of the top 10 differentially expressed genes (ranked by log-transformed fold change in descending order) in the CD4+ and CD8+ T cell subclusters. (E) Box plots showing the percentage of cells for each T cell subcluster in the keloid and normal scar samples. The p-value indicated in the plot was calculated by unpaired two-tailed t-tests. (F) The proportion of each T cell subcluster in three keloid samples and three normal scar samples. K, keloid; N, normal scar. (G) Violin plots showing differentially expressed genes in the Th17 cells in keloids and normal scars. K, keloid; N, normal scar. (H) Functional KEGG pathway enrichment of the upregulated genes (keloid vs. normal scar, avg_logFC > 0.25, and p value < 0.05) in Th17 cells. The p-value was calculated using the hypergeometric distribution and corrected using the Benjamini and Hochberg method. Pathways with an adjusted p-value of <0.05 are considered significant.
Figure 3
Figure 3
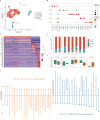
Fibrotic skin disease and normal scar mono-macrophages subclustered into distinct cell populations. (A) Uniform Manifold Approximation and Projection (UMAP) plots of the mono-macrophage subpopulations. (B) Violin plot showing key marker gene expression between the mono-macrophage subpopulations. (C) Heatmap showing the expression of the top 5 differentially expressed genes in the mono-macrophage subpopulations. (D) Bar plots showing the percentage of each mono-macrophage subpopulation in the keloid and normal scar samples. (E) UMAP plots showing the M1 and M2 scores for each cell in the macrophages. (F) Box plots showing the M1 and M2 scores for each subpopulation of macrophages. Significance was determined by the unpaired two-tailed t test. (G) GO terms enrichment of the upregulated genes (keloid vs. normal scar, avg_logFC > 0.25, and p-value < 0.05) in macrophages. GO terms with an adjusted p-value of <0.05 are considered significant.
Figure 4
Figure 4
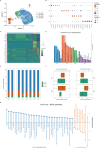
Fibrotic skin disease and normal scar dendritic cells (DCs) subclustered into distinct cell populations. (A) Uniform Manifold Approximation and Projection (UMAP) plot showing the annotation and color codes for subclusters of DCs. (B) Dot plot of representative genes of cell types in DCs. (C) Heatmap showing the expression of the top 10 differentially expressed genes in each subcluster of DCs. (D) Percentage distribution of each subcluster in the keloid and normal scar samples. (E) Box plots showing the percentage of DC subclusters in keloids and normal scars. (F) GO terms enrichment of differentially expressed genes in cDC2 cells. GO terms with an adjusted p-value of <0.05 are considered significant.
Figure 5
Figure 5
Fibrotic skin disease and normal scar mast cells subcluster into distinct cell populations. (A) Uniform Manifold Approximation and Projections (UMAPs) of subclustered mast cells, labeled in different colors. Cell type annotations are provided in the figure. (B) Dot plot indicating the expression of selected gene sets in mast subclusters. (C) Scaled expression of differentially expressed genes in mast subclusters. (D) Enrichment of differentially expressed genes in one mast subcluster compared to other mast subclusters. Results with adjusted P-value of <0.05 are considered significant. (E) Bar plot showing the fraction of mast subcluster in keloid and normal scar samples. (F) Boxplot showing the fraction of mast subclusters in keloid and normal scar. (G) KEGG pathway enrichment of differentially expressed genes in C1 subcluster. GO terms with adjusted P-value of <0.05 are considered significant.
Figure 6
Figure 6
Cellular interactions between Th17 cells and other cell types. (A) CSOmap analysis showing the interaction between Th17 cells and other cell subsets in normal scars (left) and keloids (right). Line thickness represents the significance of the cell-cell interaction. (B) Putative ligand and receptor pairs related to IL-17 and TNF within the Th17 cells and other cell populations in normal scars (left) and in keloids (right). The color of the middle ring is related to the average expression of genes in the cell types, with red representing a high expression and blue representing a low expression. The thicker the line, the greater the contribution of the ligand-receptor pairs. **, p<0.01, ***, p<0.001, ****, p<0.0001.
Figure 7
Figure 7
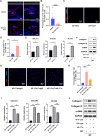
Th17 cell promotes the proliferation and collagen expression of keloid fibroblasts by secreting IL-17A. (A) Immunofluorescence staining of IL-17A and CD4 in keloid and normal scar tissues. The right panels are the insets of the left panels. Scale bar = 100 μm (left panel) and 50 μm (right panel). (B) Percentage of IL-17A+/CD4+ cells in normal and keloid tissues. Error bars represent SD (n=6). ***, p<0.001. (C, D) Ki67 staining analysis of fibroblasts co-cultured with Th0 or Th17 cells. Scale bar = 100 μm. Error bars represent SD (n=3). *, P<0.05. (E, F) qRT-PCR and Western blot analysis of collagen I, collagen III, and α-SMA expression in fibroblast co-cultured with Th0 or Th17 cells. Error bars represent SD (n=3). *, p<0.05; **, P<0.01. (G, H) Ki67 staining analysis of fibroblasts co-cultured with Th0 or Th17 cells in the presence or absence of anti-IL-17A antibody. Error bars represent SD (n=3). *, p<0.05; **, p<0.01. (I, J) qRT-PCR and Western blot analysis of collagen I, collagen III, and α-SMA expression in fibroblasts co-cultured with Th0 or Th17 cells in the presence or absence of anti-IL-17A antibody. Error bars represent SD (n=3). *p<0.05; **, p<0.01.
Figure 8
Figure 8
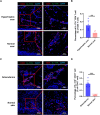
Th17 cells are increased in hypertrophic scars and scleroderma. (A) Immunofluorescence staining of IL-17A and CD4 in hypertrophic scar and normal scar tissues. The right panels are the insets of the left panels. Scale bar = 100 μm (left panel) and 50 μm (right panel). (B) Percentage of IL-17A+/CD4+ cells in hypertrophic scar and normal scar tissues. Error bars represent SD (n=6). **, p<0.01. (C) Immunofluorescence staining of IL-17A and CD4 in scleroderma and normal skin tissues. The right panels are the insets of the left panels. Scale bar = 100 μm (left panel) and 50 μm (right panel). (D) Percentage of IL-17A+/CD4+ cells in scleroderma and normal skin tissues. Error bars represent SD (n=6). ***, p<0.001.

References

    1. Henderson NC, Rieder F, Wynn TA. Fibrosis: from mechanisms to medicines. Nature. (2020) 587:555–66. doi: 10.1038/s41586-020-2938-9 - DOI - PMC - PubMed
    1. Antar SA, Ashour NA, Marawan ME, Al-Karmalawy AA. Fibrosis: types, effects, markers, mechanisms for disease progression, and its relation with oxidative stress, immunity, and inflammation. Int J Mol Sci. (2023) 24. doi: 10.3390/ijms24044004 - DOI - PMC - PubMed
    1. Younesi FS, Miller AE, Barker TH, Rossi FMV, Hinz B. Fibroblast and myofibroblast activation in normal tissue repair and fibrosis. Nat Rev Mol Cell Biol. (2024) 25:617–38. doi: 10.1038/s41580-024-00716-0 - DOI - PubMed
    1. Talbott HE, Mascharak S, Griffin M, Wan DC, Longaker MT. Wound healing, fibroblast heterogeneity, and fibrosis. Cell Stem Cell. (2022) 29:1161–80. doi: 10.1016/j.stem.2022.07.006 - DOI - PMC - PubMed
    1. Griffin MF, desJardins-Park HE, Mascharak S, Borrelli MR, Longaker MT. Understanding the impact of fibroblast heterogeneity on skin fibrosis. Dis Models Mech. (2020) 13. doi: 10.1242/dmm.044164 - DOI - PMC - PubMed

MeSH terms