

The immune landscape of fetal chorionic villous tissue in term placenta
- PMID: 39872537
- PMCID: PMC11769816
- DOI: 10.3389/fimmu.2024.1506305
The immune landscape of fetal chorionic villous tissue in term placenta
Abstract
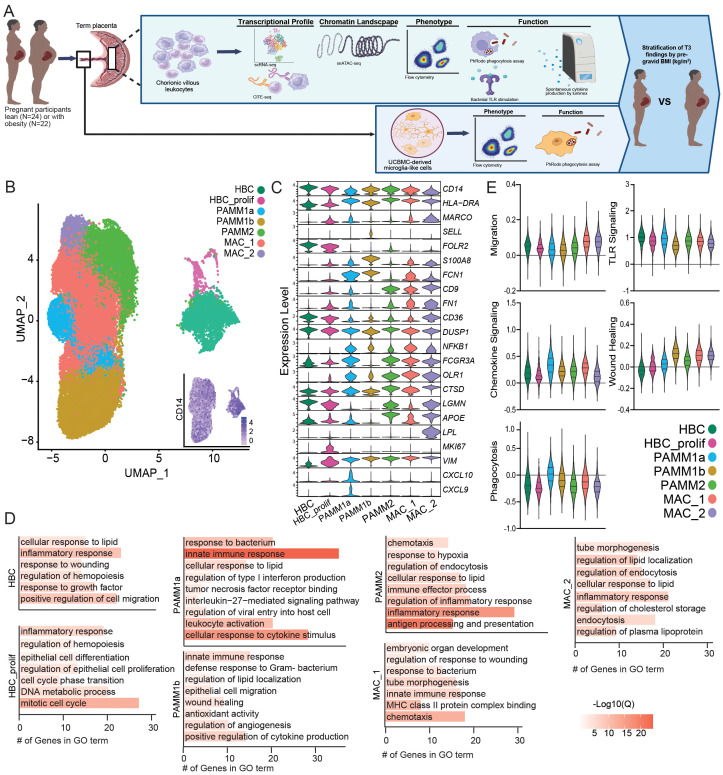
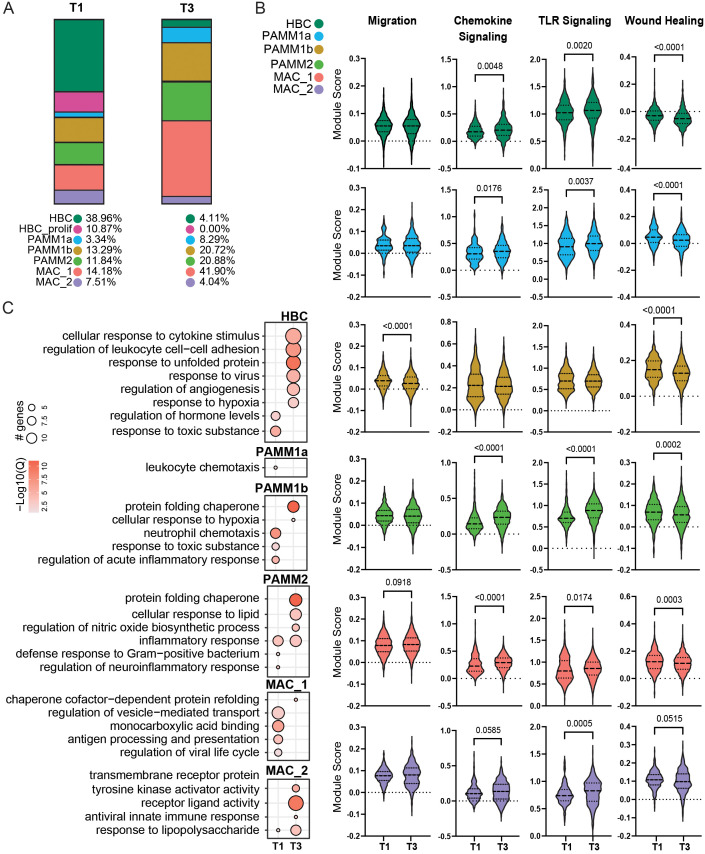
Introduction: The immune compartment within fetal chorionic villi is comprised of fetal Hofbauer cells (HBC) and invading placenta-associated maternal monocytes and macrophages (PAMM). Recent studies have characterized the transcriptional profile of the first trimester (T1) placenta; however, the phenotypic and functional diversity of chorionic villous immune cells at term (T3) remain poorly understood.
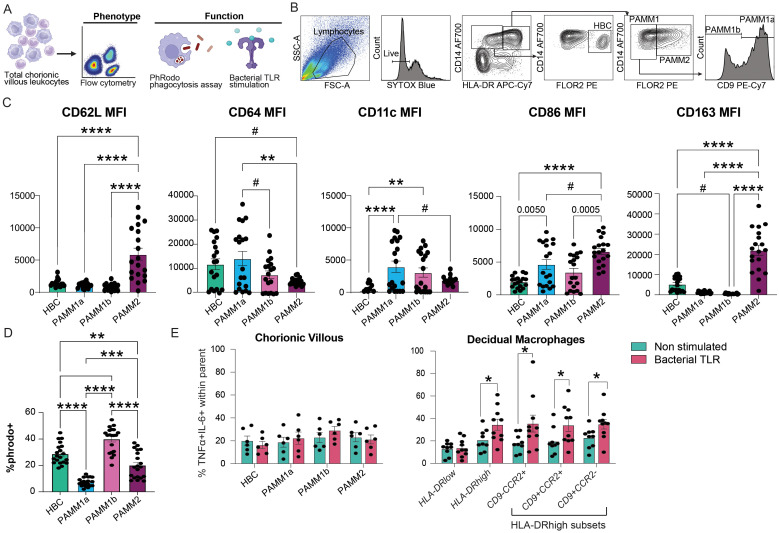
Methods: To address this knowledge gap, immune cells from human chorionic villous tissues obtained from full-term, uncomplicated pregnancies were deeply phenotyped using a combination of flow cytometry, single-cell RNA sequencing (scRNA-seq, CITE-seq) and chromatin accessibility profiling (snATAC-seq).
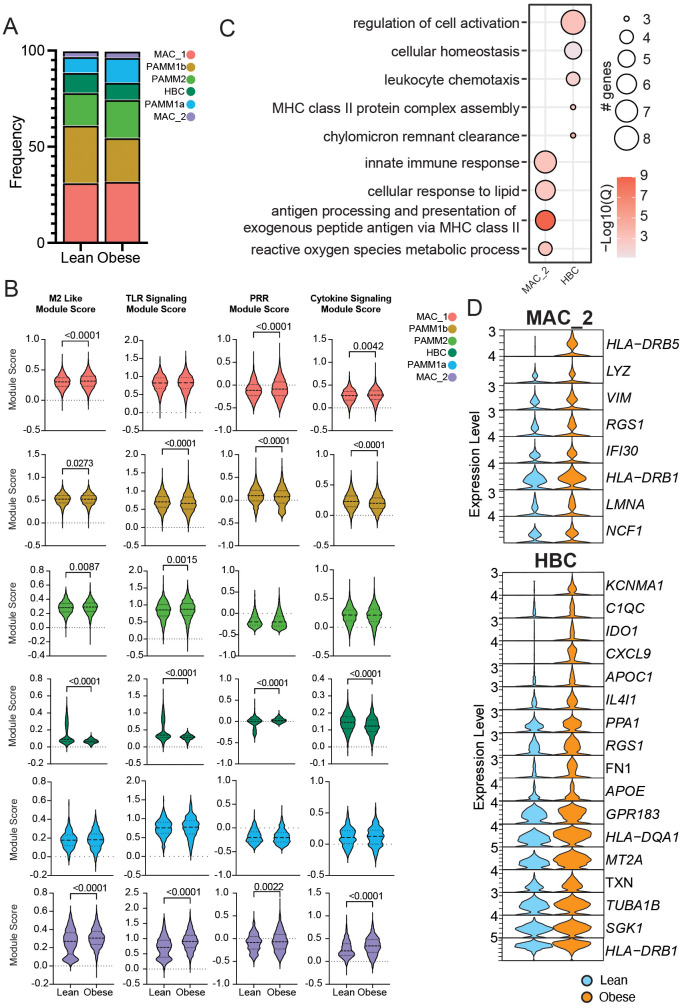
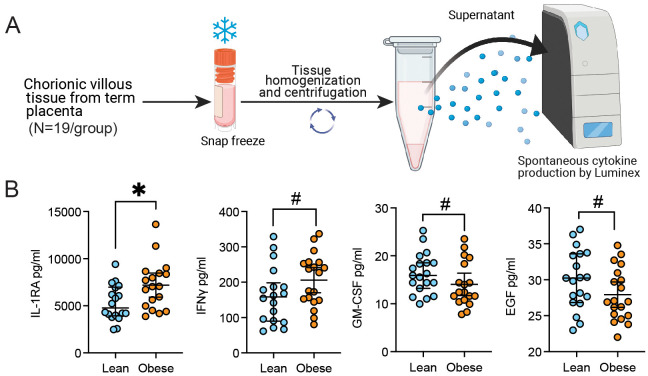
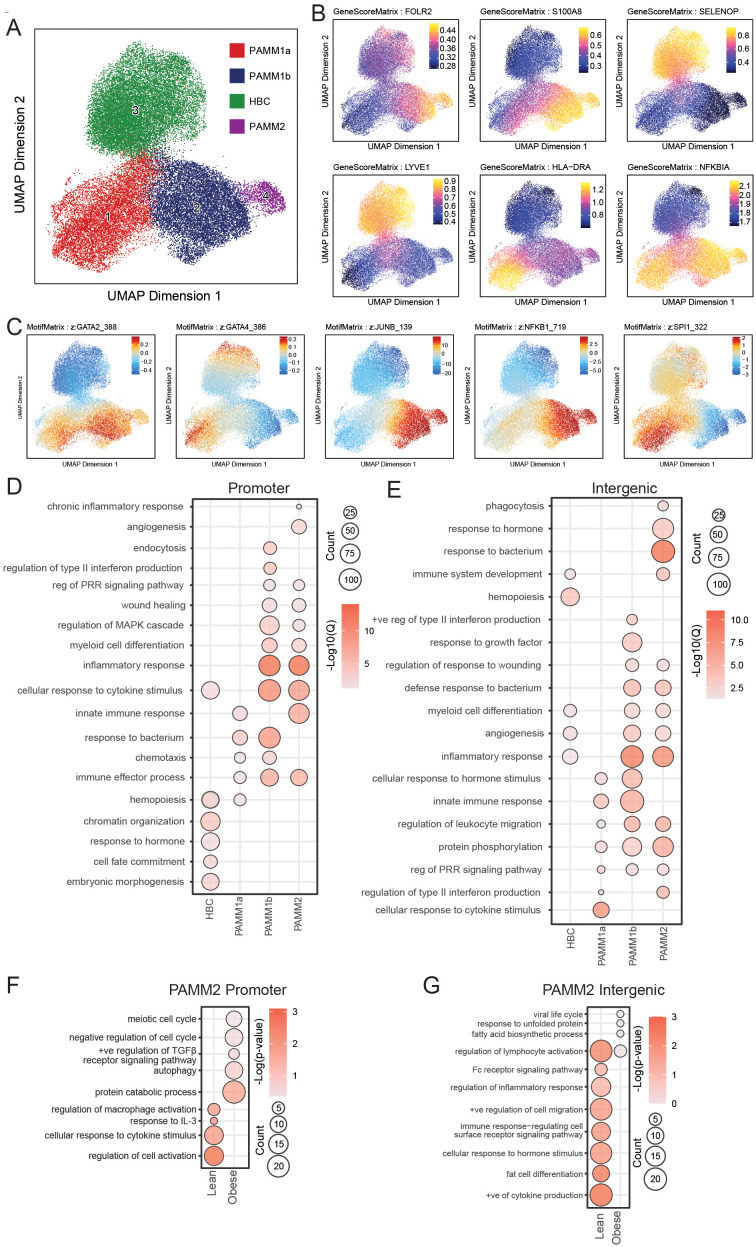
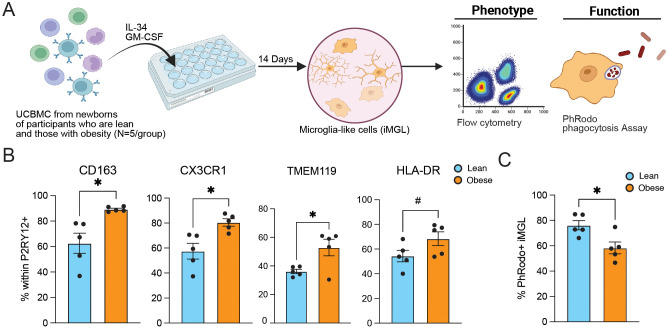
Results: Our results indicate that, relative to the first trimester, the frequency of fetal macrophages (HBC, proliferating HBC) is significantly reduced, whereas that of infiltrating maternal monocytes/macrophages (PAMM1b, PAMM1a, PAMM2, MAC_1) increased in T3. PAMM1b and HBCs exhibit the most phagocytic capacity at term highlighting their regulatory role in tissue homeostasis in late pregnancy. The transcriptional profiles of resident villous immune subsets exhibit a heightened activation state relative to the relative to T1, likely to support labor and parturition. Additionally, we provide one of the first insights into the chromatin accessibility profile of villous myeloid cells at term. We next stratified our findings by pre-pregnancy BMI since maternal pregravid obesity is associated with several adverse pregnancy outcomes. Pregravid obesity increased inflammatory gene expression, particularly among HBC and PAMM1a subsets, but dampened the expression of antimicrobial genes, supporting a tolerant-like phenotype of chorionic villous myeloid cells. We report a decline in HBC abundance accompanied by an increase in infiltrating maternal macrophages, which aligns with reports of heightened chorionic villous inflammatory pathologies with pregravid obesity. Finally, given the shared fetal yolk-sac origin of HBCs and microglia, we leveraged an in vitro model of umbilical cord blood-derived microglia to investigate the impact of pregravid obesity on fetal neurodevelopment. Our findings reveal increased expression of activation markers albeit dampened phagocytic capacity in microglia with pregravid obesity.
Discussion: Overall, our study highlights immune adaptations in the fetal chorionic villous with gestational age and pregravid obesity, as well as insight towards microglia dysfunction possibly underlying poor neurodevelopmental outcomes in offspring of women with pregravid obesity.
Keywords: epigenomics; macrophage; microglia; monocyte; obesity; placenta; pregnancy; transcriptomics.
Copyright © 2025 Doratt, True, Sureshchandra, Qiao, Rincon, Marshall and Messaoudi.
Conflict of interest statement
The authors declare that the research was conducted in the absence of any commercial or financial relationships that could be constructed as a potential conflict of interest.
Figures
Similar articles
-
Single-cell transcriptomics reveal differences between chorionic and basal plate cytotrophoblasts and trophoblast stem cells.Res Sq [Preprint]. 2025 Jun 11:rs.3.rs-6797967. doi: 10.21203/rs.3.rs-6797967/v1. Res Sq. 2025. PMID: 40585209 Free PMC article. Preprint.
-
Placental Exosomes During Gestation: Liquid Biopsies Carrying Signals for the Regulation of Human Parturition.Curr Pharm Des. 2018;24(9):974-982. doi: 10.2174/1381612824666180125164429. Curr Pharm Des. 2018. PMID: 29376493 Free PMC article. Review.
-
Maternal and neonatal outcomes of elective induction of labor.Evid Rep Technol Assess (Full Rep). 2009 Mar;(176):1-257. Evid Rep Technol Assess (Full Rep). 2009. PMID: 19408970 Free PMC article.
-
Use of biochemical tests of placental function for improving pregnancy outcome.Cochrane Database Syst Rev. 2015 Nov 25;2015(11):CD011202. doi: 10.1002/14651858.CD011202.pub2. Cochrane Database Syst Rev. 2015. PMID: 26602956 Free PMC article.
-
Prenatal opioid exposure and maternal HCV infection impair microglia development and function: A patient-specific in vitro model.Brain Behav Immun. 2025 Jun 9;129:206-220. doi: 10.1016/j.bbi.2025.06.010. Online ahead of print. Brain Behav Immun. 2025. PMID: 40499844 Free PMC article.
Cited by
-
Metabolic reprogramming of fetal hematopoietic stem and progenitor cells by maternal obesity.Front Hematol. 2025;4:1575143. doi: 10.3389/frhem.2025.1575143. Epub 2025 Apr 14. Front Hematol. 2025. PMID: 40678471 Free PMC article.
References
MeSH terms
Grants and funding
LinkOut - more resources
Full Text Sources
Research Materials
Miscellaneous