. 2024 Dec 13;4(1):loae040.
doi: 10.1093/lifemeta/loae040. eCollection 2025 Feb.

Glucose-6-phosphate dehydrogenase regulates mitophagy by maintaining PINK1 stability

Affiliations

Glucose-6-phosphate dehydrogenase regulates mitophagy by maintaining PINK1 stability

Yik-Lam Cho et al. Life Metab. .

Abstract

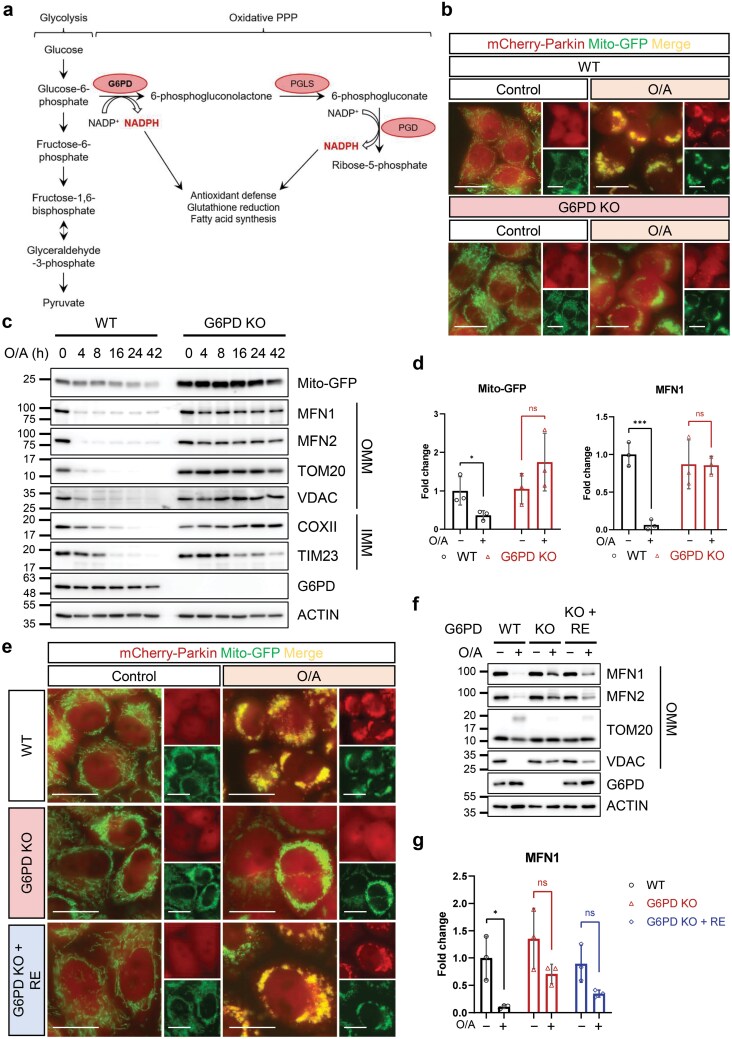
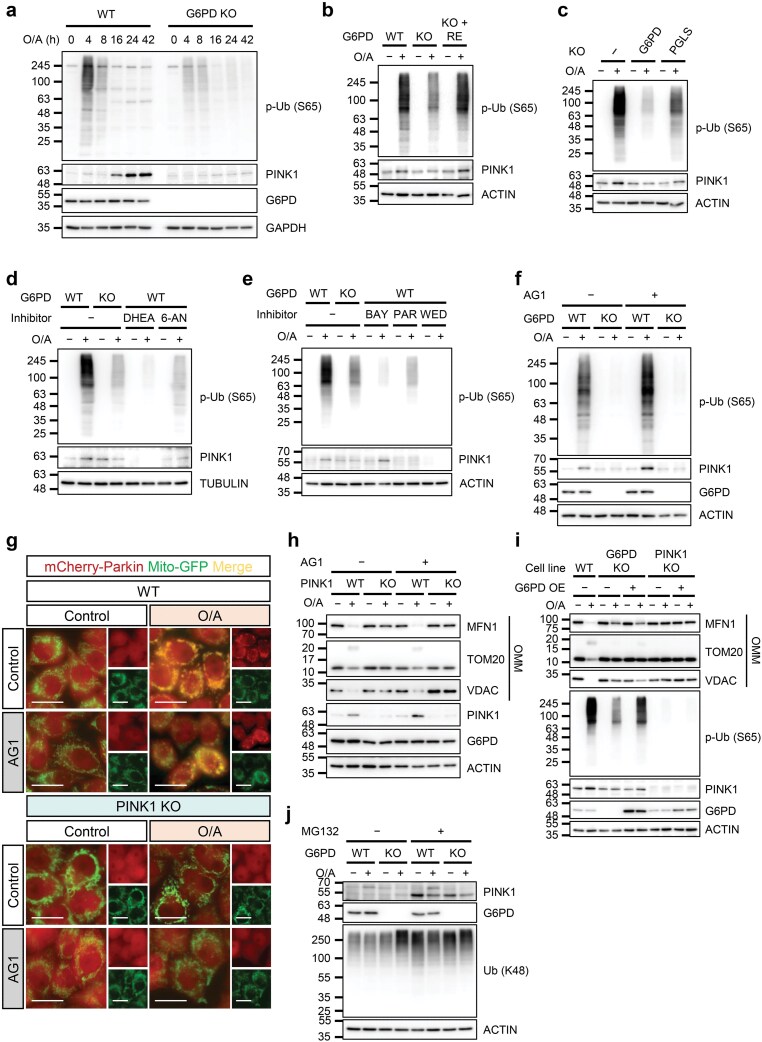
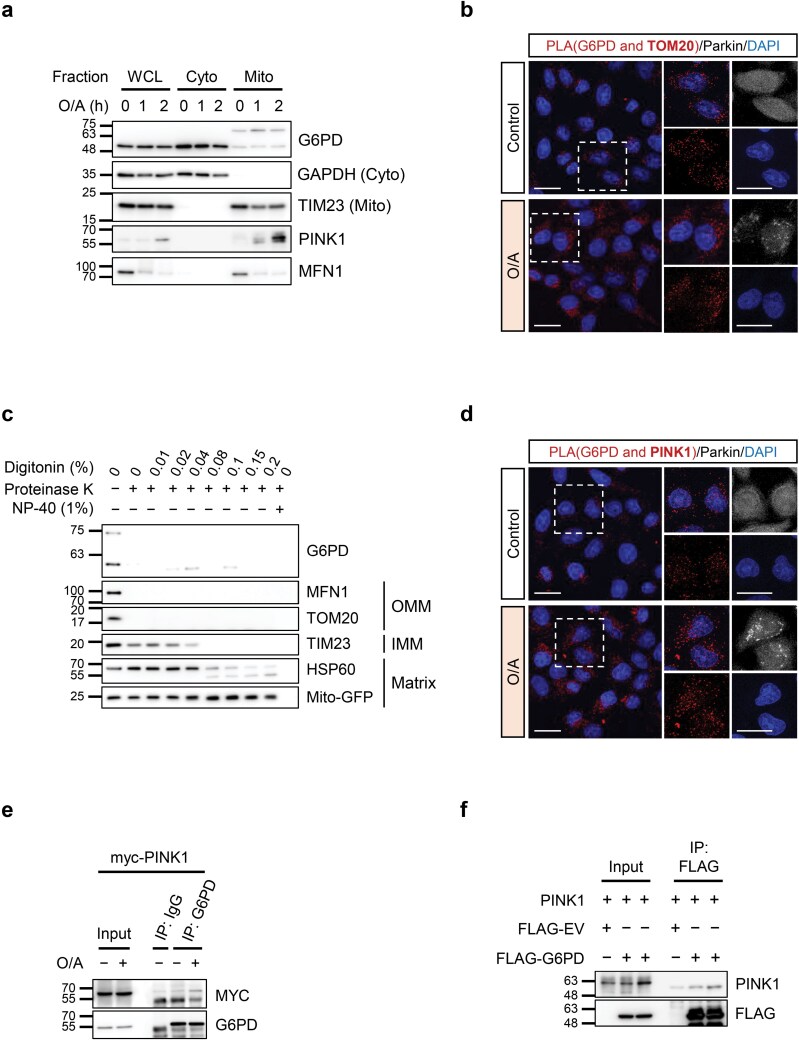
Glucose-6-phosphate dehydrogenase (G6PD) is the rate-limiting enzyme in the pentose phosphate pathway (PPP) in glycolysis. Glucose metabolism is closely implicated in the regulation of mitophagy, a selective form of autophagy for the degradation of damaged mitochondria. The PPP and its key enzymes such as G6PD possess important metabolic functions, including biosynthesis and maintenance of intracellular redox balance, while their implication in mitophagy is largely unknown. Here, via a whole-genome CRISPR-Cas9 screening, we identified that G6PD regulates PINK1 (phosphatase and tensin homolog [PTEN]-induced kinase 1)-Parkin-mediated mitophagy. The function of G6PD in mitophagy was verified via multiple approaches. G6PD deletion significantly inhibited mitophagy, which can be rescued by G6PD reconstitution. Intriguingly, while the catalytic activity of G6PD is required, the known PPP functions per se are not involved in mitophagy regulation. Importantly, we found a portion of G6PD localized at mitochondria where it interacts with PINK1. G6PD deletion resulted in an impairment in PINK1 stabilization and subsequent inhibition of ubiquitin phosphorylation, a key starting point of mitophagy. Finally, we found that G6PD deletion resulted in lower cell viability upon mitochondrial depolarization, indicating the physiological function of G6PD-mediated mitophagy in response to mitochondrial stress. In summary, our study reveals a novel role of G6PD as a key positive regulator in mitophagy, which bridges several important cellular processes, namely glucose metabolism, redox homeostasis, and mitochondrial quality control.

Keywords: G6PD; NADPH; PINK1; PPP; ROS; mitophagy.


Conflict of interest statement

H.M.S. holds the position of Editorial Board Member for Life Metabolism and is blinded from reviewing or making decisions for the manuscript. The other authors declare that no conflict of interest exists.

Figures

Figure 1
Figure 1
Generation of HeLa cell line expressing fluorescence reporter for mitochondrial content. (a) Schematic diagram of the screening process using HeLa 3+ cells. Briefly, the cell line was created by sequentially overexpressing mCherry-Parkin, mito-GFP, and miRFP-FLAG-Cas9 in that order using viral transfection methods. Cell sorting was done at each stage to isolate expressing cells. The eventual HeLa 3+ cell line was then subjected to lentiviral library transduction (~180,000 sgRNAs) and puromycin selection to isolate sgRNA-expressing cells. These cells were treated with O/A and subjected to FACS analysis using GFP as a readout for mitochondrial content. Indicated populations were collected and sent for sequencing to identify positive regulators of mitophagy. The process was repeated for clone #12 and clone #31 (n = 2). Created with BioRender.com. (b) Detection of mitochondrial protein levels. HeLa 3+ cells were treated with O/A (5 μmol/L and 1 μmol/L, respectively) for the indicated time points before analysis by SDS-PAGE and western blotting with the indicated antibodies. (c) Changes of mito-GFP intensity measured by live cell imaging. HeLa 3+ cells were treated with O/A (5 μmol/L and 1 μmol/L, respectively) for up to 42 h and images were taken at the indicated time points. Cells were imaged using a Leica fluorescence microscope. Scale bar: 20 μm. (d) PINK1 dynamics in HeLa 3+ cells. HeLa 3+ cells (clones #12 and #31) were treated with O/A (5 μmol/L and 1 μmol/L, respectively) or proteasome inhibitor MG132 (10 μmol/L) for 4 h. FL: full-length. (e) Reduction of mito-GFP measured by flow cytometry. Clone #12 and clone #31 of HeLa 3+ cells (WT and PINK1 KO) were treated with O/A (5 μmol/L and 1 μmol/L, respectively) for 42 h and subjected to flow cytometry analysis. x-axis, GFP intensity; y-axis, cell count. (f) Immunoblotting analysis of the clone #31 samples from (e). (g) Dot plot representing the hits falling within the analysis criteria. Red data points represent PINK1 and Parkin. Blue data points represent genes involved in zinc finger gene regulation. Orange data points represent genes involved in SUMOylation. Green data points represent subunits of the vacuolar ATPase (V-ATPase). Yellow data point represents G6PD.
Figure 2
Figure 2
Identification of G6PD as a positive regulator of mitophagy. (a) The PPP. G6PD is the rate-limiting enzyme converting G6P to 6-phosphogluconolactone. (b) Changes in mCherry-Parkin translocation measured by live cell imaging. WT and G6PD KO HeLa 3+ cells were treated with O/A (5 μmol/L and 1 μmol/L, respectively) for 4 h. Live images were taken with a Leica fluorescence microscope. Scale bar: 20 μm. (c) Detection of mitochondrial protein levels by immunoblotting analysis. WT and G6PD KO HeLa 3+ cells were treated with O/A (5 μmol/L and 1 μmol/L, respectively) for indicated time points and subjected to immunoblotting analysis. (d) Quantification of mito-GFP and MFN1 levels in lysates after 42-h O/A treatment as seen in (c). Fold change was calculated using wild-type, untreated cells as the baseline. (e) Changes in mCherry-Parkin translocation measured by live cell imaging. G6PD KO HeLa 3+ cells were transfected with WT G6PD for 24 h. Cells were treated with O/A (5 μmol/L and 1 μmol/L, respectively) for 4 h. Images were taken with a Leica fluorescence microscope. Scale bar: 20 μm. (f) Detection of mitochondrial protein levels. G6PD KO HeLa 3+ cells were transfected with WT G6PD for 24 h. Cells were then treated with O/A (5 μmol/L and 1 μmol/L, respectively) for 4 h and subjected to immunoblotting analysis. RE: reconstituted. (g) Quantification of MFN1 levels in G6PD KO and reconstituted cell lysates as seen in (f). Fold change was calculated using wild-type, untreated cells as the baseline. RE: reconstituted. Data in (d) and (g) are presented as mean ± SD of three independent experiments. ns: not significant; *P < 0.05; ***P < 0.001.
Figure 3
Figure 3
The involvement of G6PD in mitophagy is independent of its known role in the PPP. (a) Changes in mCherry-Parkin translocation measured by live cell imaging. HeLa 3+ cells were treated with glucose starvation media (GS) or glucose starvation media supplemented with 5 mmol/L 2-DG (GS + 2-DG) for 2 h. Cells were then treated with O/A (5 μmol/L and 1 μmol/L, respectively) for 4 h, and live images were taken with a Leica fluorescence microscope. Scale bar: 20 μm. (b) SDS-PAGE and western blotting analysis of cells treated as in (a) and collected at indicated time points. (c) Changes in mCherry-Parkin translocation measured by live cell imaging. PGLS KO HeLa 3+ cells were created using the CRISPR-Cas9 system. Cells were treated with O/A (5 μmol/L and 1 μmol/L, respectively) for 4 h and live cell fluorescence imaging was conducted. Scale bar: 20 μm. (d) Detection of mitochondrial protein levels. PGLS KO HeLa 3+ cells were treated with O/A (5 μmol/L and 1 μmol/L, respectively) for the indicated time points. Lysates were subjected to SDS-PAGE and western blotting analysis. (e) Quantification of MFN1 levels in cells treated with O/A (5 μmol/L and 1 μmol/L, respectively) for 4 h. Fold change was calculated using wild-type, untreated cells as the baseline. (f) Changes in mCherry-Parkin translocation measured by live cell imaging. HeLa 3+ cells (WT and G6PD KO) were treated with NAC (10 mmol/L) and O/A (5 μmol/L and 1 μmol/L, respectively) for 4 h. Cells were subjected to live cell imaging. Scale bar: 20 μm. (g) Cells were treated as in (f) and subjected to SDS-PAGE and western blotting analysis. (h) Quantification of MFN1 levels in O/A-treated cells as seen in (g). Fold change was calculated using wild-type, untreated cells as the baseline. Data in (e) and (h) are presented as mean ± SD of three independent experiments. ns: not significant; *P < 0.05; **P < 0.01; ***P < 0.001.
Figure 4
Figure 4
G6PD catalytic activity is required for functional mitophagy. (a) mCherry-Parkin translocation visualized by live cell imaging. HeLa 3+ cells were pretreated with G6PD inhibitors DHEA (500 μmol/L) or 6-AN (1 mmol/L) for 1 h before O/A (5 μmol/L and 1 μmol/L, respectively) treatment for 2 h. Cells were subjected to live cell imaging. G6PD KO cells were used as a negative control. Scale bar: 20 μm. (b) Detection of mitochondrial protein levels. HeLa 3+ cells were treated as in (a). Lysates were subjected to SDS-PAGE and immunoblotting analysis. G6PD KO cells were used as a negative control. (c) Detection of Parkin translocation with live cell imaging. HeLa 3+ cells were pretreated with Bay-11-7082 (BAY, 10 μmol/L), parthenolide (PAR, 25 μmol/L), or wedelolactone (WED, 50 μmol/L) for 1 h, followed by O/A (5 μmol/L and 1 μmol/L, respectively) treatment for 2 h. G6PD KO cells were used as a negative control. Scale bar: 20 μm. (d) Detection of mitochondrial protein levels. Cells were treated as in (c) and lysates were immunoblotted with indicated antibodies. G6PD KO cells were used as a negative control.
Figure 5
Figure 5
G6PD is involved in PINK1 stabilization and ubiquitin phosphorylation. (a−f) Detection of p-Ub and PINK1 protein levels by immunoblotting analysis. (a) WT and G6PD KO HeLa 3+ cells were treated with O/A (5 μmol/L and 1 μmol/L, respectively) for the indicated time points and subjected to immunoblotting analysis. (b) G6PD KO HeLa 3+ cells were transfected with WT G6PD for 24 h. Cells were then treated with O/A (5 μmol/L and 1 μmol/L, respectively) for 4 h and subjected to immunoblotting analysis. RE: reconstituted. (c) WT, G6PD KO, and PGLS KO HeLa 3+ cells were treated with O/A (5 μmol/L and 1 μmol/L, respectively) for 4 h. Lysates were subjected to immunoblot analysis. (d) HeLa 3+ cells were pretreated with G6PD inhibitors DHEA (500 μmol/L) or 6-AN (1 mmol/L) for 1 h before O/A (5 μmol/L and 1 μmol/L, respectively) treatment for 2 h. G6PD KO cells were used as a negative control. (e) HeLa 3+ cells were pretreated with BAY (10 μmol/L), PAR (25 μmol/L), or WED (50 μmol/L) for 1 h followed by O/A (5 μmol/L and 1 μmol/L, respectively) treatment for 2 h. G6PD KO cells were used as a negative control. Loading control is shared with Fig. 4d. (f) WT and G6PD KO HeLa 3+ cells were pretreated with AG1 (20 μmol/L) for 1 h before O/A (5 μmol/L and 1 μmol/L, respectively) treatment for 4 h. (g) Visualization of mCherry-Parkin translocation by live cell imaging. HeLa 3+ (WT and PINK1 KO) cells were pretreated with AG1 (20 μmol/L) for 1 h before O/A (5 μmol/L and 1 μmol/L, respectively) treatment for 2 h. Images were taken using a Leica fluorescence microscope. Scale bar: 20 μm. (h) Detection of mitochondrial protein levels by immunoblotting. HeLa 3+ (WT and PINK1 KO) cells were pretreated with AG1 (20 μmol/L) for 1 h before O/A (5 μmol/L and 1 μmol/L, respectively) treatment for 4 h. Lysates were subjected to immunoblotting analysis with the indicated antibodies. (i) Mitochondrial protein levels in G6PD-overexpressing cells. G6PD KO and PINK1 KO HeLa 3+ cells were transfected with WT G6PD for 24 h. Cells were treated with O/A (5 μmol/L and 1 μmol/L, respectively) for 4 h before lysis and immunoblotting analysis. (j) Cleaved PINK1 levels observed by immunoblotting analysis. HeLa 3+ (WT and G6PD KO) cells were pretreated with MG132 (10 μmol/L) for 1 h before being treated with O/A (5 μmol/L and 1 μmol/L, respectively) for 4 h. Lysates were immunoblotted with the indicated antibodies.
Figure 6
Figure 6
G6PD interacts with the mitophagy machinery. (a) Mitochondrial G6PD levels detected by immunoblotting analysis. HeLa 3+ cells were treated with O/A (5 μmol/L and 1 μmol/L, respectively) for 1 h or 2 h. Cells were subjected to fractionation by sucrose gradient centrifugation and immunoblotted with the indicated antibodies. Sample loading was standardized to the whole cell lysate. GAPDH, cytosolic marker; TIM23, mitochondrial marker. WCL, whole cell lysate; Cyto, cytosol; Mito, mitochondria. (b) PLA performed on YFP-Parkin HeLa cells. Cells were treated with O/A (5 μmol/L and 1 μmol/L, respectively) for 90 min. Assay was performed using G6PD and TOM20 primary antibodies. Red, PLA signal; gray (pseudocoloured), YFP-Parkin; blue, DAPI. Scale bar: 20 μm. (c) Visualization of G6PD mitochondrial localization by proteinase K protection assay. HeLa 3+ cells were treated with O/A (5 μmol/L and 1 μmol/L, respectively) for 90 min and subjected to fractionation by sucrose gradient centrifugation. The mitochondrial fraction was divided and treated with the indicated concentrations of digitonin and proteinase K. Samples were then subjected to immunoblotting analysis. (d) PLA performed on YFP-Parkin HeLa cells. Cells were treated with O/A (5 μmol/L and 1 μmol/L, respectively) for 90 min. Assay was performed using G6PD and PINK1 primary antibodies. Red, PLA signal; gray (pseudocoloured), YFP-Parkin; blue, DAPI. Scale bar: 20 μm. (e) Immunoprecipitation of overexpressed myc-PINK1 with endogenous G6PD. HeLa 3+ cells were transfected with myc-PINK1 for 24 h. Cells were treated with O/A (5 μmol/L and 1 μmol/L, respectively) for 90 min and lysed in IP lysis buffer. Lysates were subjected to IP with agarose-conjugated G6PD antibody and blotted with the indicated antibodies. (f) In vitro pull-down assay between G6PD and PINK1. HeLa mCherry-Parkin cells were transfected with FLAG-tagged G6PD. FLAG-G6PD protein was isolated using FLAG M2 beads and incubated with recombinant human PINK1 protein. Samples were subjected to SDS-PAGE and western blotting analysis to visualize pull-down of PINK1.
Figure 7
Figure 7
G6PD-mediated mitophagy is required to maintain cell viability during mitochondrial stress. (a) Detection of cell viability using bright field imaging. WT and G6PD KO HeLa 3+ cells were treated with O/A (5 μmol/L and 1 μmol/L, respectively) for indicated time points and subjected to bright field imaging. Scale bar: 200 μm. (b) Quantification of the data from (a). At least 500 cells per sample, for three independent samples, were counted by trypan blue exclusion. Only data from 0, 8, 24, and 42 h time points are presented. (c) Cell viability of G6PD KO HeLa 3+ cells reconstituted with WT G6PD. G6PD KO HeLa 3+ cells were transfected with WT G6PD for 24 h. Cells were then treated with O/A (5 μmol/L and 1 μmol/L, respectively) for 24 h. At least 500 cells per sample, for three independent samples, were counted by trypan blue exclusion. RE: reconstituted. (d) Protein levels observed by immunoblotting analysis. HeLa 3+ (WT and G6PD KO) cells were pretreated with Spautin-1 (10 μmol/L) for 1 h before being treated with O/A (5 μmol/L and 1 μmol/L, respectively) for 4 h. Lysates were subjected to SDS-PAGE and western blotting analysis with the indicated antibodies. (e) Quantification of p-Ub (top) and PINK1 (bottom) levels as seen in (d). Fold change was calculated using wild-type, untreated cells as the baseline. (f) Cell viability of G6PD KO cells treated with Spautin-1. HeLa 3+ (WT and G6PD KO) cells were pretreated with Spautin-1 (10 μmol/L) for 1 h before being treated with O/A (5 μmol/L and 1 μmol/L, respectively) for 16 h. At least 500 cells per sample, for three independent samples, were counted by trypan blue exclusion. The data in (b), (c), (e), and (f) are presented as mean ± SD of three independent experiments. ns: not significant. *P < 0.05; **P < 0.005; ***P < 0.001. (g) Proposed mechanism of regulation of mitophagy by G6PD. In healthy mitochondria, PINK1 is cleaved by TIM23 and MPP at the IMM and degraded by the proteasome. In damaged mitochondria, i.e. under O/A treatment, PINK1 is stabilized on the OMM and phosphorylates Parkin and Ub. G6PD interacts with this mitochondrial PINK1 to facilitate its stabilization and activity. Created with BioRender.com.

References

    1. Mizushima N. A brief history of autophagy from cell biology to physiology and disease. Nat Cell Biol 2018;20:521–7. - PubMed
    1. Yamamoto H, Zhang S, Mizushima N.. Autophagy genes in biology and disease. Nat Rev Genet 2023;24:382–400. - PMC - PubMed
    1. Dikic I, Elazar Z.. Mechanism and medical implications of mammalian autophagy. Nat Rev Mol Cell Biol 2018;19:349–64. - PubMed
    1. Metur SP, Klionsky DJ.. Nutrient-dependent signaling pathways that control autophagy in yeast. FEBS Lett 2024;598:32–47. - PMC - PubMed
    1. He C. Balancing nutrient and energy demand and supply via autophagy. Curr Biol 2022;32:R684–96. - PMC - PubMed

LinkOut - more resources