. 2025 Feb 5;229(2):iyae218.
doi: 10.1093/genetics/iyae218.

Spatially explicit estimation of recent migration rates in plants using genotypic data

Affiliations

Spatially explicit estimation of recent migration rates in plants using genotypic data

Igor J Chybicki et al. Genetics. .

Abstract

We present a new hierarchical Bayesian method using multilocus genotypes to estimate recent seed and pollen migration rates in a spatially explicit framework that incorporates distance effects separately for each type of dispersal. The method additionally estimates population allelic frequencies, population divergence values, individual inbreeding coefficients, individual maternal and paternal ancestries, and allelic dropout rates. We conduct a numerical simulation analysis that indicates that the method can provide reliable estimates of seed and pollen migration rates and allow accurate inference of spatial effects on migration, at affordable sample sizes (25-50 individuals/population) when population genetic divergence is not low (FST≥0.05), or by increasing sampling (to at least 100 individuals/population) under weaker levels of divergence (FST=0.025). Simulations also show that the accuracy provided by assays with about one thousand unlinked polymorphic SNP loci may approach, for a given sample size, the theoretical maximum achievable under categorical origin discrimination. We apply our method to Taxus baccata data, revealing low but significant seed and pollen migration among nearby population remnants during the last generation, with a negative effect of interpopulation distance on migration that was detectable for pollen but not for seeds.

Keywords: Taxus baccata; gene flow; isolation by distance; seed and pollen dispersal; zygotic and gametic migration.


Conflict of interest statement

Conflicts of interest: The authors declare no conflicts of interest.

Figures
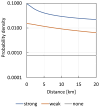
Fig. 1.
Fig. 1.
Probability density functions of migration distances from a population source (dispersal kernels) assumed in the simulations. Note the logarithmic scale on the y-axis. Each kernel was obtained by setting a different distance effect parameter (b) value, in order to simulate contrasting isolation by distance patterns: strong (b = 2.1274), weak (b = 1.2062), and null (b = 0). The probability of migration beyond 20 km was assumed negligible (see Supplement C in Supplementary File 1).
Fig. 2.
Fig. 2.
Estimated vs simulated seed and pollen migration rates assuming SSR-type markers. Panel rows illustrate the effect on migration estimates of genetic discrimination power: the top row shows benchmark scenarios with ideal categorical discrimination, while the following four assume, in descending order, FST = 0.20, 0.10, 0.05, and 0.025, respectively. Panel columns show the effect of decreasing total sample size, in pairs from left to right: N = 1,000 (columns 1 and 2), N = 500 (columns 3 and 4), and N = 250 (columns 5 and 6). Based on 10 (or 100 in scenarios with categorical discrimination) independent simulations replicates per scenario, assuming L = 20 loci, 6 alleles/locus, K = 10 populations, no inbreeding (μF=0), no distance effect on migration, isolation parameters τα=τβ=0.25, and dispersion parameters γα=γβ=γF=0.1 and γFST=0.01.
Fig. 3.
Fig. 3.
Estimated vs simulated seed and pollen migration rates assuming SNP-type markers. Panel rows illustrate the effect on migration estimates of genetic discrimination power: the top row shows benchmark scenarios with ideal categorical discrimination, while the following 4 assume, in descending order, FST = 0.20, 0.10, 0.05, and 0.025, respectively. Panel columns show the effect of decreasing total sample size, in pairs from left to right: N = 1,000 (columns 1 and 2), N = 500 (columns 3 and 4), and N = 250 (columns 5 and 6). Based on 10 (or 100 in scenarios with categorical discrimination) independent simulations replicates per scenario, assuming L = 1,000 loci, 2 alleles/locus, K = 10 populations, no inbreeding (μF=0), no distance effect on migration, isolation parameters τα=τβ=0.25, and dispersion parameters γα=γβ=γF=0.1 and γFST=0.01.
Fig. 4.
Fig. 4.
Posterior estimates of seed and pollen migration rates among nine T. baccata remnant populations. Vertical bars in the left panels correspond to different local populations, with colors indicating the estimated proportions of seed or pollen from different population origins (the dominant color in each bar corresponds to the local population). Right panels show estimated pairwise migration rates as a function of interpopulation distance, with colors distinguishing estimates for each recipient population (as indicated by the dominant colors in the bar plots).

References

    1. Adams WT, Griffin AR, Moran GF. 1992. Using paternity analysis to measure effective pollen dispersal in plant populations. Am Nat. 140(5):762–780. doi:10.1086/285439. - DOI - PubMed
    1. Aguilée R, Raoul G, Rousset F, Ronce O. 2016. Pollen dispersal slows geographical range shift and accelerates ecological niche shift under climate change. Proc Natl Acad Sci U S A. 113(39):E5741–E5748. doi:10.1073/pnas.1607612113. - DOI - PMC - PubMed
    1. Aguilée R, Shaw FH, Rousset F, Shaw RG, Ronce O. 2013. How does pollen versus seed dispersal affect niche evolution? Evolution. 67(3):792–805. doi:10.1111/j.1558-5646.2012.01816.x. - DOI - PubMed
    1. Balding DJ, Nichols RA. 1997. Significant genetic correlations among Caucasians at forensic DNA loci. Heredity (Edinb). 78(Pt 6):583–589. doi:10.1038/hdy.1997.97. - DOI - PubMed
    1. Bishop JDD, Pemberton AJ. 2006. The third way: spermcast mating in sessile marine invertebrates. Integr Comp Biol. 46(4):398–406. doi:10.1093/icb/icj037. - DOI - PubMed

LinkOut - more resources