. 2025 Feb;34(2):e5243.
doi: 10.1002/pro.5243.

Investigation into the effect of phenylalanine gating on anaerobic haem breakdown using the energy landscape approach

Affiliations

Investigation into the effect of phenylalanine gating on anaerobic haem breakdown using the energy landscape approach

Alasdair D Keith et al. Protein Sci. 2025 Feb.

Abstract

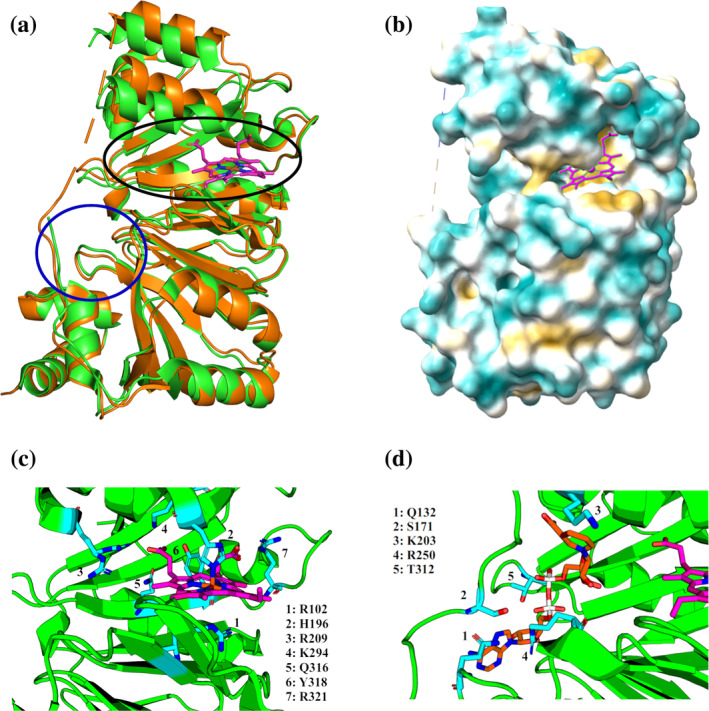
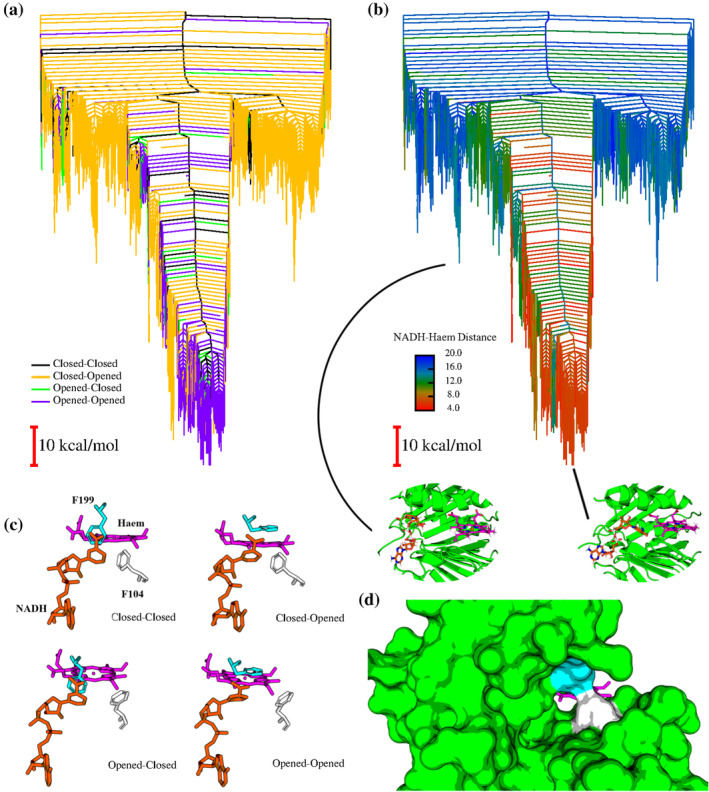
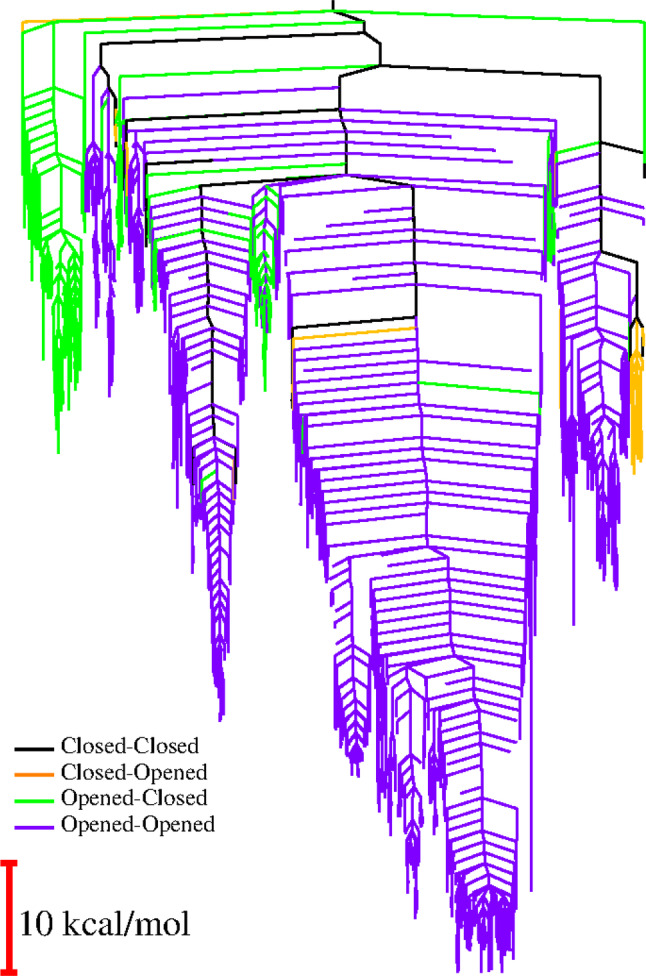
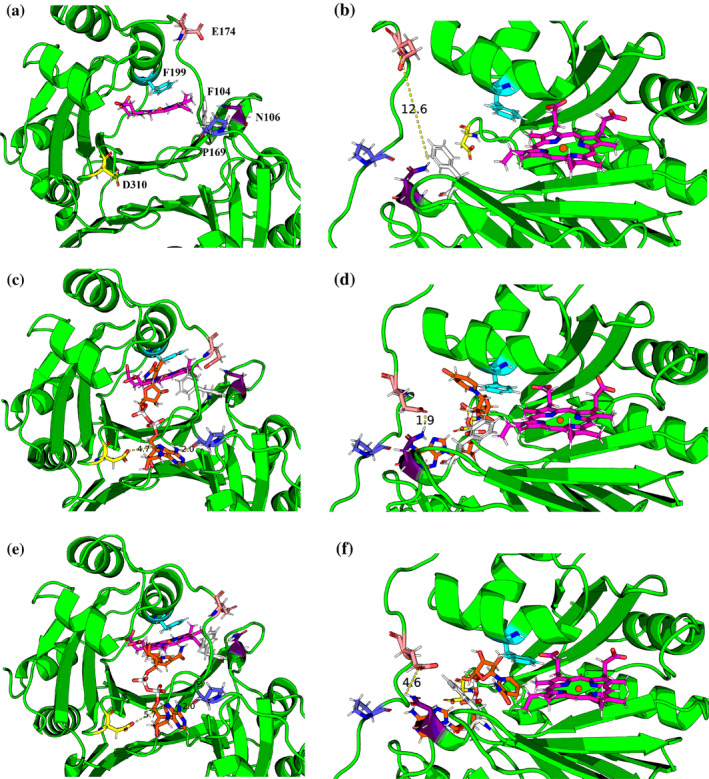
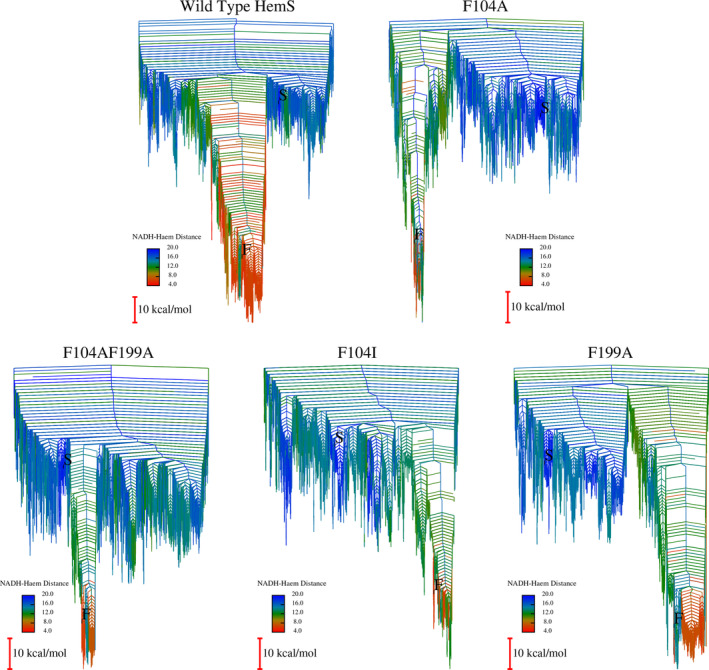
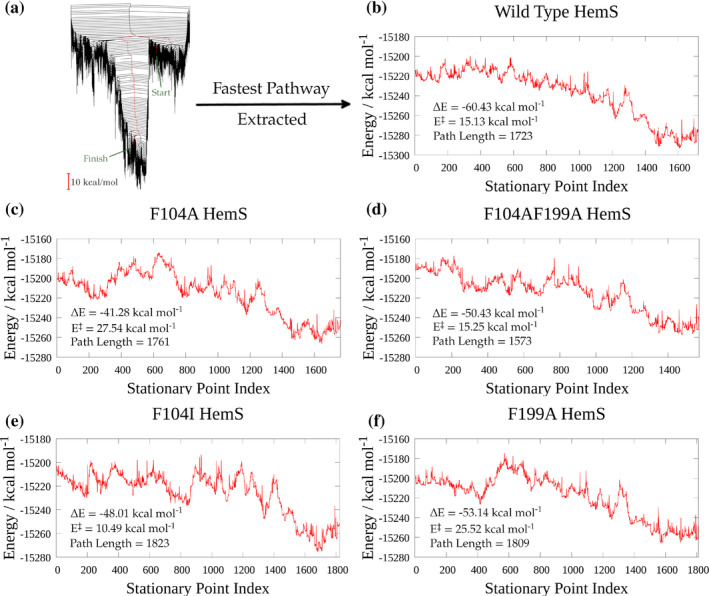
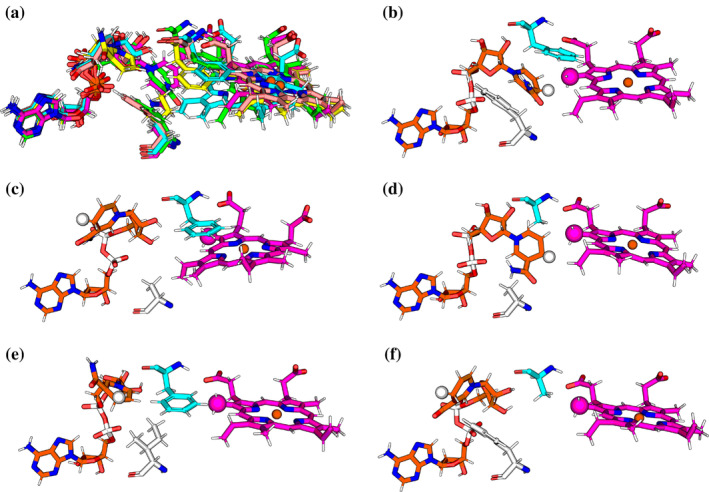
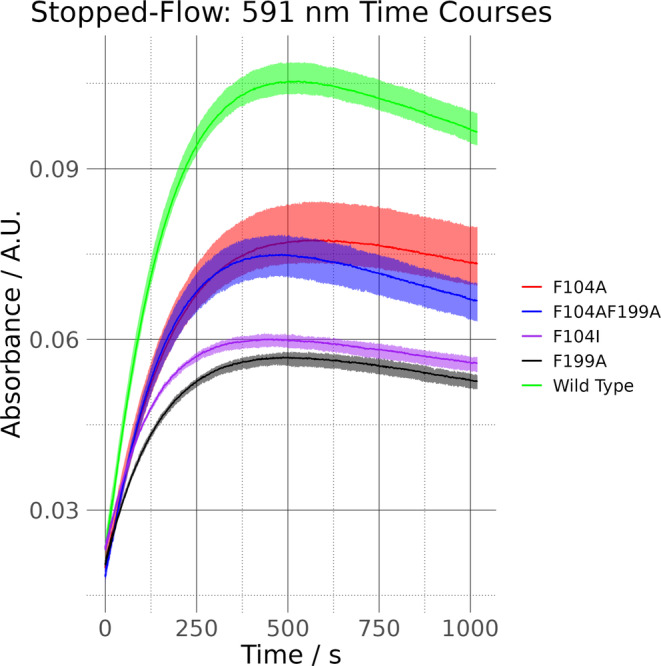
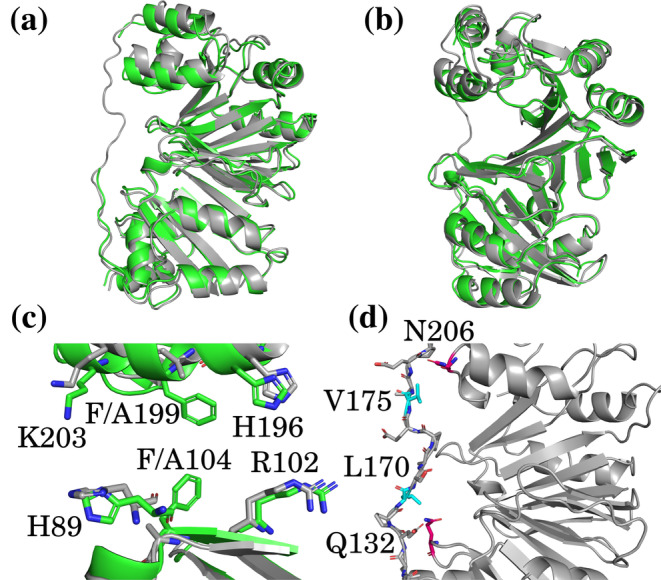
We have recently demonstrated a novel anaerobic NADH-dependent haem breakdown reaction, which is carried out by a range of haemoproteins. The Yersinia enterocolitica protein, HemS, is the focus of further research presented in the current paper. Using conventional experimental methods, bioinformatics, and energy landscape theory (ELT), we provide new insight into the mechanism of the novel breakdown process. Of particular interest is the behavior of a double phenylalanine gate, which opens and closes according to the relative situations of haem and NADH within the protein pocket. This behavior suggests that the double phe-gate fulfills a regulatory role within the pocket, controlling the access of NADH to haem. Additionally, stopped-flow spectroscopy results provide kinetic comparisons between the wild-type and the selected mutants. We also present a fully resolved crystal structure for the F104AF199A HemS monomer, including its extensive loop, the first such structure to be completely resolved for HemS or any of its close homologues. The energy landscapes approach provided key information regarding the gating strategy employed by HemS, compensating for current limitations with conventional biophysical and molecular dynamics approaches. We propose that ELT become more widely used in the field, particularly in the investigation of the dynamics and interactions of weak-binding ligands, and for gating features, within protein cavities.

Keywords: HemS; Yersinia enterocolitica; biophysics; energy landscapes; heme; nicotinamide adenine dinucleotide (NADH); protein dynamics; protein gates; residue‐mediated regulation.


Conflict of interest statement

The authors declare no conflicts of interest.

Figures

FIGURE 1
FIGURE 1
HemS structure and ligand binding sites. (a) holo‐HemS (PDB: 2J0P, green) superimposed on apo‐HemS (PDB: 2J0R, burnt orange). Haem from the holo‐structure is shown in magenta. The black circle corresponds to the large cavity, and the blue circle to the small cavity. The unstructured loop is entirely missing from the holo‐structure and incomplete in the apo‐structure. The structural overlay clearly demonstrates the clamping effect HemS undergoes upon haem inclusion. (b) Space‐filling model of holo‐HemS, as calculated by Chimera (Pettersen et al. 2004). Residues are color‐coded, with cyan indicating hydrophilicity and yellow hydrophobicity. (c) Magnified representation of haem in the HemS pocket, with haem‐binding residues numbered and highlighted in cyan. (d) Magnified representation of NADH (orange) in the HemS pocket. Residues directly interacting with NADH are explicitly represented in cyan.
FIGURE 2
FIGURE 2
Double phe‐gate regulation of NADH access to haem. (top) Disconnectivity graphs depicting the energy landscape for WT HemS, haem and NADH. (a) Graph is color‐coded according to the conformations of the double phe‐gate residues, F104 and F199. See the methods for definitions of the opened and closed states. (b) Graph is color‐coded according to NADH–haem distance, given in Å. Two minima are highlighted, with their magnified images focused on the main cavity. The double phe‐gate is not explicitly shown to avoid crowding the visualization of the pocket. (c) Representations of possible double phe‐gate conformations. All protein atoms other than those depicting the gates have been removed for clarity. (d) Space‐filling representation of a fully closed double phe‐gate, from the perspective of NADH as it enters the pocket.
FIGURE 3
FIGURE 3
Disconnectivity graph of HemS + haem, color‐coded according to double phe‐gate conformation. The database is not as complete as the database of the system that includes NADH; nevertheless, general properties can still be identified. Comparison against the disconnectivity graph where NADH is present shows that, in the absence of NADH, minima typically favor both gates being opened, whereas when NADH is included, the closed‐opened conformation becomes most prevalent other than when NADH is close to haem.
FIGURE 4
FIGURE 4
Front (left) and side (right) views illustrating the long‐range effect of NADH‐binding on F104 conformation. Haem is represented with a magenta skeleton, NADH (where present) in orange, F104 in white, N106 in purple, P169 in blue, E174 in salmon, F199 in cyan, and D310 in yellow. (a, b) Selected representative minimum when NADH is absent. (c, d) Selected representative minimum when NADH occupies the edge of the pocket. (e, f) Selected representative minimum when NADH is extended into the pocket.
FIGURE 5
FIGURE 5
WT and mutated HemS disconnectivity graphs.
FIGURE 6
FIGURE 6
Fastest pathways, extracted using Dijkstra analysis (Dijkstra ; Evans and Wales 2004). (a) WT energy landscape, with the Dijkstra fastest pathway between minima S and F mapped in red. (b–f) Potential energy profiles of the fastest pathways between minima S and F, extracted from the respective energy landscapes for each mutation (see Figure 5 for these landscapes). In each pathway, the stationary point index denotes the interconnected minima and transition states connecting S (indexed as minimum 1) to F (the uppermost index). Therefore, minima are denoted as odd‐numbered indices, and transition states as even‐numbered indices. Thermodynamic changes, ΔE, energy differences between the highest energy transition states and the starting minima, E , and path lengths are superimposed on each pathway.
FIGURE 7
FIGURE 7
Lowest energy structures for WT and mutated HemS with haem and NADH, represented in a reduced form. Only haem, NADH and residues 104 and 199 of HemS are depicted. (a) Overlay of all structures shown in (b–f), where the WT system is depicted in green, F104A HemS in cyan, F104AF199A in magenta, F104I in yellow, and F199A in pink. (b–f) Reduced representations depicting haem (magenta), NADH (orange), and residues 104 (white) and 199 (cyan) of HemS. The (R)‐hydride of NADH and methyl C5 atom of haem are highlighted as enlarged spheres. (b) WT, C5‐hydride distance: 2.9 Å. (c) F104A, C5‐hydride distance: 12.3 Å. (d) F104AF199A, C5‐hydride distance: 3.4 Å. (e) F104I, C5‐hydride distance: 9.2 Å. (f) F199A, C5‐hydride distance: 12.9 Å.
FIGURE 8
FIGURE 8
Stopped‐flow spectroscopy time courses, tracking peak evolution at 591 nm over 1000 s. Assays were done in triplicate. Solid lines chart the average absorbance values, with the shaded envelopes encompassing the maximum and minimum values at each time point.
FIGURE 9
FIGURE 9
Crystal structures of WT (green) and F104AF199A (gray, PDB: 7QXV) HemS. (a, b) Overlaid structures, from two different perspectives. The WT unstructured loop is broken due to poor resolution of these connecting residues but the F104AF199A loop is complete. (c) Magnification of the main pocket, with key residues highlighted. (d) Magnification of the complete F104AF199A HemS extended loop. Key hydrophobic residues within this loop are highlighted in cyan, and the residues they engage in stabilizing interactions with are highlighted in magenta.
FIGURE 10
FIGURE 10
Methods of representing energy landscapes. (a) Standard, textbook representation of a potential energy surface. This type of representation is commonly insufficient for encapsulating the important features of a complicated biomolecular system with many degrees of freedom. (b–d) Pictorial correspondence between standard 2D‐representations of a potential energy surface and disconnectivity graphs for three different, simple energy landscape types (Wales 2003). E represents the system energy, and E n to energies at which a superbasin analysis was conducted. (b) “Palm tree” motif. (c) “Weeping willow” motif. (d) “Banyan tree” motif.

Similar articles

References

    1. Allen RJ, Valeriani C, Rein Ten Wolde P. Forward flux sampling for rare event simulations. J Phys Cond Matt. 2009;152:060901. - PubMed
    1. André AC, Debande L, Marteyn BS. The selective advantage of facultative anaerobes relies on their unique ability to cope with changing oxygen levels during infection. Cell Microbiol. 2021;23:1–8. - PubMed
    1. Arroyo‐Mañez P, Bikiel DE, Boechi L, Capece L, Di Lella S, Estrin DA, et al. Protein dynamics and ligand migration interplay as studied by computer simulation. Biochim Biophys Acta Proteins Proteom. 2011;1814:1054–1064. - PubMed
    1. Becker OM, Karplus M. The topology of multidimensional potential energy surfaces: theory and application to peptide structure and kinetics. J Chem Phys. 1997;106:1495–1517.
    1. Bernardi RC, Melo MCR, Schulten K. Enhanced sampling techniques in molecular dynamics simulations of biological systems. Biochim Biophys Acta. 2015;1850:872–877. - PMC - PubMed

MeSH terms

LinkOut - more resources