. 2025;85(1):72.
doi: 10.1140/epjc/s10052-024-13606-8. Epub 2025 Jan 24.

Measurement of multidifferential cross sections for dijet production in proton-proton collisions at s = 13 Te V

Collaborators, Affiliations

Measurement of multidifferential cross sections for dijet production in proton-proton collisions at s = 13 Te V

CMS Collaboration. Eur Phys J C Part Fields. 2025.

Abstract

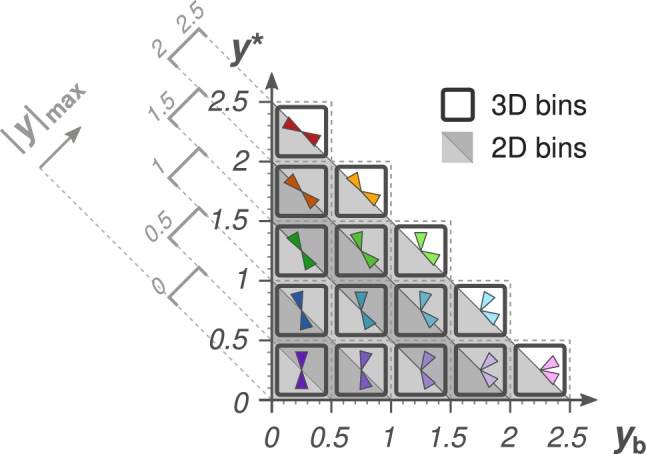
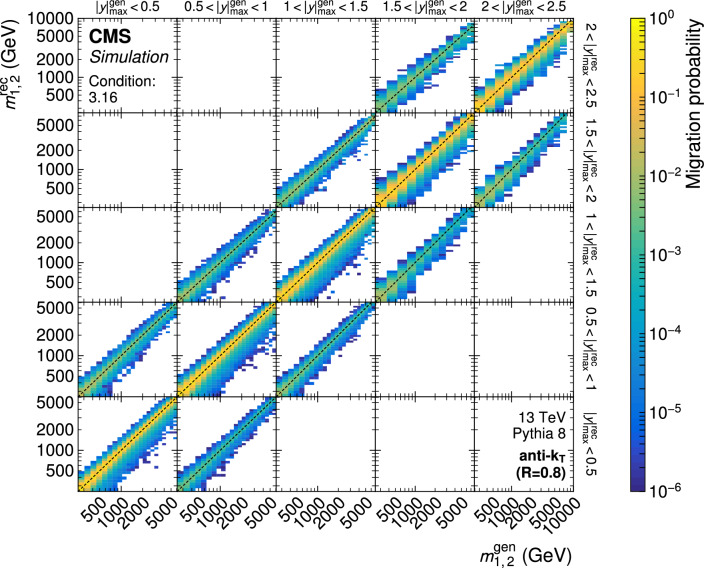
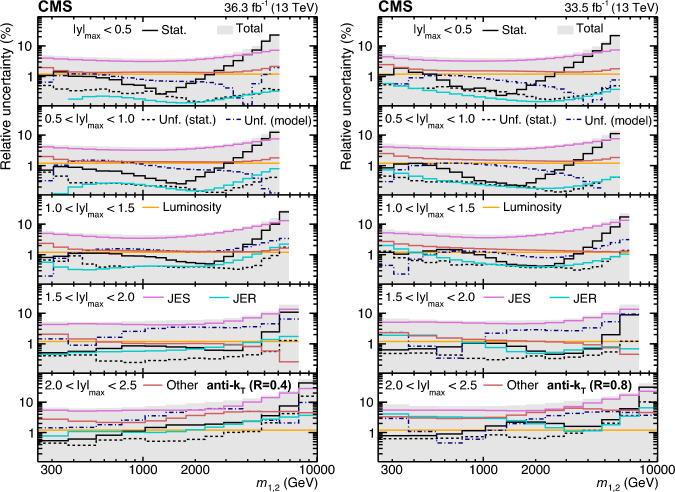
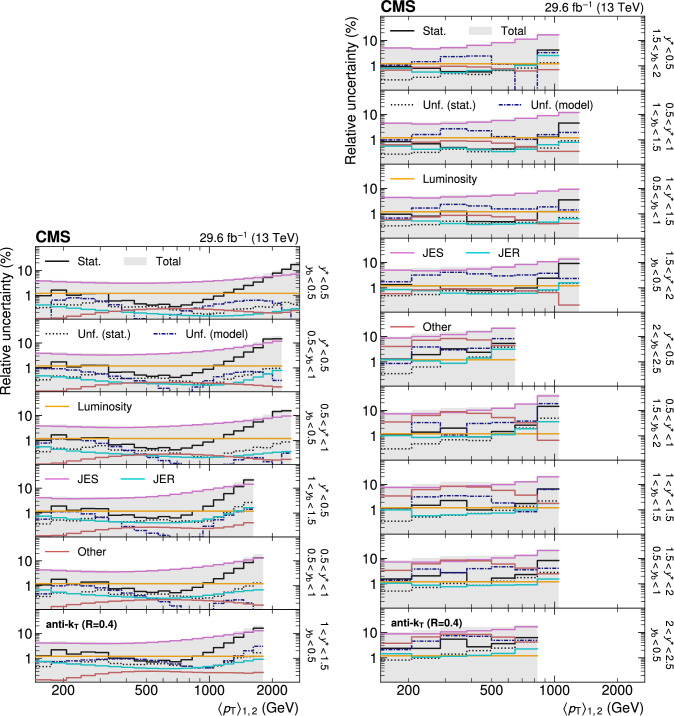
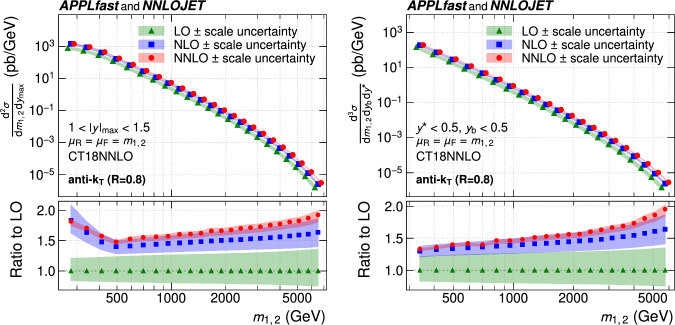
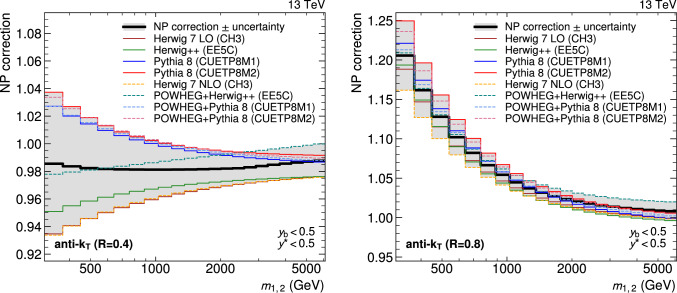
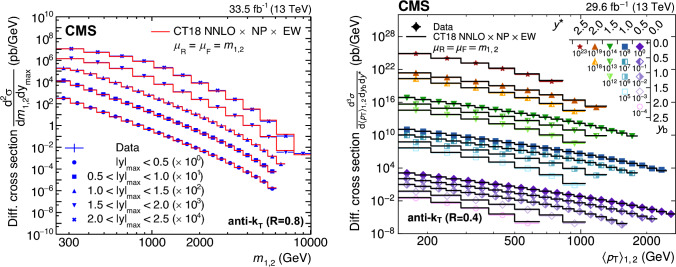
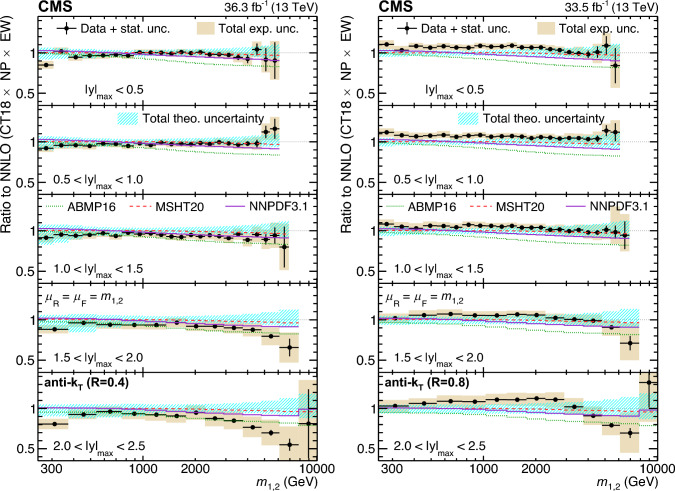
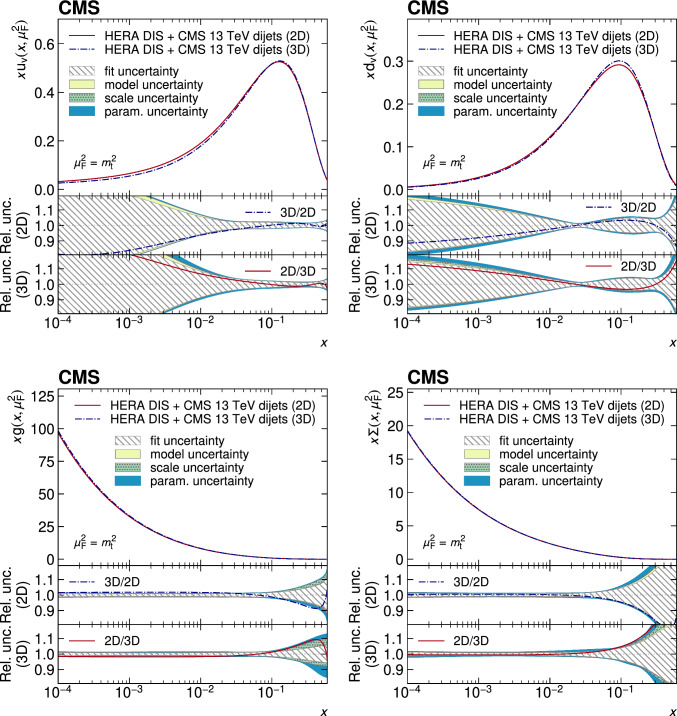
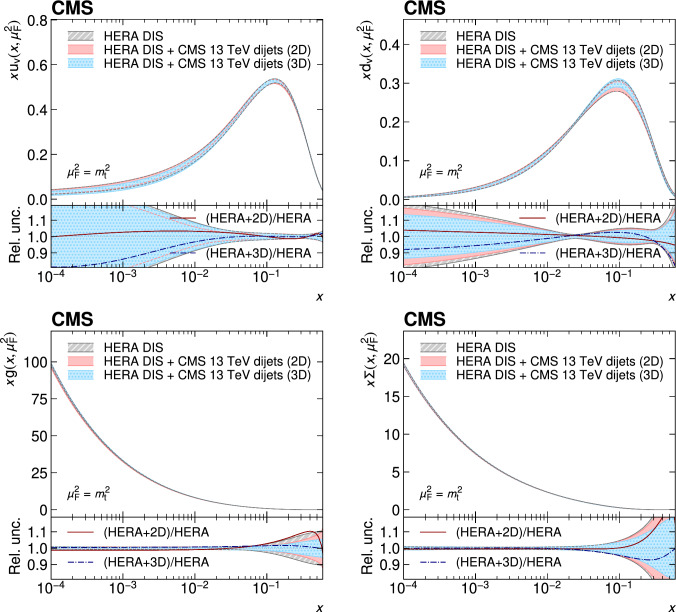
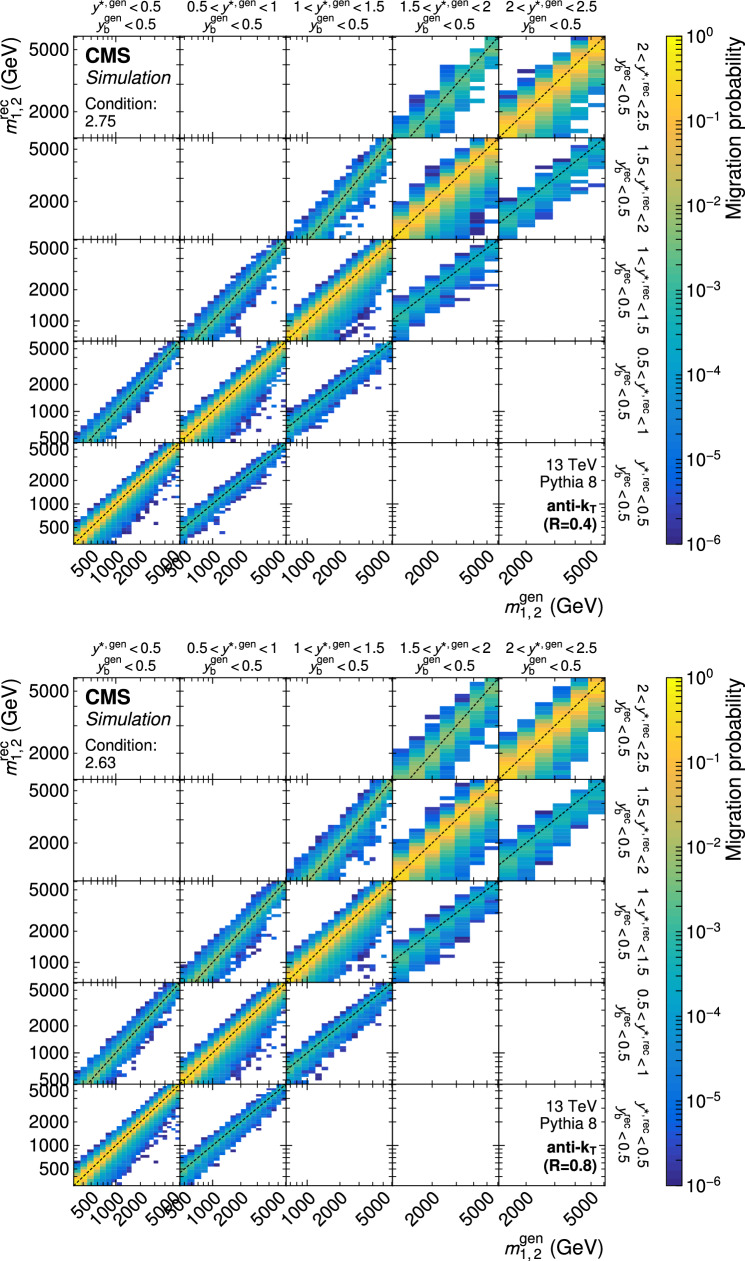
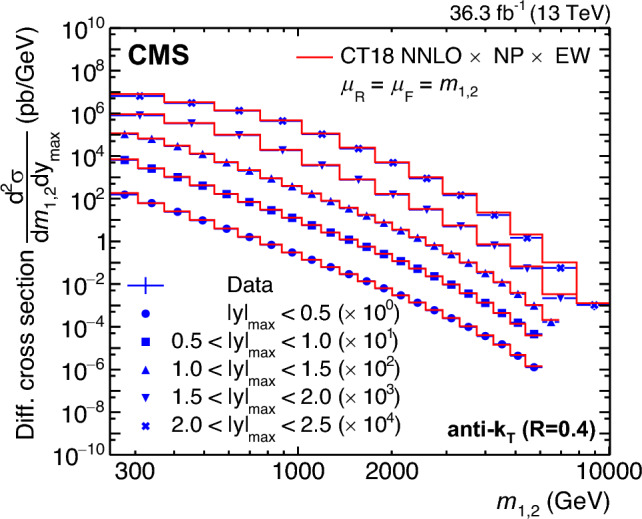
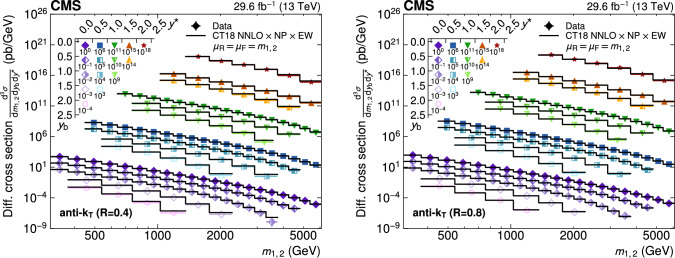
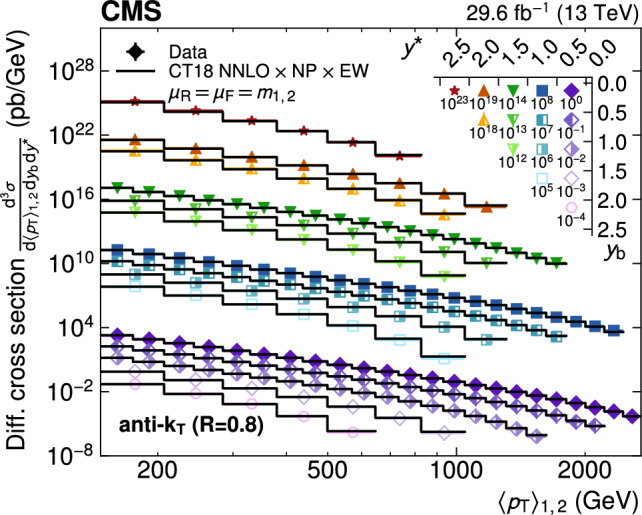
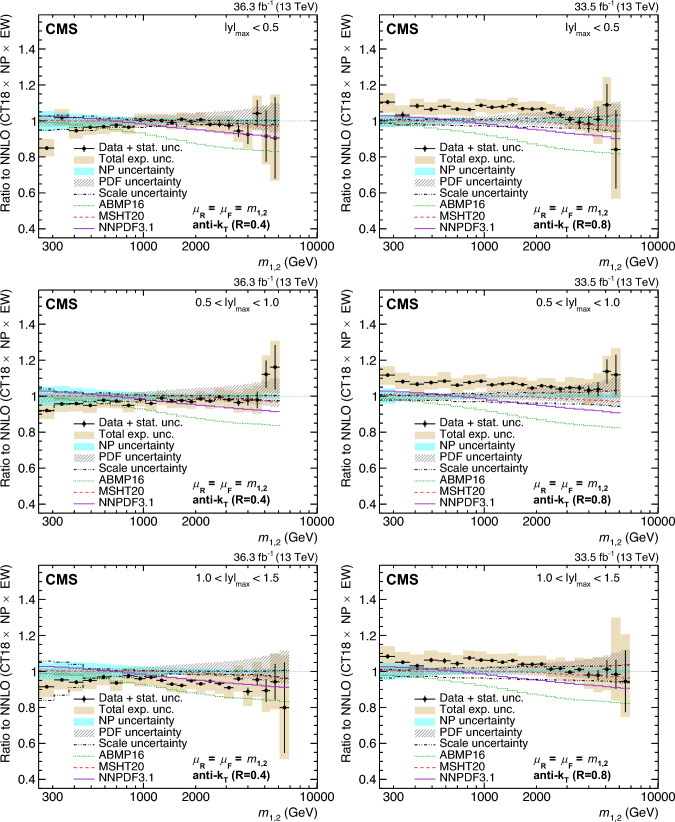
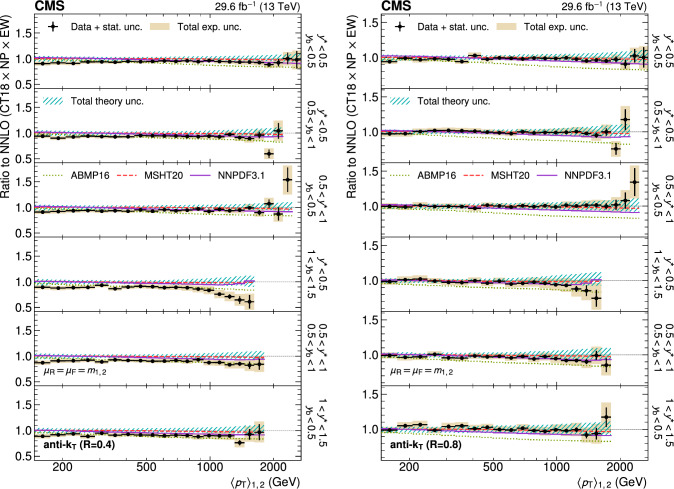
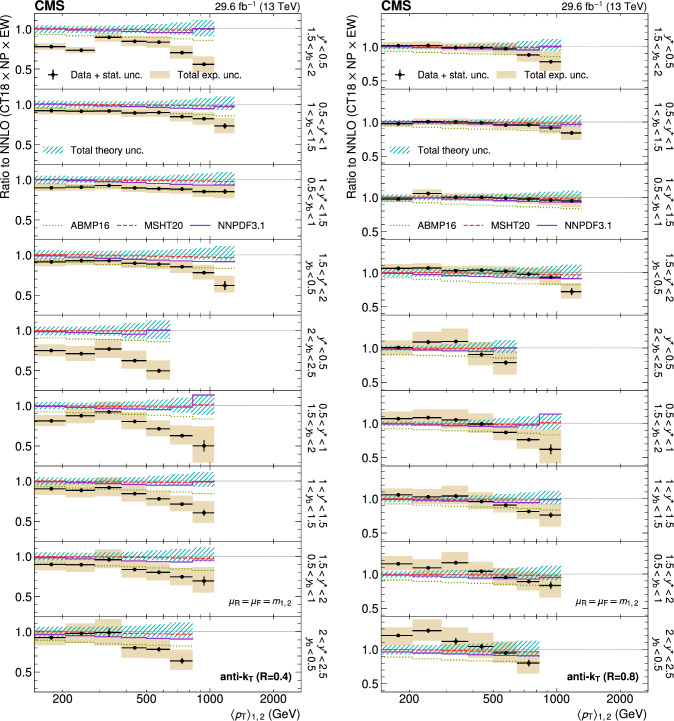
A measurement of the dijet production cross section is reported based on proton-proton collision data collected in 2016 at s = 13 Te V by the CMS experiment at the CERN LHC, corresponding to an integrated luminosity of up to 36.3 fb - 1 . Jets are reconstructed with the anti- k T algorithm for distance parameters of R = 0.4 and 0.8. Cross sections are measured double-differentially (2D) as a function of the largest absolute rapidity | y | max of the two jets with the highest transverse momenta p T and their invariant mass m 1 , 2 , and triple-differentially (3D) as a function of the rapidity separation y , the total boost y b , and either m 1 , 2 or the average p T of the two jets. The cross sections are unfolded to correct for detector effects and are compared with fixed-order calculations derived at next-to-next-to-leading order in perturbative quantum chromodynamics. The impact of the measurements on the parton distribution functions and the strong coupling constant at the mass of the Z boson is investigated, yielding a value of α S ( m Z ) = 0.1179 ± 0.0019 .


Conflict of interest statement

Conflict of interestThe authors declare that they have no Conflict of interest.

Figures

Fig. 1
Fig. 1
Illustration of the dijet rapidity phase space, highlighting the relationship between the variables used for the 2D and 3D measurements. The colored triangles are suggestive of the orientation of the two jets in the different phase space regions in the laboratory frame, assuming that the beam line runs horizontally
Fig. 2
Fig. 2
Response matrix for the 2D measurement as a function of m1,2 using jets with R=0.8. The entries represent the probability for a dijet event generated in the phase space region (m1,2gen, |y|maxgen) indicated on the x axis to be reconstructed in the phase space region (m1,2rec, |y|maxrec) indicated on the y axis. Response matrices for all other jet sizes and observables can be found in Appendix 1
Fig. 3
Fig. 3
Breakdown of the experimental uncertainty for the 2D measurements as a function of m1,2 using jets with R=0.4 (left) and 0.8 (right). The individual components and abbreviations are explained in Sect. 7. The abbreviation “Unf.” refers to the unfolding uncertainties. The shaded area represents the sum in quadrature of all statistical and systematic uncertainty components
Fig. 4
Fig. 4
Breakdown of the experimental uncertainty for the 3D measurement as a function of pT1,2 using jets with R=0.4. The individual components and abbreviations are explained in Sect. 7. The shaded area represents the sum in quadrature of all statistical and systematic uncertainty components. Similar plots for all other jet sizes and observables can be found in Appendix B
Fig. 5
Fig. 5
Theoretical predictions for the 2D (upper) and 3D (lower) cross sections, as a function of m1,2, illustrated here in the rapidity regions 1.0<|y|max<1.5 and yb<0.5, y<0.5, together with the corresponding six-point scale uncertainty for μR=μF=m1,2 using the CT18 NNLO PDF set. In the upper panels, the curves and symbols are slightly shifted for better visibility. The lower panels show the ratio to the respective prediction at LO. The fluctuations in the NNLO predictions are due to the limited statistical precision of the calculation
Fig. 6
Fig. 6
Nonperturbative correction factors obtained for jets with R=0.4 (upper) and 0.8 (lower) as a function of m1,2, illustrated here in the rapidity region (yb<0.5, y<0.5). Individual correction factors are first derived from simulation using eight different MC configurations. The largest and smallest value obtained in each observable bin is then used to define the final correction factor and its associated uncertainty. The correction values are larger for jets with R=0.8, increasing to over 20% in the lowest m1,2 bin
Fig. 7
Fig. 7
Electroweak correction factors obtained for jets with R=0.4 (upper) and 0.8 (lower) as a function of m1,2 in the five different |y|max regions. The corrections depend strongly on the kinematic properties of the jets and are observed to be largest at central rapidities for m1,2>1TeV
Fig. 8
Fig. 8
Differential dijet cross sections, illustrated here for the 2D measurement as a function of m1,2 using jets with R=0.8 (upper), and the 3D measurement as a function of pT1,2 using jets with R=0.4 (lower). The markers and lines indicate the measured unfolded cross sections and the corresponding NNLO predictions, respectively. For better visibility, the values are scaled by a factor depending on the rapidity region, as indicated in the legend. Analogous plots for all other jet sizes and observables can be found in Appendix  B
Fig. 9
Fig. 9
Comparison of the 2D dijet cross section as a function of m1,2 to fixed-order theoretical calculations at NNLO, using jets with R=0.4 (left) and 0.8 (right). Shown are the ratios of the measured cross sections (markers) to the predictions obtained using the CT18 NNLO PDF set. The error bars and shaded yellow regions indicate the statistical and the total experimental uncertainties of the data, respectively, and the hatched teal band indicates the sum in quadrature of the PDF, NP, and scale uncertainties. Alternative theoretical predictions obtained using other global PDF sets are shown as colored lines. Similar plots for the individual rapidity regions can be found in Appendix B
Fig. 10
Fig. 10
Comparison of the 3D dijet cross section for jets with R=0.4 (left) and 0.8 (right) as a function of pT1,2 to fixed-order theoretical calculations at NNLO, shown here for three out of the total of 15 rapidity regions. The data points and predictions for alternative PDFs are analogous to those in Fig. 9. In addition, the separate contributions to the theory uncertainty due to the CT18 PDFs, NP corrections, and six-point scale variations are shown explicitly. Similar plots for all rapidity regions and observables can be found in Appendix  B
Fig. 11
Fig. 11
Parton distributions obtained in a fit to HERA DIS data together with the CMS 2D or 3D dijet measurements. The top panels show the PDFs of the up and down valence quarks (upper row), of the gluon (lower left), and of the total sea quarks (lower right) as a function of the fractional parton momentum x at a factorization scale equal to the top quark mass. The middle (lower) panels show the relative uncertainty contributions obtained for the 2D (3D) fit, as well as the ratios of the fitted central values
Fig. 12
Fig. 12
Parton distributions obtained in a fit to HERA DIS data together with the CMS dijet data, compared to a fit to HERA DIS data alone. Shown are the PDFs of the up and down valence quarks (upper row), of the gluon (lower left), and of the total sea quarks (lower right) as a function of the fractional parton momentum x at a factorization scale equal to the top quark mass. The bands indicate the fit uncertainty and are shown in the lower panels as a relative uncertainty with respect to the corresponding central values. The lines in the lower panels show the ratios between the fitted central values
Fig. 13
Fig. 13
Response matrices for the 2D measurements as a function of |y|max and m1,2 for jets with R=0.4. The details correspond to those of Fig. 2
Fig. 14
Fig. 14
Partial response matrices for the 3D measurements as a function of m1,2 using jets with R=0.4 (upper) and 0.8 (lower), shown here for the five rapidity regions with yb<0.5. The details correspond to those of Fig. 2
Fig. 15
Fig. 15
Partial response matrices for the 3D measurements as a function of pT1,2 using jets with R=0.4 (upper) and 0.8 (lower), shown here for the five rapidity regions with yb<0.5. The details correspond to those of Fig. 2
Fig. 16
Fig. 16
Overview of the 2D dijet cross section as a function of m1,2 in all 5 |y|max regions, using jets with R=0.4. The details correspond to those of Fig. 8
Fig. 17
Fig. 17
Overview of the 3D dijet cross section as a function of m1,2 in all 15 (y,yb) regions, using jets with R=0.4 (left) and 0.8 (right). The details correspond to those of Fig. 8
Fig. 18
Fig. 18
Overview of the 3D dijet cross section as a function of pT1,2 in all 15 (y,yb) regions, using jets with R=0.8. The details correspond to those of Fig. 8
Fig. 19
Fig. 19
Breakdown of the experimental uncertainty for the 3D measurements as a function of m1,2 using jets with R=0.4 (left) and 0.8 (right), in six out of 15 (y,yb) bins. The details correspond to those of Fig. 4
Fig. 20
Fig. 20
(continuation of Fig. 19) Breakdown of the experimental uncertainty for the 3D measurements as a function of m1,2 using jets with R=0.4 (left) and 0.8 (right), in the remaining nine out of 15 (y,yb) bins. The details correspond to those of Fig. 4
Fig. 21
Fig. 21
Breakdown of the experimental uncertainty for the 3D measurements as a function of pT1,2 using jets with R=0.8, in six out of 15 (y,yb) bins. The details correspond to those of Fig. 4
Fig. 22
Fig. 22
(continuation of Fig. 21) Breakdown of the experimental uncertainty for the 3D measurements as a function of pT1,2 using jets with R=0.8, in the remaining nine out of 15 (y,yb) bins. The details correspond to those of Fig. 4
Fig. 23
Fig. 23
Comparison of the 2D dijet cross section for jets with R=0.4 (left) and 0.8 (right) as a function of m1,2 to fixed-order theoretical calculations at NNLO, shown here for three inner |y|max regions. The details correspond to those of Fig. 9
Fig. 24
Fig. 24
(continuation of Fig. 23) Comparison of the 2D dijet cross section for jets with R=0.4 (left) and 0.8 (right) as a function of m1,2 to fixed-order theoretical calculations at NNLO, shown here for two outermost |y|max regions. The details correspond to those of Fig. 9
Fig. 25
Fig. 25
Comparison of the 3D dijet cross section as a function of m1,2 to fixed-order theoretical calculations at NNLO, using jets with R=0.4 (left) and 0.8 (right), in six out of the total 15 (y,yb) bins. The details correspond to those of Fig. 10
Fig. 26
Fig. 26
(continuation of Fig. 25) Comparison of the 3D dijet cross section as a function of m1,2 to fixed-order theoretical calculations at NNLO, using jets with R=0.4 (left) and 0.8 (right), in the remaining nine out of 15 (y,yb) bins. The details correspond to those of Fig. 10
Fig. 27
Fig. 27
Comparison of the 3D dijet cross section as a function of pT1,2 to fixed-order theoretical calculations at NNLO, using jets with R=0.4 (left) and 0.8 (right), in six out of the total 15 (y,yb) bins. The details correspond to those of Fig. 10
Fig. 28
Fig. 28
(continuation of Fig. 27) Comparison of the 3D dijet cross section as a function of pT1,2 to fixed-order theoretical calculations at NNLO, using jets with R=0.4 (left) and 0.8 (right), in the remaining nine out of 15 (y,yb) bins. The details correspond to those of Fig. 10

Similar articles

  • Measurement of the triple-differential dijet cross section in proton-proton collisions at s = 8 TeV and constraints on parton distribution functions.
    Sirunyan AM, Tumasyan A, Adam W, Asilar E, Bergauer T, Brandstetter J, Brondolin E, Dragicevic M, Erö J, Flechl M, Friedl M, Frühwirth R, Ghete VM, Hartl C, Hörmann N, Hrubec J, Jeitler M, König A, Krätschmer I, Liko D, Matsushita T, Mikulec I, Rabady D, Rad N, Rahbaran B, Rohringer H, Schieck J, Strauss J, Waltenberger W, Wulz CE, Dvornikov O, Makarenko V, Mossolov V, Suarez Gonzalez J, Zykunov V, Shumeiko N, Alderweireldt S, De Wolf EA, Janssen X, Lauwers J, Van De Klundert M, Van Haevermaet H, Van Mechelen P, Van Remortel N, Van Spilbeeck A, Zeid SA, Blekman F, D'Hondt J, Daci N, De Bruyn I, Deroover K, Lowette S, Moortgat S, Moreels L, Olbrechts A, Python Q, Skovpen K, Tavernier S, Van Doninck W, Van Mulders P, Van Parijs I, Brun H, Clerbaux B, De Lentdecker G, Delannoy H, Fasanella G, Favart L, Goldouzian R, Grebenyuk A, Karapostoli G, Lenzi T, Léonard A, Luetic J, Maerschalk T, Marinov A, Randle-Conde A, Seva T, Vander Velde C, Vanlaer P, Vannerom D, Yonamine R, Zenoni F, Zhang F, Cornelis T, Dobur D, Fagot A, Gul M, Khvastunov I, Poyraz D, Salva S, Schöfbeck R, Tytgat M, Van Driessche W, Zaganidis N, Bakhshiansohi H, Bondu O, Brochet S, Bruno G, Caudron A, De Visscher S, De… See abstract for full author list ➔ Sirunyan AM, et al. Eur Phys J C Part Fields. 2017;77(11):746. doi: 10.1140/epjc/s10052-017-5286-7. Epub 2017 Nov 7. Eur Phys J C Part Fields. 2017. PMID: 31999281 Free PMC article.
  • Measurement of differential cross sections for Z boson production in association with jets in proton-proton collisions at s = 13 TeV.
    Sirunyan AM, Tumasyan A, Adam W, Ambrogi F, Asilar E, Bergauer T, Brandstetter J, Brondolin E, Dragicevic M, Erö J, Del Valle AE, Flechl M, Friedl M, Frühwirth R, Ghete VM, Hrubec J, Jeitler M, Krammer N, Krätschmer I, Liko D, Madlener T, Mikulec I, Rad N, Rohringer H, Schieck J, Schöfbeck R, Spanring M, Spitzbart D, Taurok A, Waltenberger W, Wittmann J, Wulz CE, Zarucki M, Chekhovsky V, Mossolov V, Gonzalez JS, De Wolf EA, Di Croce D, Janssen X, Lauwers J, Pieters M, Van De Klundert M, Van Haevermaet H, Van Mechelen P, Van Remortel N, Zeid SA, Blekman F, D'Hondt J, De Bruyn I, De Clercq J, Deroover K, Flouris G, Lontkovskyi D, Lowette S, Marchesini I, Moortgat S, Moreels L, Python Q, Skovpen K, Tavernier S, Van Doninck W, Van Mulders P, Van Parijs I, Beghin D, Bilin B, Brun H, Clerbaux B, De Lentdecker G, Delannoy H, Dorney B, Fasanella G, Favart L, Goldouzian R, Grebenyuk A, Kalsi AK, Lenzi T, Luetic J, Seva T, Starling E, Velde CV, Vanlaer P, Vannerom D, Cornelis T, Dobur D, Fagot A, Gul M, Khvastunov I, Poyraz D, Roskas C, Trocino D, Tytgat M, Verbeke W, Vermassen B, Vit M, Zaganidis N, Bakhshiansohi H, Bondu O, Brochet S, Bruno G, Caputo C, David P, Delaere C, Delcourt M, Fra… See abstract for full author list ➔ Sirunyan AM, et al. Eur Phys J C Part Fields. 2018;78(11):965. doi: 10.1140/epjc/s10052-018-6373-0. Epub 2018 Nov 22. Eur Phys J C Part Fields. 2018. PMID: 30881214 Free PMC article.
  • Measurement of the [Formula: see text] dijet cross section in pp collisions at [Formula: see text] TeV with the ATLAS detector.
    Aaboud M, Aad G, Abbott B, Abdallah J, Abdinov O, Abeloos B, Aben R, AbouZeid OS, Abraham NL, Abramowicz H, Abreu H, Abreu R, Abulaiti Y, Acharya BS, Adamczyk L, Adams DL, Adelman J, Adomeit S, Adye T, Affolder AA, Agatonovic-Jovin T, Agricola J, Aguilar-Saavedra JA, Ahlen SP, Ahmadov F, Aielli G, Akerstedt H, Åkesson TPA, Akimov AV, Alberghi GL, Albert J, Albrand S, Verzini MJA, Aleksa M, Aleksandrov IN, Alexa C, Alexander G, Alexopoulos T, Alhroob M, Aliev M, Alimonti G, Alison J, Alkire SP, Allbrooke BMM, Allen BW, Allport PP, Aloisio A, Alonso A, Alonso F, Alpigiani C, Alstaty M, Gonzalez BA, Piqueras DÁ, Alviggi MG, Amadio BT, Amako K, Coutinho YA, Amelung C, Amidei D, Santos SPAD, Amorim A, Amoroso S, Amundsen G, Anastopoulos C, Ancu LS, Andari N, Andeen T, Anders CF, Anders G, Anders JK, Anderson KJ, Andreazza A, Andrei V, Angelidakis S, Angelozzi I, Anger P, Angerami A, Anghinolfi F, Anisenkov AV, Anjos N, Annovi A, Antonelli M, Antonov A, Anulli F, Aoki M, Bella LA, Arabidze G, Arai Y, Araque JP, Arce ATH, Arduh FA, Arguin JF, Argyropoulos S, Arik M, Armbruster AJ, Armitage LJ, Arnaez O, Arnold H, Arratia M, Arslan O, Artamonov A, Artoni G, Artz S, Asai S, Asbah N, Ashken… See abstract for full author list ➔ Aaboud M, et al. Eur Phys J C Part Fields. 2016;76(12):670. doi: 10.1140/epjc/s10052-016-4521-y. Epub 2016 Dec 5. Eur Phys J C Part Fields. 2016. PMID: 28316501 Free PMC article.
  • Measurement of multijet azimuthal correlations and determination of the strong coupling in proton-proton collisions at s = 13 Te V.
    CMS Collaboration. CMS Collaboration. Eur Phys J C Part Fields. 2024;84(8):842. doi: 10.1140/epjc/s10052-024-13116-7. Epub 2024 Aug 21. Eur Phys J C Part Fields. 2024. PMID: 39185726 Free PMC article.
  • Measurement of differential cross sections and charge ratios for t-channel single top quark production in proton-proton collisions at s = 13 Te .
    Sirunyan AM, Tumasyan A, Adam W, Ambrogi F, Bergauer T, Brandstetter J, Dragicevic M, Erö J, Del Valle AE, Flechl M, Frühwirth R, Jeitler M, Krammer N, Krätschmer I, Liko D, Madlener T, Mikulec I, Rad N, Schieck J, Schöfbeck R, Spanring M, Spitzbart D, Waltenberger W, Wulz CE, Zarucki M, Drugakov V, Mossolov V, Gonzalez JS, Darwish MR, De Wolf EA, Di Croce D, Janssen X, Lauwers J, Lelek A, Pieters M, Sfar HR, Van Haevermaet H, Van Mechelen P, Van Putte S, Van Remortel N, Blekman F, Bols ES, Chhibra SS, D'Hondt J, De Clercq J, Lontkovskyi D, Lowette S, Marchesini I, Moortgat S, Moreels L, Python Q, Skovpen K, Tavernier S, Van Doninck W, Van Mulders P, Van Parijs I, Beghin D, Bilin B, Brun H, Clerbaux B, De Lentdecker G, Delannoy H, Dorney B, Favart L, Grebenyuk A, Kalsi AK, Luetic J, Popov A, Postiau N, Starling E, Thomas L, Velde CV, Vanlaer P, Vannerom D, Wang Q, Cornelis T, Dobur D, Khvastunov I, Roskas C, Trocino D, Tytgat M, Verbeke W, Vermassen B, Vit M, Zaganidis N, Bondu O, Bruno G, Caputo C, David P, Delaere C, Delcourt M, Giammanco A, Lemaitre V, Magitteri A, Prisciandaro J, Saggio A, Marono MV, Vischia P, Zobec J, Alves FL, Alves GA, Silva GC, Hensel C, Moraes A, Teles P… See abstract for full author list ➔ Sirunyan AM, et al. Eur Phys J C Part Fields. 2020;80(5):370. doi: 10.1140/epjc/s10052-020-7858-1. Epub 2020 May 6. Eur Phys J C Part Fields. 2020. PMID: 32633732 Free PMC article.

Cited by

References

    1. H1 and ZEUS Collaborations, Combined measurement and QCD analysis of the inclusive formula image scattering cross sections at HERA. JHEP 01, 109 (2010). 10.1007/JHEP01(2010)109. arXiv:0911.0884
    1. H1 and ZEUS Collaborations, Combination of measurements of inclusive deep inelastic formula image scattering cross sections and QCD analysis of HERA data. Eur. Phys. J. C 75, 580 (2015). 10.1140/epjc/s10052-015-3710-4. arXiv:1506.06042
    1. J. Currie et al., Precise predictions for dijet production at the LHC. Phys. Rev. Lett. 119, 152001 (2017). 10.1103/PhysRevLett.119.152001. arXiv:1705.10271 - PubMed
    1. A. Gehrmann-De Ridder et al., Triple differential dijet cross section at the LHC. Phys. Rev. Lett. 123, 102001 (2019). 10.1103/PhysRevLett.123.102001. arXiv:1905.09047 - PubMed
    1. CMS Collaboration, Measurement of the triple-differential dijet cross section in proton-proton collisions at formula image and constraints on parton distribution functions. Eur. Phys. J. C 77, 746 (2017). 10.1140/epjc/s10052-017-5286-7. arXiv:1705.02628 - PMC - PubMed