. 2025 Jan 28;10(5):e187825.
doi: 10.1172/jci.insight.187825.

Fibroblast growth factor-inducible 14 regulates satellite cell self-renewal and expansion during skeletal muscle repair

Affiliations

Fibroblast growth factor-inducible 14 regulates satellite cell self-renewal and expansion during skeletal muscle repair

Meiricris Tomaz da Silva et al. JCI Insight. .

Abstract

Skeletal muscle regeneration in adults is predominantly driven by satellite cells. Loss of satellite cell pool and function leads to skeletal muscle wasting in many conditions and disease states. Here, we demonstrate that the levels of fibroblast growth factor-inducible 14 (Fn14) were increased in satellite cells after muscle injury. Conditional ablation of Fn14 in Pax7-expressing satellite cells drastically reduced their expansion and skeletal muscle regeneration following injury. Fn14 was required for satellite cell self-renewal and proliferation as well as to prevent precocious differentiation. Targeted deletion of Fn14 inhibited Notch signaling but led to the spurious activation of STAT3 signaling in regenerating skeletal muscle and in cultured muscle progenitor cells. Silencing of STAT3 improved proliferation and inhibited premature differentiation of Fn14-deficient satellite cells. Furthermore, conditional ablation of Fn14 in satellite cells exacerbated myopathy in the mdx mouse model of Duchenne muscular dystrophy (DMD), whereas its overexpression improved the engraftment of exogenous muscle progenitor cells into the dystrophic muscle of mdx mice. Altogether, our study highlights the crucial role of Fn14 in the regulation of satellite cell fate and function and suggests that Fn14 can be a potential molecular target to improve muscle regeneration in muscular disorders.

Keywords: Cell biology; Muscle biology; Neuromuscular disease; Signal transduction; Skeletal muscle; Stem cells.


Conflict of interest statement

Conflict of interest: The authors have declared that no conflict of interest exists.

Figures

Figure 1
Figure 1. Expression of Fn14 in satellite cells.
(A) Violin plots showing gene expression of Fn14 (gene: Tnfrsf12a) and TWEAK (gene: Tnfsf12) in satellite cells at different time points after muscle injury in mice analyzed from a publicly available scRNA-seq dataset (GSE143435). (B) Single cells isolated from uninjured and injured TA muscle of WT mice were analyzed by FACS for the expression of α7-integrin and Fn14 protein. Representative scatter plots of FACS-based analysis demonstrate presence of Fn14+ cells among α7-integrin+ population (lower panel). (C) Satellite cells isolated from TA muscle of WT mice on day 0, 5, or 21 after injury were analyzed for mRNA levels of Fn14 by performing qPCR. n = 3 mice in each group. Data are presented as mean ± SEM and were analyzed by 1-way ANOVA followed by Tukey’s multiple-comparison test. #P ≤ 0.05, values significantly different from uninjured muscle (day 0). *P ≤ 0.05, values significantly different from 5-day-injured TA muscle. (D) Representative photomicrographs showing expression of Fn14 in Pax7+ cells in cultured mouse primary myoblasts. Scale bars: 50 μm.
Figure 2
Figure 2. Satellite cell–specific ablation of Fn14 inhibits muscle regeneration.
(A) Schematic representation of the experimental design. (B) Body weight of Fn14fl/fl and Fn14scKO mice. (C) Uninjured and 5-day-injured TA muscle wet weight normalized by body weight (BW) of Fn14fl/fl and Fn14scKO mice. (D) Uninjured and 14-day-injured TA muscle wet weight normalized by BW of Fn14fl/fl and Fn14scKO mice. (E) Representative photomicrographs of H&E-stained transverse sections of TA muscle of Fn14fl/fl and Fn14scKO mice at indicated time points after injury. Scale bars: 50 μm. (FH) Quantitative analysis of average myofiber cross-sectional area (CSA) in TA muscle of Fn14fl/fl and Fn14scKO mice on (F) day 0, (G) day 5, and (H) day 14 after injury. (I) Representative photomicrographs of transverse sections of 5-day-injured TA muscle of Fn14fl/fl and Fn14scKO mice after immunostaining for eMyHC and laminin protein. Nuclei were identified by staining with DAPI. Scale bars: 50 μm. (J and K) Quantification of (J) average CSA of eMyHC+ laminin+ myofibers, and (K) percentage of eMyHC+ laminin+ myofibers containing 2 or more centrally located nuclei in 5-day-injured TA muscle of Fn14fl/fl and Fn14scKO mice. n = 3–6 mice in each group. All data are presented as mean ± SEM. *P ≤ 0.05, values significantly different from contralateral uninjured muscle of Fn14fl/fl or Fn14scKO mice. #P ≤ 0.05, values significantly different from corresponding 5-day- or 14-day-injured TA muscle of Fn14fl/fl mice analyzed by 2-way ANOVA followed by Tukey’s multiple-comparison test. @P ≤ 0.05, values significantly different from corresponding Fn14fl/fl mice analyzed by unpaired Student’s t test.
Figure 3
Figure 3. Fn14 regulates satellite cell number in regenerating skeletal muscle.
(A) Representative photomicrographs of 5-day-injured TA muscle sections of Fn14fl/fl and Fn14scKO mice after immunostaining for Pax7 (red) and laminin (green) protein. Scale bars: 50 μm. White arrows point to Pax7+ satellite cells. (B and C) Average number of Pax7+ cells per unit area in (B) 5-day-injured and (C) 14-day-injured TA muscle of Fn14fl/fl and Fn14scKO mice. (D) Representative FACS dot plots demonstrating the percentage of α7-integrin+ cells in 5-day-injured TA muscle of Fn14fl/fl and Fn14scKO mice. (E) Quantification of α7-integrin+ satellite cells in 5-day-injured TA muscle of Fn14fl/fl and Fn14scKO mice assayed by FACS. (F and G) Relative mRNA levels of (F) Pax7 and (G) Myod1, Myh3, and Myog in 5-day-injured TA muscle of Fn14fl/fl and Fn14scKO mice assayed by qPCR. n = 3–4 mice in each group. All data are presented as mean ± SEM. #P ≤ 0.05, values significantly different from corresponding muscle of Fn14fl/fl mice analyzed by unpaired Student’s t test.
Figure 4
Figure 4. Fn14 mediates the activation and proliferation of satellite cells.
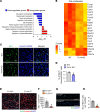
(A) Gene ontology (GO) biological processes associated with downregulated and upregulated genes. (B) Heatmap representing selected genes involved in the regulation of cell proliferation in cultured WT and Fn14-KO myogenic cells generated after analysis of RNA-seq dataset. (C) WT and Fn14-KO myogenic cultures were pulse labeled with EdU for 60 minutes. Representative images of the cultures after detection of EdU and Hoechst staining (nuclei detection). Scale bars: 50 μm. (D) Quantification of percentage of EdU+ cells in WT and Fn14-KO cultures. n = 3 biological replicates in each group. (E) TA muscle of Fn14fl/fl and Fn14scKO mice was injured by intramuscular injection of 1.2% BaCl2 solution. After 3 days, the mice were given an intraperitoneal injection of EdU and 11 days later TA muscles were collected and transverse muscle sections were generated and stained to detect EdU, anti-laminin, and nuclei. Representative photomicrographs after EdU, laminin, and DAPI staining are presented here. Scale bars: 50 μm. (F) Quantification of the EdU+ nuclei per unit area. n = 4 mice in each group. (G) Single myofibers were isolated from EDL muscle of Fn14fl/fl and Fn14scKO mice. After 48 hours of culturing, the myofibers were pulse-labeled with EdU for 60 minutes. Representative merged images of EdU+ and DAPI-stained myofibers are presented here. Scale bars: 100 μm. (H) Quantification of number of EdU+ cells per myofiber. n = 3 mice in each group. Analysis was done using 15–20 myofibers for each mouse. All data are presented as mean ± SEM. #P ≤ 0.05, values significantly different from WT myoblast, or corresponding muscle of Fn14fl/fl mice, analyzed by unpaired Student’s t test.
Figure 5
Figure 5. Fn14 promotes satellite cell self-renewal.
(A) TA muscle of Fn14fl/fl and Fn14scKO mice was injured by intramuscular injection of 1.2% BaCl2 solution. After 21 days, the same TA muscle was injured again, and the muscle was isolated 5 days later. Representative photomicrographs of H&E- and Sirius red–stained TA muscle sections. Scale bars: 50 μm. Quantification of (B) percentage of myofibers containing 2 or more centrally located nuclei and (C) percentage of total area stained with Sirius red. (D) Representative photomicrograph and (E) quantification of Pax7+ cells per unit area in double-injured TA muscle sections of Fn14fl/fl and Fn14scKO mice after immunostaining for Pax7 (red) and laminin (green) protein. Nuclei were identified by staining with DAPI. Scale bars: 50 μm. n = 3–4 mice in each group. (F) Heatmap of selected genes associated with stem cell population maintenance in WT and Fn14-KO cultures generated after analysis of RNA-seq dataset. (G) Immunoblots and (H) densitometry analysis showing levels of cleaved Notch1 and total Notch1 protein in WT and Fn14-KO cultures. n = 3 biological replicates in each group. (I) Relative mRNA levels of Notch receptors (Notch1, Notch2, and Notch3), Notch ligands (Jagged1, Jagged2, Dll1, and Dll4), and Notch targets (Hes1, Hes6, Heyl, and Hey1) in 5-day-injured TA muscle of Fn14fl/fl and Fn14scKO mice. n = 4 mice in each group. All data are presented as mean ± SEM. #P ≤ 0.05, values significantly different from corresponding muscle of Fn14fl/fl mice analyzed by unpaired Student’s t test.
Figure 6
Figure 6. Deletion of Fn14 leads to precocious differentiation of satellite cells.
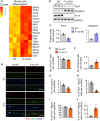
(A) Heatmap representing selected genes associated with muscle cell differentiation in WT and Fn14-KO myogenic cultures generated after analysis of RNA-seq dataset. (B) Immunoblots and (C) densitometry analysis of protein levels of Pax7, myogenin, Fn14, and unrelated protein GAPDH in WT and Fn14-KO cultures. n = 3 biological replicates in each group. (D) Representative individually stained and merged images of 0-hour and 72-hour cultured myofibers from Fn14fl/fl and Fn14scKO mice. Scale bars: 100 μm. Quantification of number of (E) Pax7+ cells, and (F) MyoD+ cells per myofiber at 0 hours. Quantification of (G) number of clusters per myofiber, percentage of (H) Pax7+MyoD (self-renewing), (I) Pax7+MyoD+ (activated/proliferating), and (J) Pax7MyoD+ (differentiating) cells per myofiber following 72 hours of culturing. n = 3 mice in each group. Analysis was done using 15–20 myofibers for each mouse at each time point. All data are presented as mean ± SEM. #P ≤ 0.05, values significantly different from WT myoblast, or corresponding muscle of Fn14fl/fl mice analyzed by unpaired Student’s t test.
Figure 7
Figure 7. Fn14 regulates STAT signaling in myogenic cells.
(A) Heatmap of selected genes associated with positive regulation of JAK/STAT pathway, target genes, and inhibitors of JAK/STAT signaling in WT and Fn14-KO cultures generated after analysis of RNA-seq dataset. (B) Immunoblots showing protein levels of phosphorylated and total levels of STAT2, STAT3, and STAT5 protein in uninjured and 5-day-injured TA muscle of Fn14fl/fl and Fn14scKO mice. n = 3–4 mice in each group. (C) Immunoblots show protein levels of phosphorylated and total STAT3 and Fn14 protein in WT and Fn14-KO cultures. (D) WT and Fn14-KO myoblasts were transfected with control and STAT3 siRNA. After 24 hours, the cells were pulse labeled with EdU for 60 minutes and analyzed for EdU incorporation. Representative photomicrographs are presented here. Scale bars: 100 μm. (E) Quantification of percentage of EdU+Hoechst33258+ cells in WT and Fn14-KO cultures transfected with control or STAT3 siRNA. n = 3 biological replicates in each group. (F) Representative immunoblots and (G) densitometry analysis showing protein levels of Pax7, myogenin, STAT3, and Fn14 in WT and Fn14-KO myogenic cultures transfected with control or STAT3 siRNA. n = 6 biological replicates in each group. All data are presented as mean ± SEM. *P ≤ 0.05, values significantly different from corresponding cultures transfected with control siRNA. #P ≤ 0.05, values significantly different from corresponding WT cultures analyzed by 2-way ANOVA followed by Tukey’s multiple-comparison test.
Figure 8
Figure 8. Satellite cell–specific ablation of Fn14 exacerbates dystrophic phenotype in mdx mice.
(A) Heatmaps showing expression of Fn14 (gene: Tnfrsf12a), TWEAK (gene: Tnfsf12), Nfkb1, Nfkb2, Rela, Relb, and Nfkbia in muscle stem cells of WT and mdx, and WT and D2.mdx mice analyzed from a publicly available single-cell dataset (GSE213925). (B) Representative pictures of 7-week-old mdx;Fn14fl/fl and mdx;Fn14scKO mice. Quantitative analysis of (C) body weight, and (D) wet weight of tibialis anterior (TA), gastrocnemius (GA), and quadriceps (QUAD) muscle normalized by BW of corresponding mice. (E) Representative photomicrographs of GA muscle sections of 7-week-old mdx;Fn14fl/fl and mdx;Fn14scKO mice after H&E staining, anti-eMyHC staining, or anti-Pax7/anti-laminin/DAPI staining. White arrows point to satellite cells in muscle sections. Scale bars: 50 μm. Quantification of (F) number of centronucleated fibers (CNF) per field, (G) average CSA of eMyHC+ myofibers, and (H) average number of Pax7+ cells per unit area. n = 3–6 mice in each group. All data are presented as mean ± SEM. #P ≤ 0.05, values significantly different from mdx;Fn14fl/fl mice analyzed by unpaired Student’s t test.
Figure 9
Figure 9. Overexpression of Fn14 improves engraftment of myoblasts into dystrophic muscle.
(A) Western blot demonstrating levels of Fn14 protein in myoblasts transduced with EGFP (control) or Fn14-overexpressing (Fn14OE) retrovirus. (B) TA muscle of 8-week-old mdx mice was injured by intramuscular injection of 1.2% BaCl2 solution. After 24 hours, the muscle was injected with 1 × 10⁶ primary myoblasts stably transduced with control or Fn14OE retrovirus. After 28 days, the TA muscle was isolated and weighed. (C) Representative anti-dystrophin–stained images of TA muscle sections of mdx mice transplanted with control or Fn14OE myoblasts. Scale bars: 50 μm. (D) Quantitative analysis of average CSA of dystrophin+ myofibers in TA muscle of mdx mice transplanted with control or Fn14OE myoblasts. n = 3–4 mice in each group. All data are presented as mean ± SEM. *P ≤ 0.05, values significantly different from TA muscle injected with control myoblasts by unpaired Student’s t test.

Update of

References

    1. Kuang S, et al. Asymmetric self-renewal and commitment of satellite stem cells in muscle. Cell. 2007;129(5):999–1010. doi: 10.1016/j.cell.2007.03.044. - DOI - PMC - PubMed
    1. Yin H, et al. Satellite cells and the muscle stem cell niche. Physiol Rev. 2013;93(1):23–67. doi: 10.1152/physrev.00043.2011. - DOI - PMC - PubMed
    1. von Maltzahn J, et al. Pax7 is critical for the normal function of satellite cells in adult skeletal muscle. Proc Natl Acad Sci U S A. 2013;110(41):16474–16479. doi: 10.1073/pnas.1307680110. - DOI - PMC - PubMed
    1. Kuang S, Rudnicki MA. The emerging biology of satellite cells and their therapeutic potential. Trends Mol Med. 2008;14(2):82–91. doi: 10.1016/j.molmed.2007.12.004. - DOI - PubMed
    1. Boyer JG, et al. Depletion of skeletal muscle satellite cells attenuates pathology in muscular dystrophy. Nat Commun. 2022;13(1):2940. doi: 10.1038/s41467-022-30619-7. - DOI - PMC - PubMed

MeSH terms