. 2025 Feb 4;122(5):e2414734122.
doi: 10.1073/pnas.2414734122. Epub 2025 Jan 28.

AMH protects the ovary from doxorubicin by regulating cell fate and the response to DNA damage

Affiliations

AMH protects the ovary from doxorubicin by regulating cell fate and the response to DNA damage

Ngoc Minh Phuong Nguyen et al. Proc Natl Acad Sci U S A. .

Abstract

Anti-Müllerian hormone (AMH) protects the ovarian reserve from chemotherapy, and this effect is most pronounced with Doxorubicin (DOX). However, DOX toxicity and AMH rescue mechanisms in the ovary have remained unclear. Herein, we characterize the consequences of these treatments in ovarian cell types using scRNAseq. DOX-induced DNA damage activates Tp53 class mediators across ovarian cell types. In the mesenchyme, cotreatment with AMH halts theca progenitor differentiation and reduces apoptotic gene expression. In preantral granulosa cells, DOX upregulates the cell cycle inhibitor Cdkn1a and dysregulates Wnt signaling, which are ameliorated by AMH cotreatment. Finally, AMH induces Id3, a gene involved in DNA repair, which is necessary to prevent the accumulation of DNA lesions marked by γ-H2AX. Altogether these mechanisms of AMH protection contribute to sustained fertility in mice, offering promising broad avenues for fertility preservation in cancer patients undergoing chemotherapy.

Keywords: AMH; chemotherapy; oncofertility; ovary.


Conflict of interest statement

Competing interests statement:Scientific advisors and co-founders of Oviva Therapeutics (P.K.D. and D.P.). Stock ownership in Oviva Therapeutics (P.K.D. and D.P.). PCT/US2017/066346–WO2018112168–Müllerian inhibiting substance (MIS) proteins for ovarian and uterine oncoprotection, and ovarian reserve and uterine preservation (P.K.D. and D.P.).

Figures
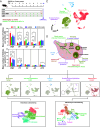
Fig. 1.
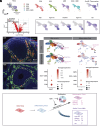
Fig. 1.
Single-cell RNA sequencing analysis of mouse ovaries treated with DOX and AMH. (A) Mice were treated with DOX and AMH, and ovaries were dissociated into a single-cell suspension for scRNAseq. (B) The mean number of follicles at different developmental stages in four groups at 4 h and 1 wk. PMF, primordial follicle; PF, primary follicle; SF, secondary follicle; AF, antral follicle; ATF, atretic antral follicle. Data are presented as mean ± SEM; *P < 0.05, **P < 0.01, ***P < 0.001. (C) UMAP plot featuring five major cell types in the ovary. (D) Illustration depicting the internal components of the mouse ovary with examples of markers used for identifying five major cell types and the clustering of granulosa cells and mesenchyme.
Fig. 2.
Fig. 2.
DOX impact on ovarian mesenchymal cells. (A) UMAP of mesenchymal subtypes in DOX-treated and control ovaries. (B) Top 10 GO enriched pathways in response to DOX. (C) Selected GSEA pathways using the M2 collection of 2,626 gene sets, highlighting p53 pathway markers in proliferating mesenchymal cells in response to DOX. (D) Expression patterns of the most significantly upregulated 53 pathway markers in response to DOX. (E and F) Representative micrograph of an ovarian section stained by RNAish for selected p53 markers in stroma and theca cells (Scale bars, 25 µm.) (E), along with quantification (F). Data are presented as mean ± SEM; *P < 0.05, **P < 0.01, ***P < 0.001. (G) Schematic model of suggested mechanisms activated by DOX.
Fig. 3.
Fig. 3.
AMH impact on ovarian theca. (A and B) UMAP of theca subclusters (A) under different conditions showing AMH-specific cluster and (B) theca marker Prss35. (C) Volcano plot highlighting differentially expressed genes between AMH-treated and control. (D) FeaturePlot showing downregulated steroidogenic markers in AMH-specific clusters and upregulation of Id3. (E) Representative micrograph of an ovarian section stained for Cyp17a1 by RNAish in control and AMH-treated groups. (Scale bars, 50 µm.) (F) RNA velocity predicting the differentiation path (Left) and differentiation rate (Right) of steroidogenic theca in control and DOX with AMH cotreatment, with arrows pointing to the theca clusters with the highest differentiation rates. (G) Dotplot of proliferation markers Mki67 and Ccne2 in the proliferating mesenchymal cells. (H) Schematic overview of a suggested model for the differentiation stall induced by AMH.
Fig. 4.
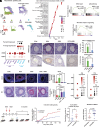
Fig. 4.
DOX impact on ovarian preantral granulosa cells. (A) UMAP of preantral clusters identified by canonical marker and subtypes in all conditions. (B) All 28 GSEA-enriched pathways in response to DOX. (C) Selected GSEA plots demonstrating enriched pathways in DNA damage and Wnt Beta Catenin signaling. (D) Expression patterns of markers involved in the TP53 and WNT pathways. (E) Representative micrograph of ovarian section stained by RNAish (Upper panel) and IHC (Lower panel) for Cdkn1a in preantral granulosa, with quantification. (Scale bars, 50 µm.) Data are presented as mean ± SEM; *P < 0.05, **P < 0.01, ***P < 0.001. (F) Representative micrograph of an ovarian section stained by fluorescent RNAish for Wnt6 showing expression in preantral GC with quantification. (Scale bars, 50 µm.) Data are presented as mean ± SEM; *P < 0.05, **P < 0.01, ***P < 0.001. (G) Dotplot of proliferation markers, Mki67 and Ccne2, in proliferating granulosa cells. (H) Representative micrograph of ovarian section stained by RNAish for Id3 in preantral granulosa, along with quantification. (I) The experimental design of the mating study. (J) Average cumulative pups per female in DOX and DOX+AMH groups over a 6-mo mating experiment (Left) and a histogram showing cumulative pups per mouse at the end of the period. (K) Total number of litters per female. Data are presented as mean ± SEM; *P < 0.05, **P < 0.01, ***P < 0.001.
Fig. 5.
Fig. 5.
DOX and AMH effects on γ-H2AX accumulation. (A) Left panel: representative IHC of γ-H2AX, an early marker of DNA damage in each treatment group, with black asterisks highlighting primordial follicles. Right panel: Quantification of γ-H2AX-positive follicles. For primordial follicle and primary follicle >1 positive cell was considered a positive follicle. For secondary and larger follicles, the ratio between γ-H2AX positive granulosa cells and the total number of granulosa cells per follicle was calculated (n = 30). Early secondary follicles were defined as surrounded by two layers of granulosa cells. Late secondary contained >2 layers of granulosa cells without antrum. Scale bars represent 25 µm for primordial and primary follicles, 50 µm for secondary and antral follicles. Data are presented as mean ± SEM; *P < 0.05, **P < 0.01, ***P < 0.001. (B) Left panel: Representative micrograph of GCs stained by immunofluorescence for γ-H2AX after treatment with DOX (0.5 µM), with or without cotreatment of AMH (10 µg/mL). The bottom panel shows a higher magnification. [Scale bars, 200 µm (Top), 100 µm (Bottom).] Right panel: Quantification of γ-H2AX signal by image analysis with (B), mean number of γ-H2AX positive cells as a proportion of total granulosa cells. Data are presented as mean ± SEM; *P < 0.05, **P < 0.01, ***P < 0.001. (C) Representative immunofluorescence stain of γ-H2AX and ID3 in GCs. ID3 protein expression was evaluated after treatment with DOX (0.5 µM) and AMH (10 µg/mL). (B) Quantitative PCR of Id3 with AMH treatment or siRNA knockdown. Data are presented as mean ± SEM; *P < 0.05, **P < 0.01, ***P < 0.001. (D) Representative micrograph of GCs treated with an siRNA against Id3, or a control scrambled siRNA, with Dox (0.5 µM) and/or AMH (10 µg/mL) treatments, stained by immunofluorescence for γ-H2AX. Image quantification represents the percentage of γ-H2AX positive cells across conditions. Data are presented as mean ± SEM (N = 5 experiments); *P < 0.05, **P < 0.01, ***P < 0.001.
Fig. 6.
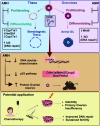
Fig. 6.
Schematic model of suggested mechanisms of DOX ovarian toxicity and AMH rescue. Doxorubicin causes DNA damage and induction of the TP53 pathway across ovarian cell types. AMH inhibits the proliferation and differentiation of granulosa cells and theca progenitors, and induces Id3 expression, which contributes to enhanced DNA repair and reduced activation of TP53-pathway mediators. AMH treatment leads to improved long-term fertility after exposure to DOX in mice, representing a potential clinical approach for fertility preservation in cancer survivors at risk of primary ovarian insufficiency.

Update of

References

    1. Anderson R. A., et al. , The impact of cancer on subsequent chance of pregnancy: A population-based analysis. Hum. Reprod. 33, 1281–1290 (2018). - PMC - PubMed
    1. Spears N., et al. , Ovarian damage from chemotherapy and current approaches to its protection. Hum. Reprod. Update 25, 673–693 (2019). - PMC - PubMed
    1. Diaz A. A., Kubo H., Handa N., Hanna M., Laronda M. M., A systematic review of ovarian tissue transplantation outcomes by ovarian tissue processing size for cryopreservation. Front. Endocrinol. (Lausanne) 13, 918899 (2022). - PMC - PubMed
    1. Demeestere I., et al. , No evidence for the benefit of gonadotropin-releasing hormone agonist in preserving ovarian function and fertility in lymphoma survivors treated with chemotherapy: Final long-term report of a prospective randomized trial. J. Clin. Oncol. 34, 2568–2574 (2016). - PubMed
    1. Lambertini M., et al. , Debated role of ovarian protection with gonadotropin-releasing hormone agonists during chemotherapy for preservation of ovarian function and fertility in women with cancer. J. Clin. Oncol. 35, 804–805 (2017). - PubMed

MeSH terms

Substances

LinkOut - more resources