Clinical Trial
. 2025 Feb 18;6(2):101929.
doi: 10.1016/j.xcrm.2025.101929. Epub 2025 Jan 27.

The potential of lazertinib and amivantamab combination therapy as a treatment strategy for uncommon EGFR-mutated NSCLC

Affiliations
Clinical Trial

The potential of lazertinib and amivantamab combination therapy as a treatment strategy for uncommon EGFR-mutated NSCLC

Seung Yeon Oh et al. Cell Rep Med. .

Abstract

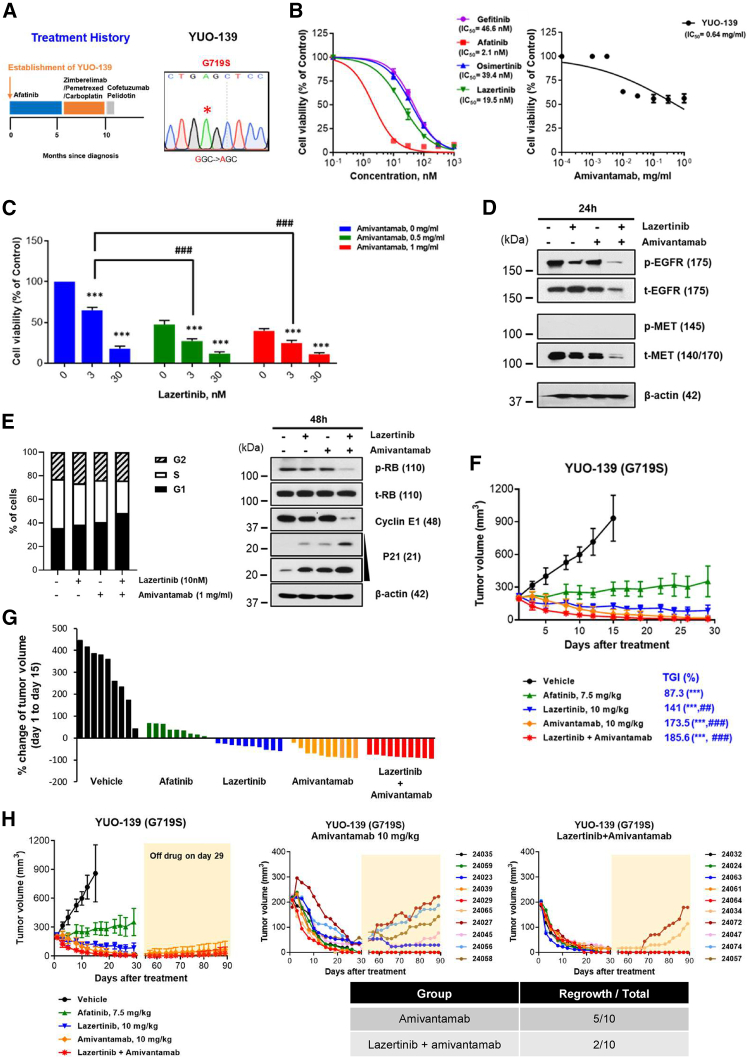
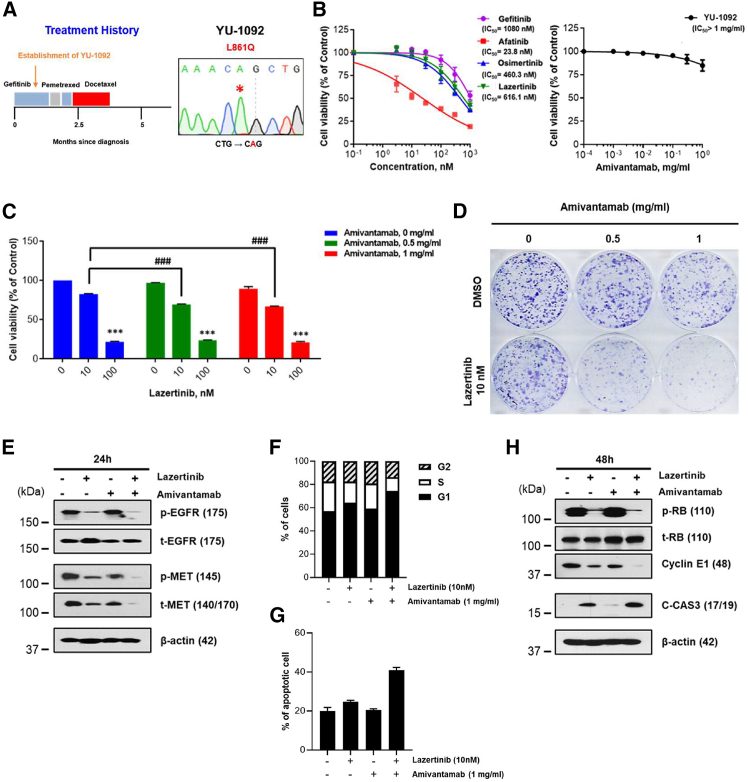
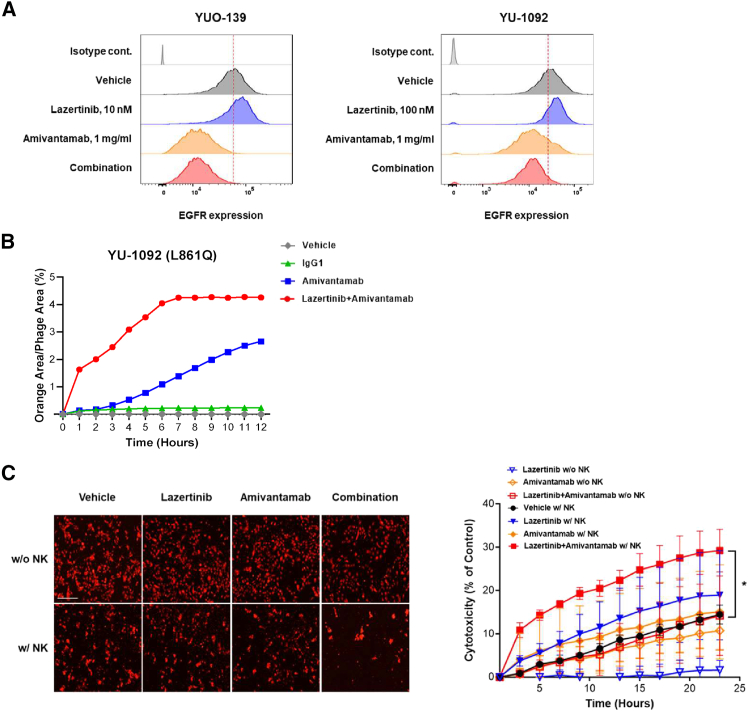
Uncommon epidermal growth factor receptor (EGFR) mutations in non-small cell lung cancer (NSCLC) pose therapeutic challenge due to limited response to EGFR tyrosine kinase inhibitors (TKIs). This study presents preclinical evidence and mechanistic insights into the combination of lazertinib, a third-generation EGFR-TKI; and amivantamab, an EGFR-MET bispecific antibody, for treating NSCLC with uncommon EGFR mutations. The lazertinib-amivantamab combination demonstrates significant antitumor activity in patient-derived models with uncommon EGFR mutations either before treatment or after progressing on EGFR-TKIs. Lazertinib enhances the inhibitory capacity of amivantamab by increasing its on-target expression. Notably, the combination surpasses afatinib, a first-line treatment for uncommon EGFR mutations in NSCLC, in terms of in vivo efficacy. Promising clinical activity is also observed in two case studies of patients treated with this combination (NCT04077463). Our findings highlight the potential of the lazertinib-amivantamab combination as a therapeutic strategy for uncommon EGFR mutations, an area of unmet medical need, and support further clinical investigation.

Keywords: EGFR-MET bispecific antibody; NSCLC; combination therapy; third-generation EGFR-TKI; uncommon EGFR-mutatation.


Conflict of interest statement

Declaration of interests B.C.C. declares the following competing interests: royalties from Champions Oncology, Crown Bioscience, Imagen, and PearlRiver Bio GmbH under licensing contracts for PDX, PDO, and PDC (not patent-related); research funding from GI Innovation, AstraZeneca, Champions Oncology, CJ Bioscience, Cyrus Therapeutics, Janssen, MSD, Dong-A ST, Yuhan, ImmuneOncia, Therapex Co., J INTS Bio, and Vertical Bio AG; consulting roles with BeiGene, Novartis, AstraZeneca, Boehringer Ingelheim, Roche, Bristol Myers Squibb (BMS), CJ Bioscience, Cyrus Therapeutics, Ono Pharmaceutical, Yuhan, Pfizer, Eli Lilly, Janssen, Takeda, MSD, Gilead, Amgen, Daiichi Sankyo, Regeneron, Sanofi, AnHeart Therapeutics, Seagen, Harpoon Therapeutics, GSK, and ArriVent; employment with Yonsei University Health System; advisory board memberships at KANAPH Therapeutics Inc., BridgeBio Therapeutics, Cyrus Therapeutics, Guardant Health, J INTS Bio, and Therapex Co., Ltd; invited speaker engagements for ASCO, AstraZeneca, Guardant, Roche, ESMO, IASLC, Korean Cancer Association, Korean Society of Medical Oncology, Korean Society of Thyroid-Head and Neck Surgery, Korean Cancer Study Group, Novartis, MSD, The Chinese Thoracic Oncology Society, Pfizer, and Zailab; stock holdings in TheraCanVac Inc., Gencurix Inc., BridgeBio Therapeutics, KANAPH Therapeutics Inc., Cyrus Therapeutics, Interpark Bio Convergence Corp., and J INTS Bio; and roles as founder of DAAN Biotherapeutics and board member of J INTS Bio. M.H.H. declares the following competing interests: honoraria from AstraZeneca, Amgen, BMS, MSD, Ono Pharmaceutical, Takeda, and Roche; consulting or advisory roles for AstraZeneca, BMS, MSD, Pfizer, Takeda, Roche, and Yuhan; investigator or co-investigator roles in clinical trials for AbbVie, AstraZeneca, BMS, IMPACT Therapeutics, Ignyta, Loxo Oncology, Merck Serono, MSD, Novartis, ORIC, Roche, Pfizer, and Yuhan; and research support from AstraZeneca, MSD, Novartis, and Yuhan.

Figures

None
Graphical abstract
Figure 1
Figure 1
Antitumor activity of lazertinib plus amivantamab in Ba/F3 cells with uncommon EGFR mutations (A–C) Ba/F3 cells expressing uncommon EGFR mutations (G719S, S768I, and G719A/S768I) were seeded onto a 96-well plate and incubated with the EGFR-TKIs (gefitinib, afatinib, osimertinib, and lazertinib) and amivantamab. Cell viability was measured after 3 days of EGFR-TKIs and 5 days of amivantamab treatment via CellTiter-Glo. The curved graphs represent the cell viability results for a single drug (A and B), and the bar graphs show the cell viability for the combination of lazertinib and amivantamab (C). Data represent the means ± SE from three and more times of independent experiments. ANOVA with Tukey post hoc test: ∗p < 0.05, ∗∗p < 0.01, ∗∗∗p < 0.001 vs. lazertinib 0 nM in each group; ##p < 0.01, ###p < 0.001 vs. matched concentrate of lazertinib in amivantamab 0 mg/mL. (D) Immunoblot analysis of Ba/F3 cells with uncommon EGFR mutations (G719S, S768I, and G719A/S768I) treated with lazertinib and amivantamab for 72 h. Ba/F3 EGFRG719S cells were treated with lazertinib at 3 nM and amivantamab 0.5 mg/mL, while Ba/F3 EGFRS768I and EGFRG719A/S768I cells were treated with lazertinib at 100 nM and amivantamab at 1 mg/ml. (E) Ba/F3 EGFRG719S cells (5 × 106 in 100 μL PBS) were subcutaneously implanted into the flanks of 6-week-old female BALB/c nude mice. Mice were randomized once tumor volume reached 200 mm3 and then treated with afatinib, lazertinib, amivantamab, and lazertinib plus amivantamab. Tumor growth curves represent the response to the indicated drugs over a period of 27 days. Data represent the means ± SD (n = 10/group). Kruskal-Wallis with Dunn’s post hoc test: ∗∗p < 0.01, ∗∗∗p < 0.001 vs. vehicle; #p < 0.05, ###p < 0.001 vs. afatinib; §§§p < 0.001 vs. lazertinib. (F) Waterfall plot representing the percentage of tumor volume change in mice after 4 weeks of treatment with the indicated drugs. (G) Representative images of IHC staining for pEGFR and tEGFR of Ba/F3 EGFRG719S tumor sections. The scale bar indicates 50 μm.
Figure 2
Figure 2
Antitumor activity of lazertinib plus amivantamab in the EGFR-TKI-naive YUO-139 PDO model with EGFRG719S (A) Clinical treatment history of patient harboring EGFRG719S. The YUO-139 model was established from pleural effusion at the indicated time point (left panel). The harboring mutation of YUO-139 was confirmed by Sanger sequencing (right panel). (B and C) YUO-139 organoids were seeded onto a 96-well plate and treated with EGFR-TKIs (gefitinib, afatinib, osimertinib, and lazertinib) and amivantamab at the indicated concentrations. Cell viability was measured using CellTiter-Glo 3D after 3 and 5 days of monotherapy with EGFR-TKIs and amivantamab, respectively, and after 10 days of treatment with lazertinib plus amivantamab. The curved graphs represent the cell viability results for a single drug (B), and the bar graphs show the cell viability for the combination of lazertinib and amivantamab (C). Data represent the means ± SE from three and more times of independent experiments. ANOVA with Tukey post hoc test: ∗∗∗p < 0.001 vs. lazertinib 0 nM in each group; ###p < 0.001 vs. matched concentrate of lazertinib in amivantamab 0 mg/mL. (D) YUO-139 organoids were treated with lazertinib at 10 nM or/and amivantamab at 1 mg/mL for 24 h. Expression of pEGFR/tEGFR and pMET/tMET was evaluated through immunoblot assay. (E) Left, YUO-139 organoids were treated with lazertinib or/and amivantamab with the indicated concentrations for 72 h. The bar graphs showed the percentage of cells in each phase of the cell cycles. Right, YUO-139 organoids were treated with lazertinib at 10 nM or/and amivantamab at 1 mg/mL for 48 h. Expression of pRB/tRB, Cyclin E1, and p21 was evaluated through immunoblot assay. (F) Tumor growth curves of YUO-139 xenografts in response to the indicated drugs over a period of 29 days. Data represent the means ± SD (n = 10/group). Kruskal-Wallis with Dunn post hoc test: ∗∗∗p < 0.001 vs. vehicle; ##p < 0.01, ###p < 0.001 vs. afatinib. (G) Waterfall plot representing the percentage of tumor volume change in mice after 2 weeks of treatment with the indicated drugs. (H) For the amivantamab and lazertinib plus amivantamab groups in (F), the drug was discontinued on day 29 of treatment and tumor growth was further monitored until day 90. The upper panel shows the average growth curves for each of the two groups, and the lower panel shows the individual mouse tumor growth curves for amivantamab (left) and lazertinib + amivantamab (right).
Figure 3
Figure 3
In vitro activity of lazertinib plus amivantamab in YU-1092 PDC harboring EGFRL861Q (A) Clinical treatment history of patient harboring EGFRL861Q. YU-1092 cells were established from pleural effusion at the indicated time point (left panel). EGFRL861Q mutation in YU-1092 cells was confirmed by Sanger sequencing (right panel). (B and C) Cell viability was measured after 3 days of EGFR-TKIs and 5 days of amivantamab and lazertinib plus amivantamab treatment via CellTiter-Glo. The curved graphs represent the cell viability results for a single drug (B), and the bar graphs show the cell viability for the combination of lazertinib and amivantamab (C). Data represent the means ± SE from three and more times of independent experiments. ANOVA with Tukey post hoc test: ∗∗p < 0.01, ∗∗∗p < 0.001 ∗∗∗ vs. lazertinib 0 nM in each group; ###p < 0.001 vs. matched concentrate of lazertinib in amivantamab 0 mg/mL. (D) Colony formation analysis of YU-1092 cells in response to single or combined treatment with lazertinib and amivantamab. Fresh medium containing the drug at the indicated concentration was replaced every 3 days and treated for 14 days. (E) YU-1092 cells were treated with lazertinib at 100 nM and amivantamab at 1 mg/mL for 24 h. Expression of pEGFR/tEGFR and pMET/tMET was evaluated through immunoblot assay. (F and G) YU-1092 cells were treated with lazertinib or/and amivantamab at the indicated concentrations for 72 h. The bar graphs showed the percentage of cells in each phase of the cell cycle (F) and the percentage of apoptotic cells (G). (H) YU-1092 cells were treated with lazertinib at 100 nM and amivantamab at 1 mg/mL for 48 h. Expression of pRB/tRB, cyclin E1, and cleaved caspase-3 was evaluated through immunoblot assay.
Figure 4
Figure 4
Lazertinib enhances the efficacy of amivantamab (A) Surface expression of EGFR was measured in YUO-139 and YU-1092 cells after 72 h of treatment with lazertinib or/and amivantamab at indicated concentrations. (B) Real-time measurement of pHrodo internalization as measured by normalized red fluorescent area (%) over 12 h for drug treated YU-1092 cell lines. (C) The representative image at the 24-h time point shows tumor cells stained with CellTracker Red CMTPX dye (left). ADCC-mediated cytotoxicity was assessed in YU-1092 cells, with or without NK cells treated with lazertinib (10 nM) and/or amivantamab (1 mg/mL) for 24 h (right). Data represent the means ± SE from two times of independent experiments. (ANOVA with Tukey post hoc test: ∗p < 0.05 vs. amivantamab w/NK cell group) The scale bar indicates 250 μm.
Figure 5
Figure 5
In vivo activity of lazertinib plus amivantamab in patient-derived preclinical models with uncommon EGFR mutations resistant to EGFR-TKIs (A) Tumor growth curves of YU-1092 xenografts in response to the indicated drugs over a period of 19 days. Data represent the means ± SD (n = 10/group). (Kruskal-Wallis with Dunn post hoc test: ∗∗p < 0.01, ∗∗∗p < 0.001 vs. vehicle; #p < 0.05 vs. afatinib.). (B) Waterfall plot representing the percentage of tumor volume change in mice after 19 days of treatment with the indicated drugs. (C) Representative images of IHC staining for pEGFR/tEGFR. The scale bar indicates 50 μm. (D) Representative images of IHC staining for mF4/80 and mNKp46 (left panel) of YU-1092 tumor sections. The graph represents the quantification of macrophage and NK cell infiltration of tumor microenvironment (right panel). The scale bar indicates 20 μm. Data represent the means ± SD (n = 4/group). (ANOVA with Tukey post hoc test: ∗∗∗p < 0.001 vs. vehicle). (E) Clinical treatment history of patient harboring EGFRG719S/L861Q. YHIM-1008 PDXs were established from pleural effusion at the indicated time point. (F) Tumor growth curves of YHIM-1008 xenografts showing response to indicated drugs. Except for amivantamab alone, the remaining treatment groups stopped the drug on day 29 and were further monitored for tumor growth until day 80. Data represent the means ± SD (n = 7/group). (Kruskal-Wallis with Dunn post hoc test: ∗∗∗p < 0.001 vs. vehicle at day 29 of treatment; ###p < 0.001 vs. osimertinib and lazertinib, respectively, at the end of the experiment after drug discontinuation; §p < 0.05 vs. afatinib at the end of the experiment after drug discontinuation.). (G) Representative images of IHC staining for pEGFR/tEGFR and pMET/tMET. The scale bar indicates 50 μm. (H) Representative images of IHC staining for mF4/80 and mNKp46 (upper panel) of YHIM-1008 tumor sections from mice sacrificed on day 11. The scale bar indicates 20 μm. The graph represents the quantification of macrophage and NK cell infiltration in the tumor microenvironment (lower panel). Data represent the means ± SD (n = 4/group). (ANOVA with Tukey post hoc test: ∗∗∗p < 0.001 vs. vehicle).
Figure 6
Figure 6
Clinical activity of lazertinib plus amivantamab in NSCLC patients harboring uncommon EGFR mutations (A and B) Radiologic response following 240 mg lazertinib and 1,050 mg amivantamab treatment in a 55-year-old patient with the EGFRG719S/S768I mutation (A) and a 67-year-old patient with the EGFRL861Q mutation (B). Arrows indicate the tumor lesion.
Figure 7
Figure 7
High expression of EGFR/MET is associated with responsiveness to the combination of lazertinib and amivantamab (A) Surface expression of EGFR and MET was evaluated through flow cytometry analysis. Bar graphs represent the MFI of MET, and linear graphs represent the MFI of EGFR. Left panel is group of PDO, and right panel is PDC group. (B) Representative images of IHC staining for tEGFR and tMET of treatment-naive patients with EGFRG719S/S768I mutation tumor sections. The scale bar indicates 20 μm. The graph represents the pathological visual score of EGFR and MET in tumor tissue. Scores were assigned as follows: +0 (no expression), +1 (low expression), +2 (moderate expression), and +3 (high expression).

Similar articles

References

    1. Kris M.G., Johnson B.E., Berry L.D., Kwiatkowski D.J., Iafrate A.J., Wistuba I.I., Varella-Garcia M., Franklin W.A., Aronson S.L., Su P.F., et al. Using multiplexed assays of oncogenic drivers in lung cancers to select targeted drugs. JAMA. 2014;311:1998–2006. - PMC - PubMed
    1. Travis W.D., Brambilla E., Nicholson A.G., Yatabe Y., Austin J.H.M., Beasley M.B., Chirieac L.R., Dacic S., Duhig E., Flieder D.B., et al. The 2015 World Health Organization Classification of Lung Tumors: Impact of Genetic, Clinical and Radiologic Advances Since the 2004 Classification. J. Thorac. Oncol. 2015;10:1243–1260. - PubMed
    1. Harrison P.T., Vyse S., Huang P.H. Rare epidermal growth factor receptor (EGFR) mutations in non-small cell lung cancer. Semin. Cancer Biol. 2020;61:167–179. - PMC - PubMed
    1. Wu Y.L., Cheng Y., Zhou X., Lee K.H., Nakagawa K., Niho S., Tsuji F., Linke R., Rosell R., Corral J., et al. Dacomitinib versus gefitinib as first-line treatment for patients with EGFR-mutation-positive non-small-cell lung cancer (ARCHER 1050): a randomised, open-label, phase 3 trial. Lancet Oncol. 2017;18:1454–1466. - PubMed
    1. Soria J.C., Ohe Y., Vansteenkiste J., Reungwetwattana T., Chewaskulyong B., Lee K.H., Dechaphunkul A., Imamura F., Nogami N., Kurata T., et al. Osimertinib in Untreated EGFR-Mutated Advanced Non-Small-Cell Lung Cancer. N. Engl. J. Med. 2018;378:113–125. - PubMed

Publication types

MeSH terms