. 2025 Feb 11;19(5):5146-5157.
doi: 10.1021/acsnano.4c06489. Epub 2025 Jan 28.

Partially Bonded Crystals: A Pathway to Porosity and Polymorphism

Affiliations

Partially Bonded Crystals: A Pathway to Porosity and Polymorphism

Carina Karner et al. ACS Nano. .

Abstract

In recent years, experimental and theoretical investigations have shown that anisotropic colloids can self-organize into ordered porous monolayers, where the interplay of localized bonding sites, so-called patches, with the particle's shape is responsible for driving the systems away from close-packing and toward porosity. Until now it has been assumed that patchy particles have to be fully bonded with their neighboring particles for crystals to form, and that, if full bonding cannot be achieved due to the choice of patch placement, disordered assemblies will form instead. In contrast, we show that by deliberately displacing the patches such that full bonding is disfavored, a different route to porous crystalline monolayers emerges, where geometric frustration and partial bonding are decisive process. The resulting dangling bonds lead to the emergence of effectively chiral units which then act as building blocks for energetically equivalent crystal polymorphs.

Keywords: frustration; patchy colloids; polymorphism; self-assembly; shape-anisotropy.


Conflict of interest statement

The authors declare no competing financial interest.

Figures

Figure 1
Figure 1
Particle types, pair bonding motifs and full bonding failures. All studied particle types (top row) and example bonding motifs where full bonding either fails or is disfavored (framed panels). To facilitate the distinction between the particle types, we highlight the triangle area spanned by patches of the same type, with their enclosed edge in a darker shade. The particle types are (a) dmo-as1 (b) dmo-s1, (c) dmo-s2, (d) dma-as1. In (e, f) we depict the two modes of bonding available for rhombus particles: parallel (e) and nonparallel (f). In (g) we show motifs with overlaps for dmo-as1 and dma-as1; (h) depicts a dmo-s1 motif where full bonding is possible only under strain; (i) shows an instance for incompatible bonding for dmo-s2, where relative patch placement prevents full bonding; in (j) we depict how the bonding motif can force patches of different type to face each other, resulting in an energetic penalty, as exemplified by dmo-s1.
Figure 2
Figure 2
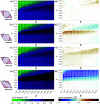
Average number of bonded neighbors (left) and average bond orientation (right). Heat maps for the average number of bonded neighbors, ⟨b⟩, and the average bond orientation, ⟨η⟩, across all investigated state points (with ϕ = 0.05–0.525 and T = 0.01–0.16) for all studied particle types. At each data point averages are obtained according to the standard statistics procedure (see Section III). (a1–d1) Heat maps for ⟨b⟩ for dmo-as1 (a1), dmo-s1 (b1), dmo-s2 (c1) and dma-as1 (d1), where the minimum is zero bonds (bright green) and the maximum is four bonds (dark blue). (a2–d2) Heat maps for the average bond orientation ⟨η⟩ for dmo-as1 (a2), dmo-s1 (b2), dmo-s2 (c2) and dma-as1 (d2), where ⟨η⟩ = −1/+1 denotes the extremes where all bonds are nonparallel (dark blue)/parallel (dark orange) and ⟨η⟩ = 0 indicates state points with mixed bonding on average (white).
Figure 3
Figure 3
Crystal polymorphs (top) emerging from the geometric frustration of a close-packed tiling (bottom). Snapshots and sketches of emerging crystal polymorphs for dmo-as1 (a-panels) in comparison to bonding motifs in the roof-shingle tiling observed for dmo-c (b-panels), where all patches are in the center of their respective edge., Particles within the simulation snapshots are colored according to the number and orientations (parallel, p, or nonparallel, np) of their bonds. The sketches below the snapshots highlight that all depicted crystals are formed by particles with three out of four patches bonded: either two blue and one red bond (red particles) or two red and one blue bond (blue particles); red and blue particles are chiral to each other (see legend in a5). (a1) Parallel crystal (P3), where each particle has three p-bonds, snapshot taken at ϕ = 0.4, T = 0.14. The sketch below the snapshot illustrates that P3 is a solid solution of red and blue particles. (a2) Zigzag crystal (Z1), where each particle has two np- and one p-bond, snapshot taken at ϕ = 0.225, T = 0.12. The sketch below the snapshot shows that Z1 is a racemic crystal with an equal amount of red and blue particles. (a3) Star crystal (S), where each particle has two np- and one p-bond, where the np-bonds are arranged in a loop of six np-particles (star), snapshot taken at ϕ = 0.475, T = 0.15. The sketch below the snapshot shows that S appears in two homochiral forms—one form containing only the red particles and one only containing the blue particles. (a4) Legend for coloring of particles in the snapshots. The naming generally follows the scheme a-np-b-p, where a is the number of np-bonds and b is the number of p-bonds. Exceptions are 1- and 2-np/p, which refers to particles with only one or two np-/p-bonds, and 6-np-loops, which refers to particles within a closed loop of six np-particles. (b1) Sketch highlighting the fully bonding parallel motif within the observed roof-shingle tiling for dmo-c. (b2) Sketch highlighting the zigzag motif with the observed roof-shingle tiling for dmo-c. (b3) Sketch highlighting the star motif within the observed roof-shingle tiling dmo-c.
Figure 4
Figure 4
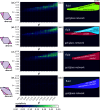
Overview of the observed crystal polymorphs and their relative abundance. (a–c) Snapshots and sketches of emerging crystal structures for dmo-as1, dmo-s1 and dmo-s2 as well as (e–g) heat maps quantifying their relative abundance across different state points (ϕ,T). Particles in snapshots are colored according to the number and orientation of bonded neighbors (see legend in (d) with the labeling scheme reported in Figure 3), the corresponding values of ϕ and T of each snapshot are reported by the labels. The crystal lattices are sketched at the left corner of each snapshot, while at the bottom right corner the corresponding zoomed-out, gray scale snapshot is reproduced. (a) dmo-as1: (a1) parallel crystal P3, (a2) zigzag crystal Z1, (a3) star crystal S. (b) dmo-s1: (b1) fully bonded parallel lattice P4, (b2) zigzag lattices Z1 and Z2. (c) dmo-s2: (c1) Parallel lattice (P3) and zigzag lattices PZ and Z3. (e–g) Heat maps showing the relative abundance of the three most dominant crystal structures for each particle type across all state points (ϕ = 0.01–0.525, T = 0.01–0.16). Relative percentages were obtained by the crystal structure detection algorithm and averaged according to the standard statistics procedure (see Section III). Color mapping is conducted via a the ternary color maps on the lower right corner, where gray indicates state points where percentage of crystalline particles of any kind is below 0.05. For each data point the averages were obtained according to the standard statistics procedure (see Section III). (e) Relative abundance heat map for most dominant crystals (e) P3,Z1 and S for dmo-as1, (f) P4, Z2 and Z1 for dmo-s1, (g) P3, PZ and Z3 for dmo-s2.
Figure 5
Figure 5
Absolute abundance of crystal polymorphs (left) and overview of the investigated state diagrams (right). Heat maps (a1–d1) for the overall average crystallinity, ⟨ξ⟩, for all studied particle types across all state points (with ϕ = 0.01–0.525 T = 0.01–0.16), and sketches (a2–d2) for the dynamic state diagrams. Crystallinity heat map for (a1) dmo-as1, (b1) dmo-s1, (c1) dmo-s2, (d1) dma-as1. Dynamic state diagram for (a2) dmo-as1, (b2) dmo-s1, (c2) dmo-s2, (d2) dma-as1.
Figure 6
Figure 6
Comparison of overall crystallinity for dmo-as1 systems at different packing fractions ϕ and temperatures T for (a) shorter runs (a zoom in of the heat map depicted in Figure 5a1) at MC sweeps ≈2.5 × 10⁷ and (b) longer runs at MC sweeps ≈3.5 × 10⁷.

Similar articles

References

    1. Pawar A. B.; Kretzschmar I. Fabrication, assembly, and application of patchy particles. Macromol. Rapid Commun. 2010, 31, 150–168. 10.1002/marc.200900614. - DOI - PubMed
    1. Bianchi E.; Blaak R.; Likos C. N. Patchy colloids: state of the art and perspectives. Phys. Chem. Chem. Phys. 2011, 13, 6397–6410. 10.1039/c0cp02296a. - DOI - PubMed
    1. Sacanna S.; Pine D. J. Shape-anisotropic colloids: Building blocks for complex assemblies. Curr. Opin. Colloid Interface Sci. 2011, 16, 96–105. 10.1016/j.cocis.2011.01.003. - DOI
    1. Walther A.; Muller A. H. Janus particles: synthesis, self-assembly, physical properties, and applications. Chem. Rev. 2013, 113, 5194–5261. 10.1021/cr300089t. - DOI - PubMed
    1. Boles M. A.; Engel M.; Talapin D. V. Self-Assembly of Colloidal Nanocrystals: From Intricate Structures to Functional Materials. Chem. Rev. 2016, 116, 11220–11289. 10.1021/acs.chemrev.6b00196. - DOI - PubMed

LinkOut - more resources