. 2025 Jan 28;16(1):1112.
doi: 10.1038/s41467-024-54676-2.

Single-cell transcriptomics of bronchoalveolar lavage during PRRSV infection with different virulence

Affiliations

Single-cell transcriptomics of bronchoalveolar lavage during PRRSV infection with different virulence

Byeonghwi Lim et al. Nat Commun. .

Abstract

Porcine reproductive and respiratory syndrome virus (PRRSV) causes significant economic losses in the global swine industry due to its high genetic diversity and different virulence levels, which complicate disease management and vaccine development. This study evaluated longitudinal changes in the immune cell composition of bronchoalveolar lavage fluid and the clinical outcomes across PRRSV strains with varying virulence, using techniques including single-cell transcriptomics. In highly virulent infection, faster viral replication results in an earlier peak lung-damage time point, marked by significant interstitial pneumonia, a significant decrease in macrophages, and an influx of lymphocytes. Viral tracking reveals less than 5% of macrophages are directly infected, and further analysis indicates bystander cell death, likely regulated by exosomal microRNAs as a significant factor. In contrast, the peak intermediate infection shows a delayed lung-damage time point with fewer cell population modifications. Furthermore, anti-inflammatory M2-like macrophages (SPP1-CXCL14high) are identified and their counts increase during the peak lung-damage time point, likely contributing to local defense and lung recovery, which is not observed in high virulent infection. These findings provide a comprehensive description of the immune cellular landscape and differential PRRSV virulence mechanisms, which will help build new hypotheses to understand PRRSV pathogenesis and other respiratory infections.


Conflict of interest statement

Competing interests: The authors declare no competing interests.

Figures
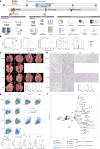
Fig. 1
Fig. 1. Study design, clinical outcomes, and immune responses in bronchoalveolar lavage fluid (BALF) with porcine reproductive and respiratory syndrome virus (PRRSV) infections of varying virulence.
a Schematic representation of the study design. b Clinical outcomes including average daily weight gain (ADWG), serum viremia, S/P ratio of PRRSV-specific IgG, lung viral load, and serum IFN-α protein levels of each pig from negative control (n = 12) and PRRSV-infected groups including NA8 (n = 6), JA142 (n = 12) and NA10 (n = 6). Circles indicate a single biological replication and the data are presented as mean values ± SEM. c Representative gross and histopathological appearances of the lungs in each group. Gross lung lesion scores were calculated as the average of the five lobes measured on a range of 0–50. Circles indicate a single biological replication and the data are presented as mean values ± SEM. d Representative histopathologic appearance of the lung in each group. The microscopic score for lung lesions measured the extent of interstitial pneumonia in the five lobes of the lung, ranging from 0 to 3 and then averaged. The scale bar size indicates 100 μm. Circles indicate a single biological replication and the data are presented as mean values ± SEM. e Representative flow cytometry dot plot of BALF cells and proportion of each cell type (CD163+ cells, CD3+ cells, CD4+ T cells and CD8+ T cells). Red circles indicate normal PAMs, pink circles indicate lymphocytes, and red arrows indicate decreased PAMs. In the scatter plot, circles indicate a single biological replication and the data are presented as mean values ± SEM. f Principal Components Analysis (PCA) of clinical outcomes and immune responses measured in this study. Statistical analysis was performed using two-way ANOVA analysis with Tukey’s multiple comparisons test for four groups (0, 3, and 7 dpi) or Sidak’s multiple comparison test for two groups (14 and 21 dpi). For ADWG, one-way Kruskal–Wallis test (0–7 dpi) and two-tailed Mann–Whitney test (7–14 dpi and 14–21 dpi) was performed. Statistically significant differences between groups have been marked with asterisks (*p ≤ 0.05. **p ≤ 0.01. ***p ≤ 0.001. ****p ≤ 0.0001) or letters (p < 0.05) for serum viremia and PRRSV-specific IgG. Source data are provided as a Source Data file.
Fig. 2
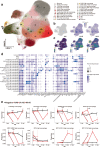
Fig. 2. Single-cell transcriptomes of bronchoalveolar lavage fluid (BALF) cells from negative and porcine reproductive and respiratory syndrome virus (PRRSV)–infected pigs.
a Uniform Manifold Approximation and Projection (UMAP) of 306,052 BALF cells from negative (n = 12), NA8-infected (n = 6), JA142-infected (n = 12), and NA10-infected (n = 6) pigs. The colors indicate annotated cell types. b UMAP showing three cell categories (myeloid, lymphoid, and epithelial). c Specific marker gene expression levels for seven basic cell types. Average expression levels were calculated using log-normalized values. d Time-serial UMAP projection at 3 (n = 34,040), 7 (n = 32,433), 14 (n = 27,531), and 21 (n = 23,035) dpi for the negative; 3 (n = 33,989) and 7 (n = 27,926) dpi for the NA8; 3 (n = 27,361), 7 (n = 27,011), 14 (n = 15,114), and 21 (n = 14,322) dpi for the JA142; and 3 (n = 31,525) and 7 (n = 11,765) dpi for the NA10 groups with annotations for the cell categories (myeloid, lymphoid, and epithelial). e Average cell numbers for each time point and group. f Time-series viral tracking based on the log-normalized ORF7 expression levels in each virulence group (NA8, JA142, and NA10). g Time-series proportions for the cell categories (myeloid, lymphoid, and epithelial). h Average proportion of infected myeloid cells at each time point and for each virulence group. e, h Each group is depicted using a box-and-whisker plot, illustrating three biological replications. The lower boundary of the box corresponds to the first quartile (Q1), the middle line marks the median, and the upper boundary represents the third quartile (Q3). The whiskers extend to indicate the minimum and maximum values within the dataset, respectively. Different lowercase letters above box indicate significant differences (p < 0.05) determined using one-way ANOVA analysis with Tukey’s multiple comparison test. Source data are provided as a Source Data file.
Fig. 3
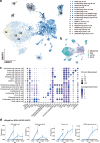
Fig. 3. Subpopulation analysis of the macrophages and dendritic cells (DCs).
a UMAP of the macrophage and DC subpopulation (n = 283,735), comprising 23 sub-cell types, in all groups. Colors and numbers indicate sub-cell types of the macrophages and DCs. Viral tracking of the macrophages and DC subpopulation based on the b log-normalized ORF7 expression levels in each virulence group (NA8, JA142, and NA10) and c log-normalized ORF7 expression density. Red circles indicate common high-density regions in JA142 and NA10. Yellow circles indicate different high-density regions in JA142 and NA10. d Specific marker gene expression levels for 23 sub-cell types. Average expression levels were calculated using log-normalized values. e Time-serial proportions of the representative sub-cell types in each group (negative; black, NA8; light red, JA142; red, and NA10; dark red). Dots indicate three biological replications and the data are presented as mean values ± SD. Statistically significant differences between groups are marked with exclamation (!, NA8-negative), asterisk (*, JA142-negative), circumflex (^, NA10-negative), ampersand (&, NA10-JA142), hash (#, JA142-NA8), and dollar ($, NA10-NA8) signs. Significant differences (p < 0.05) determined using one-way ANOVA analysis with Tukey’s multiple comparison test. Source data are provided as a Source Data file.
Fig. 4
Fig. 4. Subpopulation analysis of natural killer (NK) and T cells.
a Uniform Manifold Approximation and Projection (UMAP) of the NK and T cell subpopulation (n = 13,772), consisting of 18 sub-cell types, in all groups. Colors and numbers indicate sub-cell types for the NK and T cells. b UMAP of the NK and T cell subpopulations with group annotations (negative, NA8, JA142, and NA10). c Specific marker gene expression levels for 18 sub-cell types. Average expression levels were calculated using log-normalized values. d Time-series proportions for representative sub-cell types in each group (negative; black, NA8; light blue, JA142; blue, and NA10; dark blue). Dots indicate three biological replications and the data are presented as mean values ± SD. Error bars indicate standard deviations. Statistically significant differences between groups are marked with exclamation (!, NA8-negative), asterisk (*, JA142-negative), circumflex (^, NA10-negative), ampersand (&, NA10-JA142), hash (#, JA142-NA8), and dollar ($, NA10-NA8) signs. Significant differences (p < 0.05) determined using one-way ANOVA analysis with Tukey’s multiple comparison test. Source data are provided as a Source Data file.
Fig. 5
Fig. 5. Subpopulation analysis of B cells.
a Uniform Manifold Approximation and Projection (UMAP) of the B cell subpopulation (n = 6,226), consisting of 17 sub-cell types, in all groups. Colors and numbers indicate sub-cell types for the B cells. The superscript D indicates doublet possibility. b UMAP of the B cell subpopulation with group annotation (negative, NA8, JA142, and NA10). c Specific marker gene expression levels for 17 sub-cell types. Average expression levels were calculated using log-normalized values. d Time-serial proportions of representative sub-cell types in each group (negative; black, NA8; light blue, JA142; blue, and NA10; dark blue). Dots indicate three biological replications and the data are presented as mean values ± SD. Error bars indicate standard deviations. Statistically significant differences between groups are marked with exclamation (!, NA8-negative), asterisk (*, JA142-negative), circumflex (^, NA10-negative), ampersand (&, NA10-JA142), hash (#, JA142-NA8), and dollar ($, NA10-NA8) signs. Significant differences (p < 0.05) determined using one-way ANOVA analysis with Tukey’s multiple comparison test. Source data are provided as a Source Data file.
Fig. 6
Fig. 6. Gene set enrichment analysis of PRRSV-infected and bystander cells for each time point and virulence group (JA142 and NA10).
a The heatmap was generated with more than 20 cell counts using z-score standardized enrichment scores. Significant differences (p < 0.05) determined using one-way ANOVA analysis with Tukey’s multiple comparison test. At least one significant term among group comparisons was used. b Key genes based on the differential expression gene analyses. Different lowercase letters above violin indicate significant differences (p < 0.05) determined using one-way ANOVA analysis with Tukey’s multiple comparison test. Source data are provided as a Source Data file.
Fig. 7
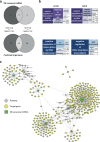
Fig. 7. Functional comparisons of the exosomal microRNAs (miRNAs) in the JA142 and NA10 groups.
a Venn diagram showing differentially expressed (DE) exosomal miRNAs and their predicted target genes at specific time points in the JA142 (14 dpi) and NA10 (7 dpi) groups based on the negative group. b Functional enrichment visualized using treemaps based on gene ontology (GO) analysis for the predicted target genes of the JA142 (14 dpi) and NA10 (7 dpi) groups. Upper and lower parts indicate the results when using target genes for the miRNAs with upregulated and downregulated expressions, respectively. c Functional network using significant KEGG pathways with DE exosomal miRNAs and their target genes, obtained from comparisons of the NA10 (7 dpi) and JA142 (14 dpi) groups. Node size increases with the number of interactions (edges).
Fig. 8
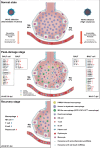
Fig. 8. Illustration of chronological order of lung recovery and bystander cell death according to the virulence of PRRSV observed in this study.
Lung microenvironment illustration showing cellular changes in the normal state, peak-damage stage, and recovery stage. Peak-damage stage is separated to show the JA142 (14 dpi; left) and NA10 (7 dpi; right) groups separately. Recovery stage is shown for the JA142 (21 dpi; left) group. Cytokine and RNA expression changes in the BALF cells are shown in the peak-damage stage. In the recovery stage, the proportion of macrophages is partially recovered, and the cytokine and RNA expression levels are returned to a normal state, similar to that of the negative control.

References

    1. Duan, X., Nauwynck, H. & Pensaert, M. Effects of origin and state of differentiation and activation of monocytes/macrophages on their susceptibility to porcine reproductive and respiratory syndrome virus (PRRSV). Arch. Virol.142, 2483–2497 (1997). - PMC - PubMed
    1. Ogno, G. et al. Impact of PRRSV strains of different in vivo virulence on the macrophage population of the thymus. Vet. Microbiol.232, 137–145 (2019). - PubMed
    1. Teifke, J. et al. Detection of European porcine reproductive and respiratory syndrome virus in porcine alveolar macrophages by two-colour immunofluorescence and in-situ hybridization-immunohistochemistry double labelling. J. Comp. Pathol.124, 238–245 (2001). - PubMed
    1. Lunney, J. K. et al. Porcine reproductive and respiratory syndrome virus (PRRSV): pathogenesis and interaction with the immune system. Annu. Rev. Anim. Biosci.4, 129–154 (2016). - PubMed
    1. Montaner-Tarbes, S., Del Portillo, H. A., Montoya, M. & Fraile, L. Key gaps in the knowledge of the porcine respiratory reproductive syndrome virus (PRRSV). Front. Vet. Sci.6, 38 (2019). - PMC - PubMed

MeSH terms