. 2025 Jan 28;16(1):1109.
doi: 10.1038/s41467-025-56294-y.

Activation of lysophagy by a TBK1-SCFFBXO3-TMEM192-TAX1BP1 axis in response to lysosomal damage

Affiliations

Activation of lysophagy by a TBK1-SCFFBXO3-TMEM192-TAX1BP1 axis in response to lysosomal damage

Na Yeon Park et al. Nat Commun. .

Abstract

Lysophagy eliminates damaged lysosomes and is crucial to cellular homeostasis; however, its underlying mechanisms are not entirely understood. We screen a ubiquitination-related compound library and determine that the substrate recognition component of the SCF-type E3 ubiquitin ligase complex, SCFFBXO3(FBXO3), which is a critical lysophagy regulator. Inhibition of FBXO3 reduces lysophagy and lysophagic flux in response to L-leucyl-L-leucine methyl ester (LLOMe). Furthermore, FBXO3 interacts with TMEM192, leading to its ubiquitination in LLOMe-treated cells. We also identify TAX1BP1 as a critical autophagic adaptor that recognizes ubiquitinated TMEM192 during lysophagy and find that TBK1 activation is crucial for lysophagy, as it phosphorylates FBXO3 in response to lysosomal damage. Knockout of FBXO3 significantly impairs lysophagy, and its reconstitution with a loss-of-function mutant (V221I) further confirms its essential role in lysophagy regulation. Collectively, our findings highlight the significance of the TBK1-FBXO3-TMEM192-TAX1BP1 axis in lysophagy and emphasize the critical role of FBXO3 in lysosomal integrity.


Conflict of interest statement

Competing interests: The authors declare no competing interests.

Figures
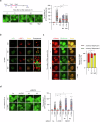
Fig. 1
Fig. 1. Inhibition of FBXO3 reduces clearance of Gal3 puncta and lysophagic flux in HepG2 cells.
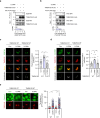
a HepG2/GFP-Gal3 cells were cotreated with LLOMe (750 µM), along with either bafilomycin A1 (Baf) at 10 nM or BC-1215 (BC) at 50 µM for 2 h. After the 2-h treatment, the cells were washed with fresh medium and further incubated with normal culture media containing either Baf or BC for 24 h. Subsequently, the number of punctate structures expressing GFP-Gal3 per cell was quantified. b HepG2 cells were cotreated with LLOMe, along with either Baf or BC for 2 h. Following treatment, the cells were washed with fresh medium and subsequently incubated with normal culture media containing either Baf or BC for an additional 24 h. Then, the cells were stained with anti-LAMP1 and anti-LC3 antibodies and imaged using confocal microscopy. Scale bar: 5 µm. c HepG2/CH-Gal3 cells were cotreated with LLOMe and either Baf or BC-1215 for 2 h. After the 2-h treatment, LLOMe was removed, and the cells were incubated with normal cell media in the presence of either Baf or BC-1215 for 24 h. The number of mCherry- and SEpHluorin-double-positive-Gal3 puncta (mCherry+/SEpHluorin+) or mCherry-positive/SEpHluorin-negative-Gal3 puncta (mCherry+/SEpHluorin) per cell was counted. A total of 300 individual HepG2 cells were counted. d HepG2/GFP-Gal3 cells were transfected with either scrambled siRNA (Sc), siRNA targeting FBXO3 (siFBXO3), or siRNA targeting ATG5 (siATG5) for a period of 48 h. Following transfection, the cells were treated with LLOMe for 2 h. After the 2-h treatment, the cells were washed and incubated with normal cell culture media for 24 h. The number of GFP-Gal3 puncta per cell was counted. Data in all panels are presented as the mean ± SEM. Significance was calculated by two-tailed unpaired t-test (*p < 0.0001). Data were obtained from at least three independent experiments, with each dot in the plot representing an individual HepG2 cell (n = 300). Scale bar: 10 µm. Source data are provided as a Source Data file.
Fig. 2
Fig. 2. FBXO3 interacts with TMEM192 and mediates ubiquitination of TMEM192 in LLOMe-treated HepG2 cells.
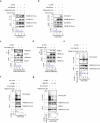
a, b HepG2 cells transiently expressing both HA-FBXO3 and TMEM192-FLAG were treated with LLOMe (750 µM) for 2 h and immunoprecipitated with agarose beads-conjugated anti-HA or anti-FLAG antibodies. The immunoprecipitates were analyzed by western blotting. Data in panel a are presented as the mean (n = 2), and data in panel b are presented as the mean ± SEM (n = 3, * p = 0.0002). c, d HepG2 cell lysates treated with LLOMe (750 µM) were immunoprecipitated using either anti-FBXO3 or anti-TMEM192 antibodies. Then, the immune complexes were analyzed by western blotting. Data in panel c are presented as the mean ± SEM (n = 3, *p < 0.0001), and data in panel d are presented as the mean ± SEM (n = 3, *p = 0.0438). e HepG2 cells expressing TMEM192-FLAG wild type (WT) or a mutant (TMEM192 K201,211,237,246,254R) along with HA-ubiquitin were treated with LLOMe for 2 h. And then, the cells were subjected to immunoprecipitation using agarose-conjugated anti-FLAG antibody. The immunoprecipitates were analyzed by western blotting. Data are presented as the mean ± SEM (n = 3, *p = 0.0044, **p = 0.0023). f HepG2 cells overexpressing both HA-ubiquitin and TMEM192-FLAG were pretreated with BC-1215, and then cotreated with LLOMe for an additional 2 h. Subsequently, the cells were immunoprecipitated using anti-FLAG antibody conjugated to agarose beads. The immunoprecipitates were further analyzed by western blotting. Data are presented as the mean ± SEM (n = 3, *p = 0.0015). g HepG2 cells were transfected with either scrambled siRNA or siRNA targeting FBXO3 siRNA in combination with HA-ubiquitin and TMEM192-FLAG for 72 h. After 72 h, the cells were treated with LLOMe for 2 h and subjected to immunoprecipitation using agarose-conjugated anti-FLAG antibody. The immune complexes were analyzed by western blotting. Data are presented as the mean ± SEM (n = 3, *p = 0.0005, **p = 0.0001). All experiments were replicated three times except a (twice replicates). Two-tailed unpaired t-test were used to analyzed the data. Source data are provided as a Source Data file.
Fig. 3
Fig. 3. TMEM192 interacts with SQSTM1 and TAX1BP1 as autophagic adaptors in response to lysosomal damage.
a, b HepG2 cells expressing TMEM192-FLAG were treated with LLOMe (750 µM, 2 h) and immunoprecipitated with an anti-FLAG antibody conjugated with agarose beads. Then, the cells were analyzed by western blotting. Data in the panel a are presented as the mean ± SEM, with each dot in the plot representing independent replicates of the experiment (n = 3, *p = 0.0021). Data in the panel b are presented as the mean ± SEM, with each dot in the plot representing independent replicates of the experiment (n = 3, *p = 0.0452). c HepG2 cells transiently expressing pEGFP-SQSTM1 in combination with TMEM192-FLAG wild type (WT) or ubiquitination-defective mutant (MT) were treated with LLOMe. The cells were stained with an anti-FLAG antibody and imaged using confocal microscopy. The colocalization extent of TMEM192 with SQSTM1 was analyzed using Pearson’s correlation coefficients. Data are presented as the mean ± SEM (n = 20, *p < 0.0001). d HepG2 cells were transiently transfected with pTAX1BP1-EGFP in combination with TMEM192-FLAG WT or MT and then treated with LLOMe. Following treatment, the cells were stained with an anti-FLAG antibody and imaged using confocal microscopy. The degree of colocalization between TMEM192 and TAX1BP1 was quantified using Pearson’s correlation coefficients. Data are presented as the mean ± SEM (n = 20, *p = 0.0025, **p = 0.0004). e HepG2/GFP-Gal3 cells transiently expressing TMEM192-FLAG WT or MT and treated with LLOMe for 2 h. After treatment, cells were washed and incubated with fresh culture medium for an additional 24 h. Then, the cells were stained with an anti-FLAG antibody and imaged using fluorescence microscopy. The number of GFP-Gal3 puncta per cell expressing TMEM192-FLAG WT or MT was counted. Data are presented as the mean ± SEM (n = 300, *p < 0.0001). Scale bar: 10 µm. All experiments were replicated three times. Each dot in the plot c, d, and e represents an individual HepG2 cell. Two-tailed unpaired t-test were used to analyzed all the data. Source data are provided as a Source Data file.
Fig. 4
Fig. 4. TBK1 is activated and mediates phosphorylation of FBXO3 in LLOMe-treated HepG2 cells.
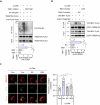
a, b HepG2/GFP-Gal3 cells were treated with either MRT67307 (2 µM) or GSK8612 (10 µM) in combination with LLOMe (750 µM). After the 2-h treatment, LLOMe was washed out with normal cell culture media, and the cells were further incubated with either MRT67307 or GSK8612 for 24 h. The number of GFP-Gal3 puncta was quantified, and the cells were further analyzed by western blotting using the indicated antibodies. Data are presented as the mean ± SEM, with each dot in the plot representing an individual HepG2 cell (n = 300, *p < 0.0001). Scale bar: 10 µm. c HepG2 cells transiently expressing both GFP-TBK1 and HA-FBXO3 were treated with LLOMe. Subsequently, the cells were subjected to immunoprecipitation using an anti-HA antibody conjugated with agarose beads. The immunoprecipitates were further analyzed by western blotting using the indicated antibodies. Data in all panels are presented as the mean (n = 2). d HepG2 cells were treated with LLOMe and subsequently lysed. The cell lysates were subjected to immunoprecipitation using an anti-FBXO3 antibody. Then, the immunoprecipitates were analyzed by western blotting using the indicated antibodies. Data are presented as the mean ± SEM, with each dot in the plot representing independent triplicate replicates of the experiment (n = 3, *p = 0.0212). e HepG2 cells overexpressing either HA or HA-FBXO3 were pretreated with MRT67307 (2 µM) for 2 h, followed by cotreatment with LLOMe. The cells were then subjected to analysis by Phos-tag™ SDS-PAGE and western blotting using the indicated antibodies. All experiments were replicated three times except c (twice replicates). Two-tailed unpaired t-test were used to analyzed all the data. Source data are provided as a Source Data file.
Fig. 5
Fig. 5. Effect of TBK1-FBXO3-TMEM192-TAX1BP1 axis on LLOMe-induced lysophagy.
a HepG2 cells were transfected with both HA-ubiquitin and TMEM192-FLAG and pretreated with either MRT67307 (2 µM) or GSK8612 (10 µM). LLOMe was cotreated for an additional 2 h. Subsequently, the cells were immunoprecipitated with agarose bead-conjugated anti-FLAG antibody and further analyzed by western blotting using the indicated antibodies. Data are presented as the mean ± SEM, with each dot in the plot representing independent triplicate replicates of the experiment (n = 3, *p = 0.0446, **p = 0.0257, ***p = 0.0088). b HepG2 cells overexpressing both GFP-TMEM192 and TAX1BP1-FLAG were pretreated with either BC-1215 or GSK8612. LLOMe was cotreated for an additional 2 h. The cells were then pulled down with an anti-GFP antibody conjugated with agarose beads and further analyzed by western blotting using the indicated antibodies. Data are presented as the mean ± SEM, with each dot in the plot representing independent triplicate replicates of the experiment (n = 3, *p = 0.0171, **p = 0.0006, ***p = 0.0002). c HepG2 cells transiently expressing GFP-LC3 and TMEM192-FLAG were pretreated with either BC-1215 or GSK8612 and cotreated with LLOMe. Subsequently, the cells were stained with an anti-FLAG antibody and imaged by confocal microscopy. The colocalization extent of TMEM192 with LC3 was analyzed using Pearson’s correlation coefficients. Data are presented as the mean ± SEM, with each dot in the plot representing an individual HepG2 cell (n = 15, *p = 0.0031, **p < 0.0001). Scale bar: 10 µm. All experiments were replicated three times. Two-tailed unpaired t-test were used to analyzed all the data. Source data are provided as a Source Data file.
Fig. 6
Fig. 6. Association of FBXO3 with LLOMe-induced lysophagy in FBXO3 knockout HepG2 cells.
a FBXO3 wild-type (WT) and knockout (KO) HepG2 cells were analyzed using western blotting with an FBXO3 antibody. Data are presented as the mean (n = 2). b FBXO3 WT and KO HepG2 cells expressing GFP-Gal3 were treated with LLOMe (2 mM, 3 h), washed, and incubated with fresh medium. The number of GFP-Gal3 puncta per cell was counted. Data are presented as the mean ± SEM, with each dot representing an individual HepG2 cell (n = 470, *p < 0.0001). Scale bar: 10 µm. c FBXO3 WT and KO HepG2 cells expressing HA-ubiquitin and TMEM192-FLAG were treated with LLOMe. The cells were immunoprecipitated with anti-TMEM192 antibody and analyzed by western blotting. Data are presented as the mean ± SEM (n = 3, *p = 0.0174, **p = 0.0011). d FBXO3 WT and KO HepG2 cells expressing EGFP-TMEM192 and TAX1BP1-FLAG were treated with LLOMe. Then, the cells were immunoprecipitated with anti-EGFP antibody conjugated with agarose beads and analyzed by western blotting. Data are presented as the mean (n = 2, *p = 0.0355, **p = 0.0066). e FBXO3 WT and KO HepG2 cells transiently expressing mCherry-Gal3 were reconstituted with empty EGFP, EGFP-FBXO3 WT, or EGFP-FBXO3 V221I. The cells were treated with LLOMe, washed, and incubated with fresh culture medium for 24 h. The number of mCherry-Gal3 puncta per cell was counted. Data are presented as the mean ± SEM, with each dot representing an individual HepG2 cell (n = 200, *p < 0.0001). Scale bar: 10 µm. f FBXO3 WT and KO HepG2 cells expressing HA-ubiquitin in combination with empty EGFP, EGFP-FBXO3 WT, or V221I were treated with LLOMe. The cells were then immunoprecipitated with anti-TMEM192 antibody and analyzed by western blotting. Data are presented as the mean ± SEM (n = 3, *p = 0.0161, **p = 0.0039). All experiments were replicated three times except d (twice replicates). Each dot in the plot a, c, d, and f represents independent replicates of the experiment. Two-tailed unpaired t-test were used to analyzed all the data. Source data are provided as a Source Data file.
Fig. 7
Fig. 7. Association of TBK1-FBXO3-TMEM192-TAX1BP1 axis with LLOMe-induced lysophagy in Drosophila model.
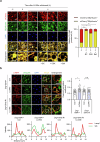
a Cotreatment of Baf, BC-1215, or GSK8612 with LLOMe showed decrease of mCherry+/SEpHluorin- Gal3 puncta in larva fat body. The number of mCherry/SEpHluorin puncta per cell was quantified. Data are presented as the mean ± SEM (n = 150, *p = 0.0003, **p < 0.0001). A total of 150 individual larva fat body cells were counted. Scale bar: 20 µm. b Feeding third-instar larvae of control (Dcg-Gal4/+) and Slmb knockdown (Dcg>Slmb Ri) flies were fed with normal fly food containing LLOMe. After a 2-h feeding period, larvae in the wandering stage were dissected, costained with anti-ubiquitin and anti-LAMP1 antibodies, and subsequently imaged using confocal microscopy. The colocalization of LAMP1 and ubiquitin staining was analyzed by Pearson’s correlation coefficient and line colocalization. The fluorescence intensities of both LAMP1 and Ubiquitin were quantified. Data are presented as the mean ± SEM, with each dot in the plot representing an individual fat body cell (n = 30, *p < 0.0001). Scale bar: 20 µm. All experiments were replicated three times. Two-tailed unpaired t-test were used to analyzed all the data. Source data are provided as a Source Data file.
Fig. 8
Fig. 8. Schematic diagram of a lysophagy regulatory mechanism by TBK1-FBXO3-TMEM192-TAX1BP1 axis.
Lysosomotropic agents, such as LLOMe, induce lysosomal damage. With severe damage, the ruptured lysosomes are degraded by lysosome selective autophagy, lysophagy. In response to lysosomal rupture, TBK1 is activated via phosphorylation on S172 and mediates phosphorylation of FBXO3, a component of SCF E3 ligase complex. Subsequently, the FBXO3 mediates ubiquitination of lysosomal membrane protein TMEM192. This ubiquitination promotes the recruitment of autophagy adaptor protein SQSTM1 or TAX1BP1 and other autophagic machineries, leading to the degradation of damaged lysosomes. Some icons were created in BioRender. Jo, D. (2025) https://BioRender.com/g56j185.

References

    1. Settembre, C., Fraldi, A., Medina, D. L. & Ballabio, A. Signals from the lysosome: a control centre for cellular clearance and energy metabolism. Nat. Rev. Mol. Cell Biol.14, 283–296 (2013). - PMC - PubMed
    1. Saftig, P. & Puertollano, R. How lysosomes sense, integrate, and cope with stress. Trends Biochem. Sci.46, 97–112 (2021). - PMC - PubMed
    1. Zoncu, R. & Perera, R. M. Built to last: lysosome remodeling and repair in health and disease. Trends Cell Biol.32, 597–610 (2022). - PMC - PubMed
    1. Saftig, P. & Klumperman, J. Lysosome biogenesis and lysosomal membrane proteins: trafficking meets function. Nat. Rev. Mol. Cell Biol.10, 623–635 (2009). - PubMed
    1. Allemailem, K. S. et al. Novel approaches of dysregulating lysosome functions in cancer cells by specific drugs and its nanoformulations: a smart approach of modern therapeutics. Int. J. Nanomed.16, 5065–5098 (2021). - PMC - PubMed

MeSH terms

LinkOut - more resources