. 2025 Jan 28;16(1):1120.
doi: 10.1038/s41467-025-56185-2.

Neural circuits underlying context-dependent competition between defensive actions in Drosophila larvae

Affiliations

Neural circuits underlying context-dependent competition between defensive actions in Drosophila larvae

Maxime Lehman et al. Nat Commun. .

Abstract

To ensure their survival, animals must be able to respond adaptively to threats within their environment. However, the precise neural circuit mechanisms that underlie flexible defensive behaviors remain poorly understood. Using neuronal manipulations, machine learning-based behavioral detection, electron microscopy (EM) connectomics and calcium imaging in Drosophila larvae, we map second-order interneurons that are differentially involved in the competition between defensive actions in response to competing aversive cues. We find that mechanosensory stimulation inhibits escape behaviors in favor of startle behaviors by influencing the activity of escape-promoting second-order interneurons. Stronger activation of those neurons inhibits startle-like behaviors. This suggests that competition between startle and escape behaviors occurs at the level of second-order interneurons. Finally, we identify a pair of descending neurons that promote startle behaviors and could modulate the escape sequence. Taken together, these results characterize the pathways involved in startle and escape competition, which is modulated by the sensory context.


Conflict of interest statement

Competing interests: The authors declare no competing interests.

Figures
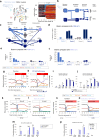
Fig. 1
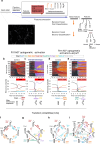
Fig. 1. Second order interneurons in a mechanosensory network are differentially involved in responses to air-puff.
a Left: Transition probabilities in response to air puff (from Masson et al., 2020). Right: Ethogram. One line represents one individual, colors represent actions as in the schematic. To ease reading, larvae were grouped by their first behavioral response. attP2>TNT (n = 818). Some larvae were not tracked before the onset of stimulation (white space) (b) Simplified schematic of the previously characterized circuitry underlying Hunch/Bend (Jovanic et al., 2016). Ch: chordotonal neurons, Md IV: multidendritic class IV neurons, B1,B2,4: Basin-1, Basin-2 and Basin-4 (c). Synaptic connectivity based on EM reconstruction, between neurons in (b)., and A08m,x and A19c. Fraction of total input is shown. Light blue: all neurons previously identified as required for Hunch, dark blue: all neurons previously identified as inhibiting Hunch. B3 is in gray. Neurons in neuromere a1 are shown. d Input A19c receives from Basins across neuromeres a1-4, (e, f) Input A08m and A08x receive from Basins across neuromeres a1-4, Fractions of all input is shown (in a1). g–j Responses to light then air puff (3 s after light). g control (attP2>CsChrimson, n = 177) (h) larvae with activated R11A07 neurons (R11A07 > -CsChrimson, n = 250). i behavioral probability cumulated over the first three seconds after light onset: control (white) and R11A07 > -CsChrimson larvae (dark blue) (j). Same as (i) but over the first second after air puff onset, k–m Responses to 4 m/s air puff (k) control (eELGAL4>CantonS n = 254) (l). larvae with eELs interneurons inactivated (eEL-Gal4>TNT, n = 420). m behavioral probability cumulated over the first five seconds after air puff onset, control (white) and eEL-Gal4>TNT (lavender) (np) Responses to 4 m/s air puff and optogenetic activation (0.3 mW/cm² irradiance). n control (eEL-Gal4>CsChrimson, without ATR n = 248), (o). eEL-Gal4>CsChrimson, with ATR n = 286 (p) behavioral probability cumulated over first five seconds after air puff onset, eEL-Gal4>CsChrimson, without ATR (white) and with ATR (lavender). g,h k, l, n,o mean behavioral probability over time, Stim at 60 s. For all barplots: *: p < 0.05, **: p < 0.005, ***: p < 0.0005,****: p < 0.0001, Chi² test, two sided. The source data and p values are provided in Source Data 1, 2 and 5.
Fig. 2
Fig. 2. An Automated classification of Bend-like behaviors reveals stereotyped escape sequences triggered by optogenetic activation of R11A07 neurons.
a Reclassification procedure of larval behaviors automatically detected by a Machine Learning-based algorithm. Actions previously categorized as “Bend” were reclassified to be categorized as either “Head Cast”,”Static Bend” or “C-shape”, and actions previously categorized as “Hunch”(head-retraction) were reclassified to be categorized as either “Hunch”, “Head-and-Tail” or “C-shape”. be Larval responses to R11A07 optogenetic activation (b) only light (control: attP2>CsChrimson, n = 530) (c). only light (optogenetic activation, R11A07>CsChrimson, n = 305). Upon optogenetic activation of R11A07 alone, most larvae perform a C-shape (63% out of larvae crawling). 27% of larvae that were crawling perform a Head-and-Tail contraction followed by a C-shape C-shapes are in 70% of cases followed by a Roll. d. air puff and light (control: attP2>CsChrimson ATR, n = 765) (e). air puff and light (optogenetic activation, R11A07> CsCrimsonn=214). Ethograms and mean behavioral probability over time are shown. Ethograms show actions over time, with one line corresponding to one individual and each color corresponding to a different action (as indicated). All larvae present between 59.8 and 61 seconds (for at least one time step) are displayed. For each condition a schematic of the characteristic behavioral sequence is depicted (f–i). transition probabilities cumulated over the first three seconds after stim onset (f). Control, light alone. g R11A07c>CsCrimson, light alone. (h) Control, air puff and light (i). R11A07>CsChrimson, air puff and light. When optogenetic activation is combined with air puff, the larvae performed relatively more Head-and-Tails (30%) and less C-shapes and Rolls, compared to when optogenetic activation was applied alone. Fewer larvae (45% compared to 67% upon optogenetic activation alone) perform C-shapes. In most cases (69%) Head-and-Tails were followed by a C-shape. C-shapes are less frequently followed by a Roll in presence of air puff (30%) than when the light was delivered alone (70%). Only transition probabilities of 3% or more are shown. Stim onset at 0 s. air puff intensity: 4 m/s. Irradiance: 0.3 mW/cm². Source data are provided in Source Data 3.
Fig. 3
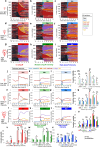
Fig. 3. Sensory context modulates escape responses triggered by R11A07>CsCrimson optogenetic activation.
ai Ethograms including all detected actions. j–x behavioral probabilities for Hunch, Head-and-Tail, C-shape and Roll in response to: j–m. low light intensity (0.1 mW/cm²) with (j). no air puff (n = 199). k 3 m/s air puff (n = 206). l 4 m/s air puff (n = 269). nq medium light intensity (0.2 mW/cm²) with (n). no air puff (n = 183) (o). 3 m/s air puff (n = 175). p 4 m/s air puff (n = 129). r–u high light intensity (0.3 mW/cm² irradiance) and with (r). no air puff (n = 305) (This data is the same as the one in Fig. 2c, but is used here to compare optogenetic activation alone with combined optogenetic activation and air puff condition). r 3 m/s air puff (n = 265). t 4 m/s air puff (n = 214) Rolling is inhibited by both medium and strong air puff at low and medium light intensities, while at high light intensity is inhibited by only strong air puff. m, q, u, v, w, x Barplots correspond to the behavioral probability cumulated over the first five seconds after stim onset. For all barplots: FDR: *:p < 0.05, **:p < 0.01, ***:p < 0.005 Chi² test, two sided, with Benjamini-Hochberg correction. The source data and p values are provided in Source Data 5.
Fig. 4
Fig. 4. The R11A07 neurons are required for mechano-nociception.
a Silencing R11A07 neurons using KIR results in less C-shape and rolling behavior in response to a mechano-nocipetive stimulus compared to the controls (p = 0.0002, p = 0.0049), n = 63 (UAS KIR/ + ), 60 (R11A07/ + ), 60 (R11A07/KIR) animals (b) Silencing R11A07 didn’t affect latency of responses to a thermo-nociceptive stimulus, n = 70 (UAS KIR/ + ), 99 (R11A07/ + ), 90 (R11A07/KIR) animals. Chi-square test, two-sided, was used to compare behavioral probabilities in (a). **:<0.01, ***: <0.001, Kruskal-Wallis test two-sided was used to compare latencies in (b). c Simplified diagram of the circuit model.
Fig. 5
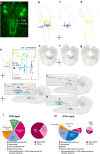
Fig. 5. Morphological characterisation of TDN and A19c neurons.
a R11A07 expression pattern (GFP). thoracic neuron in the segment T3, and four abdominal neurons in segments a1-4. Elsewhere in the CNS, expressing GFP in this line, are bundles of cell bodies likely corresponding to immature neurons. The expression patterns are consistent across all 11 larval brains that were imaged. Scale bar is 15 µm (b,c). Reconstructed A19c neuron in abdominal segment 1 (a1) (A19c, a1,left, right), in blue. b,d TDN, (t3, left,right) in yellow, antero-posterior view. eg Reconstructed A19c (blue) and TDN (yellow) dorso-ventral view. h distribution of inputs (cyan) and outputs (red) in TDN_t3l and A19c_a1l, in an antero-posterior view. ik same as in (h), viewed through a dorso-ventral angle. j shows the distribution of inputs for TDN (k) shows the distribution of inputs A19c (l). distribution of all input received by TDN (t3l,t3r) (m) distribution of all input received by A19c (a1l,a1r). In white are all inputs from neurons not reconstructed up to recognition, i.e. fragments. We considered all neuron skeletons with fewer than 1500 neurons to be unreconstructed, except for sensory neurons (in green). The source data are provided in Source Data 1.
Fig. 6
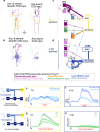
Fig. 6. TDN and A19c neurons receive distinct inputs.
a–d Main presynaptic partners (with 3 or more synapses) of TDN, A19c. Fragments were not included. a reconstructed skeletons in EM volume of TDN and its presynaptic partners (b). reconstructed skeletons in EM volume of A19c and its presynaptic partners. Presynaptic partners were coloured based on their localisation (brain, subesophageal zone (SEZ), sensory (cho), local, ascending neurons (c, d). Connectivity between neurons in (a, b). a–d axo- and dendro-dendritic synapses and axo-axonic synapses are shown All connections of 3 or more synapses are shown. Reconstructions were done in Catmaid software. e, f Live calcium imaging, using GCaMP6s, of TDN and A19c responses to optogenetic activation of Basin-2. e TDN response (n = 2 animals) (f). A19c response (n = 3 animals). g, h Live calcium imaging, using GCaMP6s, of A19c and TDN response to mechanical stimulation (piezoelectric-delivered vibrations) known to recruit chordotonal mechanosensory neurons (g). TDN response (n = 10 animals) (h). A19c response (n = 8 animals). Light and mechanical stimulations lasted 5 s. Mean and s.e.m are shown. The source data are provided in Source Data 1.
Fig. 7
Fig. 7. A19c is sufficient to induce Rolling.
a–c Example of expression profile of CNS for larvae that (a). Hunched (n = 5), (b). Rolled (n = 3) or (c). Performed a C-shape (n = 5) (d). behavioral probabilities of larval responses to optogenetic activation. The source data are provided in Source Data 1 (e). Schematic showing that TDN promotes Hunching while A19c promotes escape behaviors. The genotype used were:(y,w;{nSyb-phiC31} attp5;R11A07-Gal4::UAS-SPARC2-I-CsChrimsontdtomato} CR-P40 and y,w;{nSyb-phiC31}attp5;R11A07-Gal4::UAS-SPARC2-S-CsChrimsontdtomato}CR-P40, n = 25 animals). f, g Live calcium imaging of A19c and TDN neurons upon their optogenetic activation and simultaneous presentation of mechanical stimulation (f). TDN responses (n = 8 animals) (g). A19c responses (n = 8 animals). Light and mechanical stimulations lasted 5 s. Mean and s.e.m are shown.
Fig. 8
Fig. 8. Effect of Inactivating neurons in the R11A07 line on the behaviors triggered by optogenetic activation of Basins.
a–d Hunch responses. a Hunching probability over time, in response to air puff and optogenetic activation of Basin-2 (L38H09>CsChrimson, dark blue, dotted n = 433), and with R11A07 inactivated (L38H09>CsChrimson, R11A07 > TNT, red, dotted, n = 254). No All-Trans-Retinal (ATR) controls: L38H09>CsChrimson, light blue, dotted, n = 395 and L38H09>CsChrimson, R11A07 > TNT, light red, dotted, n = 166. b Hunching probability cumulated over the first 5 seconds after stim onset. Color code as in (a). c Hunching probability over time, in response to air puff and optogenetic activation of all Basins (L72F11>CsChrimson, dark blue, n = 583), with R11A07 inactivated (L72F11>CsChrimson, R11A07 > TNT, red, n = 255). No All-Trans-Retinal (ATR) controls: L72F11>CsChrimson, light blue, n = 147 and L72F11>CsChrimson, R11A07 > TNT, light red, n = 190. d Hunching probability cumulated over the first 5 seconds after stim onset. Color code as in (c). e–h Static Bend response. Color code and animal numbers as in (a–d). e Static Bend probability over time, in response to air puff and optogenetic activation of Basin-2, with and without R11A07 inactivation. f Static Bend probability cumulated over the first 5 seconds after stim onset g. Static bend probability over time, in response to air puff and optogenetic activation of all Basins (L72F11) with or without inactivation of R11A07 neurons (h). Static Bend probability cumulated over the first 5 seconds after stim onset (i–k). Rolling probability in response to air puff and optogenetic activation of Basins, with and without inactivating R11A07, color code and animal numbers as in (a–d). i Rolling probability over time (j). Rolling probability cumulated over the first 5 seconds after stim onset. k Rolling probability cumulated over [10-30 s] within stim. l–n C-shape probability in response to air puff and optogenetic activation of Basins, with and without inactivating R11A07. Color code and animal numbers as in (a–d). l C-shape probability over time (m). C-shape probability cumulated over the first 5 seconds after stim. onset. n C-shape probability cumulated over [10–30 s] within stim. For all barplots: *: p < 0.05, **: p < 0.005, ***: p < 0.0005, ****: p < 0.0001, Chi² test, two-sided. The p-values are provided in Source data 5.
Fig. 9
Fig. 9. TDN and A19c neurons connect to the motor side through distinct pathways.
a Schematic summarizing TDN and A19c connectivity, and their respective synaptic distance to specific motor neurons. This schematic is a simplified representation of the connectivity shown in Supplementary Fig. 13. Postsynaptic partners of TDN were grouped based on whether they were direct (yellow) or indirect (orange) targets of TDN. Similarly, A19c direct (blue) and indirect (purple) targets were regrouped. TDN and A19c contact, directly and indirectly, 22 motor neurons (MNs) located in segment A1. Note that, just as in Supplementary Fig. 13, the motor neurons from other segments were not taken into account. The 22 A1 MNs contacted by TDN and/or A19c were placed into 8 groups (red), depending on their synaptic distance to TDN and A19c. Importantly, among these 22 MNs are MNs targeting muscles identified as recruited during Rolling events, in two recent studies,. These “Rolling MNs” are coloured and highlighted accordingly. In gray are MNs controlling muscles found not to be activated during Rolling by either study, as well as MNs innervating broad sets of muscles (RP2, RP5 and VUM2 MNs). b Simplified diagram of the circuit model. The source data are provided in Source Data 6.

References

    1. Ache, J. M., Namiki, S., Lee, A., Branson, K. & Card, G. M. State-dependent decoupling of sensory and motor circuits underlies behavioral flexibility in Drosophila. Nat. Neurosci.22, 1132–1139 (2019). - PMC - PubMed
    1. Dombrovski, M. et al. Synaptic gradients transform object location to action. Nature613, 534–542 (2023). - PMC - PubMed
    1. Koyama, M. et al. A circuit motif in the zebrafish hindbrain for a two alternative behavioral choice to turn left or right. eLife5, 451 (2016). - PMC - PubMed
    1. von Reyn, C. R. et al. A spike-timing mechanism for action selection. Nat. Neurosci.17, 962–970 (2014). - PubMed
    1. Evans, D. A., Stempel, A. V., Vale, R. & Branco, T. Cognitive Control of Escape Behaviour. Trends Cogn. Sci.23, 334–348 (2019). - PMC - PubMed

LinkOut - more resources