. 2025 Mar;35(3):165-185.
doi: 10.1038/s41422-025-01078-8. Epub 2025 Jan 29.

Raptin, a sleep-induced hypothalamic hormone, suppresses appetite and obesity

Affiliations

Raptin, a sleep-induced hypothalamic hormone, suppresses appetite and obesity

Ling-Qi Xie et al. Cell Res. 2025 Mar.

Erratum in

Abstract

Sleep deficiency is associated with obesity, but the mechanisms underlying this connection remain unclear. Here, we identify a sleep-inducible hypothalamic protein hormone in humans and mice that suppresses obesity. This hormone is cleaved from reticulocalbin-2 (RCN2), and we name it Raptin. Raptin release is timed by the circuit from vasopressin-expressing neurons in the suprachiasmatic nucleus to RCN2-positive neurons in the paraventricular nucleus. Raptin levels peak during sleep, which is blunted by sleep deficiency. Raptin binds to glutamate metabotropic receptor 3 (GRM3) in neurons of the hypothalamus and stomach to inhibit appetite and gastric emptying, respectively. Raptin-GRM3 signaling mediates anorexigenic effects via PI3K-AKT signaling. Of note, we verify the connections between deficiencies in the sleeping state, impaired Raptin release, and obesity in patients with sleep deficiency. Moreover, humans carrying an RCN2 nonsense variant present with night eating syndrome and obesity. These data define a unique hormone that suppresses food intake and prevents obesity.


Conflict of interest statement

Competing interests: The authors declare no competing interests.

Figures

Fig. 1
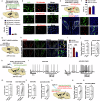
Fig. 1. Raptin is a sleep-induced hypothalamic hormone in mice and humans.
a Volcano plots of dysregulated factors ( ≥ 1.5-fold change) identified in the hypothalamus from sleep fragmentation mice (SF) compared to age-matched controls through proteomics and MS analysis (n = 3 per group). The red circle indicates Rcn2. b UMAP plot showing the clustering of cell types in the hypothalamus by analyzing multiple public scRNA-seq data from the GSE87544, GSE119960, GSE132355, GSE132730 and GSE148568 datasets. c Dot plots displaying Rcn2 expression in different cell types of mouse hypothalamus from scRNA-seq data. d Representative image of RCN2 (green) expression in the neurons (NeuN, violet, yellow arrows indicate the colocalization), microglia (IBA1, orange, white arrows) and astrocytes (GFAP, red, white arrows) of mouse brain slices. Scale bars, 50 μm. ef Representative images (e) and quantification of RCN2 (green, f) expression in the PVN of mice at different time points (ZT0, ZT6, ZT12, ZT18). Scale bar, 50 μm (n = 5 per group). g Representative western blot of RCN2 expression in cell lysates and the concentrated culture medium of hypothalamic GT1-7 neurons transfected with the Flag-Rcn2 plasmid. The red triangle indicates Raptin (MW: 35–55 kD), and blue triangle indicates full-length RCN2 (MW: ~55 kD). h Schematic diagram illustrating the cleavage of RCN2 into Raptin. Raptin is spanning from 28 to 249 amino acids of full-length RCN2. i Plasma Raptin levels of 3-month male mice monitored at ZT0, ZT6, ZT12 and ZT18 (the purple area indicates the sleep phase: ZT0–ZT12). j Representative images of RCN2 (green) and NeuN (red) expression in the human hypothalamus section. Scale bar, 200 μm. k Plasma Raptin levels of humans monitored at ZT0, ZT6, ZT12 and ZT18 (purple area indicates sleep phase). Data are shown as the mean ± SEM. *P < 0.05, **P < 0.01, ***P < 0.001 by one-way ANOVA (fik). See also Supplementary information, Figs. S1, S2.
Fig. 2
Fig. 2. The circadian rhythm of Raptin release is controlled by SCNAVP neurons.
a Schematic diagram of the retrograde tracing system in SCN-innervating PVNRCN2. AAV-Rcn2-Cre-EGFP, AAV-DIO-H2B-T2A-TVA and AAV-DIO-RVG were mixed and then bilaterally injected into PVN. Three weeks later, rabies virus (RV)-EnvA-tdTomato (red) were bilaterally injected into PVN. bc Representative images (b) and quantification (c) of colocalization with RV-tdTomato (red) by immunofluorescence staining of AVP+ neurons (top line, green), VIP+ neurons (middle line, green) and GRP+ neurons (bottom line, green) in SCN. Scale bars, 50 μm (n = 3 per group). d Schematic diagram of the anterograde tracing system in SCN-innervating PVN. The WT mice were bilaterally injected with scAAV2/1-hSyn-Cre into SCN and AAV-DIO-mCherry into PVN. ef Representative images (e) and quantification (f) of colocalization with mCherry (red) by fluorescence ISH of Rcn2 mRNA (green) in PVN neurons. Scale bar, 50 μm (n = 3). g Schematic diagram of chemogenetic inhibition of SCNAVP neuron of Avp-Cre mice. AAV-DIO or AAV-DIO-hM4Di was injected into SCN of Avp-Cre mice. Mice were intraperitoneally injected with CNO at a dose of 2 mg/kg body weight. hi Representative images (h) and quantification (i) of co-staining of c-Fos (red) and RCN2 (green) in PVN after CNO injection for 60 min to induce SCNAVP neuron inhibition in Avp-Cre mice. Scale bar, 50 μm (n = 4 per group). j Plasma Raptin levels of mice injected with AAV-DIO or AAV-DIO-hM4Di before and after intraperitoneal injection of CNO for 1 h (n = 4 per group). k Schematic diagram illustrating the optogenetic activation of SCNAVP neuron terminal in PVN, followed by the detection of PVNRCN2 neuron activity. AAV-DIO or AAV-DIO.ChR2 was bilaterally injected into SCN, whereas AAV-Rcn2-Cre-EGFP was injected into the PVN of Avp-Cre mice. The fiber was implanted into the PVN to stimulate SCNAVP neuronal terminal. lm Representative traces (l) and action potential frequency (m) of PVNRCN2 neurons in brain slice before and during optogenetic activation of SCNAVP neurons (n = 3 ~ 4 per group). n The plasma Raptin levels before and after optogenetic activation of SCNAVP neurons in vivo (n = 3 ~ 4 per group). o Schematic diagram illustrating the experimental workflow for SCNAVP neuron activation and PVNRCN2 neuron inhibition. AAV-DIO-mCherry or AAV-DIO-hM4Di-mCherry with AAV-Rcn2-Cre-EGFP were injected into PVN for chemogenetic manipulation of PVNRCN2 neuron. CNO was intraperitoneally injected into mice at a dose of 2 mg/kg body weight. AAV-fDIO.ChR2 with AAV-Avp-Flp were injected into SCN for optogenetic activation of SCNAVP neurons. The fiber was implanted into the PVN to stimulate SCNAVP neuronal terminal in PVN. p, q The plasma Raptin levels in mice injected with AAV-DIO (p) or AAV-DIO-hM4Di (q) before and after CNO treatment (n = 4 per group). Data are shown as the mean ± SEM. *P < 0.05, **P < 0.01 by a two-tailed paired Student’s t-test (jmnpq) or by a two-tailed unpaired Student’s t-test (i). See also Supplementary information, Figs. S3, S4.
Fig. 3
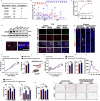
Fig. 3. Hypothalamus-derived Raptin suppresses food intake and protects against obesity.
a Schematic diagram of Rcn2 overexpression in PVN of mice with SF intervention. AAV-hSyn-Ctrl or AAV-hSyn-Rcn2 was bilaterally injected into the PVN of WT male mice, followed by SF intervention for 9 weeks. b The plasma Raptin levels of 4-month male control or SF mice injected with AAV-hSyn-Rcn2 or AAV-hSyn-Ctrl (n = 5 per group). cd Body weight (c) and cumulative food intake (d) of 4-month male control mice, SF mice and SF mice with Rcn2 overexpression. ###P < 0.001 when control mice were compared to SF mice. ***P < 0.001 when SF mice were compared to SF mice with Rcn2 overexpression (n = 5 per group). e Schematic diagram illustrating the 4-week ICV infusion of Raptin (40 ng/h/g body weight) or PBS in 4-month SF male mice. fg Body weight change (f) and cumulative food intake (g) of 4-month SF male mice with ICV infusion of Raptin or PBS for 4 weeks (n = 4 per group). hi Body weight (h) and cumulative food intake (i) of 2-month Rcn2flox/flox and Sim1Cre;Rcn2flox/flox male mice fed an HFD for 9 weeks (n = 6 per group). j Schematic diagram of 2-month Sim1Cre;Rcn2flox/flox mice or Rcn2flox/flox male mice with 8-week HFD and 4-week ICV infusion of Raptin (40 ng/h/g body weight) or PBS. kl Body weight (k) and cumulative food intake (l) of Rcn2flox/flox and Sim1Cre;Rcn2flox/flox male mice with ICV infusion of PBS or Raptin (n = 6 per group). ***P < 0.001 when Rcn2flox/flox mice were compared to Sim1Cre;Rcn2flox/flox mice. ###P < 0.001 when Sim1Cre;Rcn2flox/flox mice were compared to SimCre;Rcn2flox/flox mice treated with Raptin. m Representative H&E staining of eWAT and iWAT of 4-month control mice or SimCre;Rcn2flox/flox male mice with ICV infusion of PBS or Raptin. Scale bar, 100 μm (n = 6 per group). Data are shown as the mean ± SEM. *P < 0.05, **P < 0.01, ***/###P < 0.001 by two-way ANOVA (bdfikl). See also Supplementary information, Figs. S5–S7.
Fig. 4
Fig. 4. Raptin binds to GRM3 in neurons of the PVN and stomach to suppress food intake.
a List of candidate membrane receptors of Raptin through MS analysis. The cell lysate of hypothalamic neurons was incubated with His-Raptin. The proteins pulled down by anti-His antibody were tested by MS analysis. b Representative mass spectrogram of GRM3 (The identified sequence of GRM3 peptide fragment: VGHWAETLYLDVDSIHWSR). c Effect of Raptin on GRM3 binding in HEK293T cells transfected either with control plasmid or Grm3 plasmid. d Representative western blot of GRM3 expression in different tissues. e Representative images of GRM3 expression (red) in the PVN and muscular layer of the stomach. Scale bars, 50 μm. f Binding assay on frozen tissue sections of PVN from Grm3flox/flox or Sim1Cre;Grm3flox/flox mice. His-Raptin or PBS was pre-incubated with frozen tissue slices. Scale bar, 50 μm. g Binding assay on frozen tissue sections of the stomach from Grm3flox/flox mice intragastrically injected with AAV-Ctrl or AAV-Nos1-Cre. His-Raptin or PBS was pre-incubated with frozen tissue slices. Scale bar, 50 μm. hi Body weight (h) and 24-h food intake (i) of 4-month control (Grm3flo/flox mice) and PVN-specific Grm3-deficient male mice (Sim1Cre;Grm3flox/flox mice) with 10-week HFD (n = 5 per group). j Schematic diagram illustrating the injection of AAV-Nos1-Cre into the muscle layer of the stomach of 2-month Grm3flox/flox male mice to generate stomach-specific Grm3-deficient mice. Control male mice are Grm3flox/flox mice. kl Body weight (k) and food intake (l) of 4-month control or stomach-specific Grm3-deficient male mice (n = 5 per group). m Gastric emptying of 4-month control or stomach-specific Grm3-deficient male mice measured via phenol red test (n = 5 per group). n Gastric emptying of 4-month control or stomach-specific Grm3-deficient male mice measured via acetaminophen absorption test (n = 5 per group). oq Body weight (o), food intake (p) and gastric emptying (q) of 4-month controls (Grm3flox/flox mice) and dual tissue-specific Grm3-deficient male mice (Sim1Cre;Grm3flox/flox mice with injection of AAV-Nos1-Cre into stomach) with or without treatment of Raptin. Mice were fed an HFD. Raptin was injected into mice via the tail vein at a dose of 1 mg/kg body weight every other day for 8 weeks (n = 5 per group). r H&E staining of the eWAT and iWAT of the control and dual tissue-specific Grm3-deficient male mice treated with PBS or Raptin. Scale bar, 100 μm (n = 5 per group). Data are shown as the mean ± SEM. *P < 0.05, **P < 0.01, ***P < 0.001 by two-way ANOVA (hknoq) or by a two-tailed unpaired Student’s t-test (ilm). See also Supplementary information, Figs. S8, S9.
Fig. 5
Fig. 5. Raptin-GRM3 signaling maintains the energy supply for neuron activation and anorexigenic effects.
a Schematic diagram illustrating the injection of AAV-Grm3-Flp-EGFP into PVN of control and PVN-specific Grm3-deficient male mice to label PVNGRM3 neurons, followed by neuronal activity recording of PVNGRM3 neurons in brain slice before and during Raptin treatment. Raptin was dissolved in ACSF at a concentration of 1 ng/mL and incubated with brain slices for 10 min. bc Representative traces (b) and action potential frequency (c) of PVNGRM3 neurons from control and PVN-specific Grm3-deficient male mice (n = 5 per group). d Representative images of c-Fos (green) in the GRM3+ neurons of the stomach from control and stomach-specific Grm3-deficient male mice followed by administration of Raptin via tail vein at a dose of 1 mg/kg body weight for 1 h. Scale bar, 50 μm. e Representative images of labeled mitochondria (cyan) and KHC (red) in primary hypothalamus neurons transfected with control or Grm3 siRNA, followed by treatment of Raptin or PBS. These neurons were transfected with Mito-BFP and Khc-RFP plasmids to label mitochondria and KHC protein, respectively. Scale bar, 5 μm. f Quantification of the fluorescent KHC present on mitochondria, defined by the intensity of KHC in the region overlapping Mito-BFP (n = 4 per group). g KEGG analysis of changed phosphorylation in the hypothalamic GT1-7 neurons through global quantitative phosphoproteomic analysis. Hypothalamic GT1-7 neurons were treated with PBS or Raptin at 10 ng/mL for 1 h. h Representative western blot of AKT signaling in cell lysates and KHC expression in mitochondria enriched from primary neurons treated with Raptin or Grm3 siRNA. Raptin was used at 10 ng/mL for 1 h. CYTO1 was used as the internal control of mitochondria. i Representative western blot of AKT signaling in cell lysates and KHC expression in mitochondria enriched from primary neurons treated with Raptin or PI3K-AKT pathway inhibitors (Wortmannin and LY294002). CYTO1 was used as the internal control of mitochondria. jk Representative images (j) and quantification (k) of the fluorescent KHC (red) present on mitochondria, defined by the intensity of KHC in the region overlapping Mito-BFP (cyan) in primary hypothalamus neurons. Scale bar, 5 μm (n = 4 per group). lm Schematic diagram illustrating the injection of AAV-hSyn-Ctrl or AAV-hSyn-shKhc in the PVN of 2-month WT male mice to generate the control and PVN-specific Khc knockdown mice, followed by treatment of PBS or Raptin. Representative immunofluorescence images (l) and quantification (m) of c-Fos (red) expression in PVN. Scale bar, 50 μm. n 24-h food intake of the PVN-specific Khc knockdown mice and control mice with or without treatment of Raptin (n = 4 per group). Data are shown as the mean ± SEM. *P < 0.05, **P < 0.01, ***/###P < 0.001 by a two-tailed paired Student’s t-test (c) or by two-way ANOVA (fkmn). See also Supplementary information, Figs. S10–S12.
Fig. 6
Fig. 6. Raptin is involved in sleep deficiency-induced obesity in humans.
a Schematic diagram of the cross-sectional study evaluating the effect of sleep on obesity. bc Violin plot of sleep efficiency (b) and plasma Raptin levels (c) in participants with or without obesity (n = 127 for obese group, n = 135 for non-obese group). d Spearman’s correlation between SE and BMI in participants with obesity (n = 127 for obese group). e Spearman’s correlation between SE and Raptin levels in participants with obesity (n = 127 for obese group). f Spearman’s correlation between Raptin levels and BMI in participants with obesity (n = 127 for obese group). g Schematic diagram illustrating the workflow of a prospective study evaluating the effect of SRT on obesity (n = 15 per group). hk Change of SE (h), body weight (i), cumulative energy intake (j) and plasma Raptin level (k) between control and SRT groups. l Spearman’s correlation between SE change and plasma Raptin level change in participants with obesity. The triangle represents the control group, and the circle represents the SRT group. mn Spearman’s correlation between plasma Raptin level change and changes of body weight (m) and energy intake (n) in participants with obesity. The triangle represents the control group, and the circle represents the SRT group. Data are shown as the mean ± SEM or β estimate ± 95% CI. **P < 0.01, ***P < 0.001 by Mann–Whitney U test (bc), Spearman’s correlation analysis (dfln) or a two-tailed paired Student’s t-test (hk). The P values of Spearman correlation analysis were corrected by Bonferroni method. See also Supplementary information, Fig. S13.
Fig. 7
Fig. 7. An RCN2 nonsense mutation contributes to NES.
a Pedigree of the family with NES. The red arrow indicates the proband in this family. WT RCN2 genotypes are depicted as +/+, and heterozygous RCN2 genotypes are depicted as +/–. Numbers in red brackets indicate the BMIs of three affected obese patients. b Sanger sequencing chromatograms from II2, II3, III2 and one representative family member (II5). The c.469 C > T transition is indicated by the red arrow. c Protein homology of the neighboring region of the variant among selected species. The arrow shows the location of the p.Arg157Ter substitution. The red amino acid residue indicates the altered residue by the above variant found in this family. df Plasma Raptin levels of NES patients (II2, d; II3, e; III2, f) and their respective obese control (age-, sex- and BMI-matched, n = 6) during night phase. gh The cumulative energy intake curves (g) and quantification (h) of II2 and his obese control (age-, sex- and BMI-matched, n = 6) during day and night phases. ij The cumulative energy intake curves (i) and quantification (j) of II3 and her obese control (age-, sex- and BMI-matched, n = 6) during day and night phases. kl The cumulative energy intake curves (k) and quantification (l) of III2 and his obese control (age-, sex- and BMI-matched, n = 6) during day and night phases. Data are shown as the mean ± SEM. See also Supplementary information, Fig. S13.

References

    1. Besedovsky, L., Lange, T. & Haack, M. The sleep-immune crosstalk in health and disease. Physiol. Rev.99, 1325–1380 (2019). - PMC - PubMed
    1. Chaput, J. P. et al. The role of insufficient sleep and circadian misalignment in obesity. Nat. Rev. Endocrinol.19, 82–97 (2023). - PMC - PubMed
    1. Nguyen, A. D., Costa, P. C. & Raizen, D. M. A perfect storm: sleep loss causes systemic inflammation and death. Cell Res.34, 341–342 (2024). - PMC - PubMed
    1. Covassin, N. et al. Effects of experimental sleep restriction on energy intake, energy expenditure, and visceral obesity. J. Am. Coll. Cardiol.79, 1254–1265 (2022). - PMC - PubMed
    1. Markwald, R. R. et al. Impact of insufficient sleep on total daily energy expenditure, food intake, and weight gain. Proc. Natl. Acad. Sci. USA110, 5695–5700 (2013). - PMC - PubMed

LinkOut - more resources