. 2025 Mar;26(3):459-472.
doi: 10.1038/s41590-024-02072-9. Epub 2025 Jan 28.

Robust mucosal SARS-CoV-2-specific T cells effectively combat COVID-19 and establish polyfunctional resident memory in patient lungs

Affiliations

Robust mucosal SARS-CoV-2-specific T cells effectively combat COVID-19 and establish polyfunctional resident memory in patient lungs

Airu Zhu et al. Nat Immunol. 2025 Mar.

Abstract

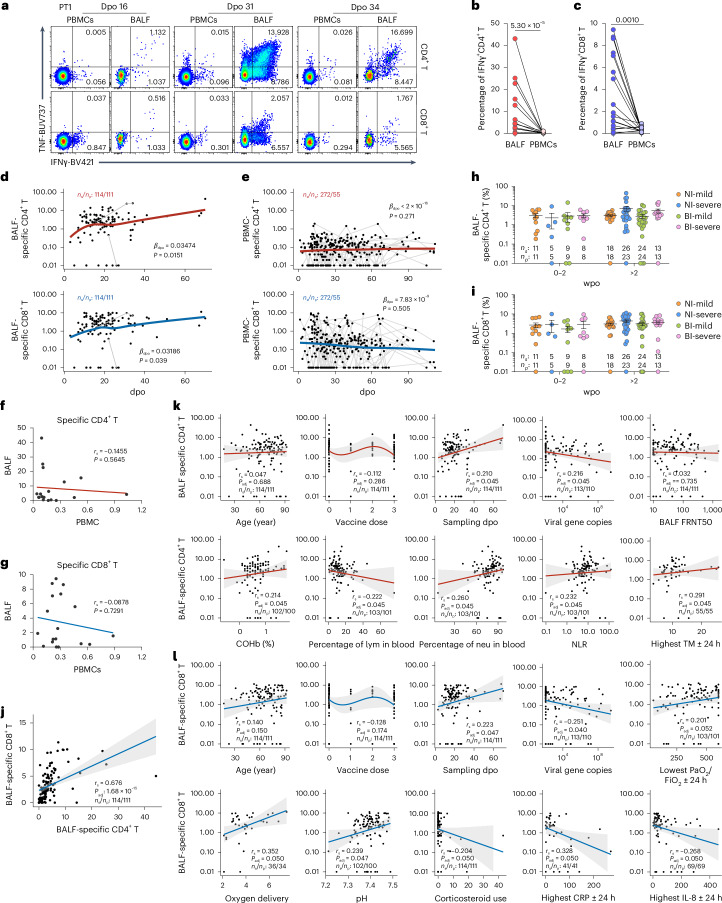
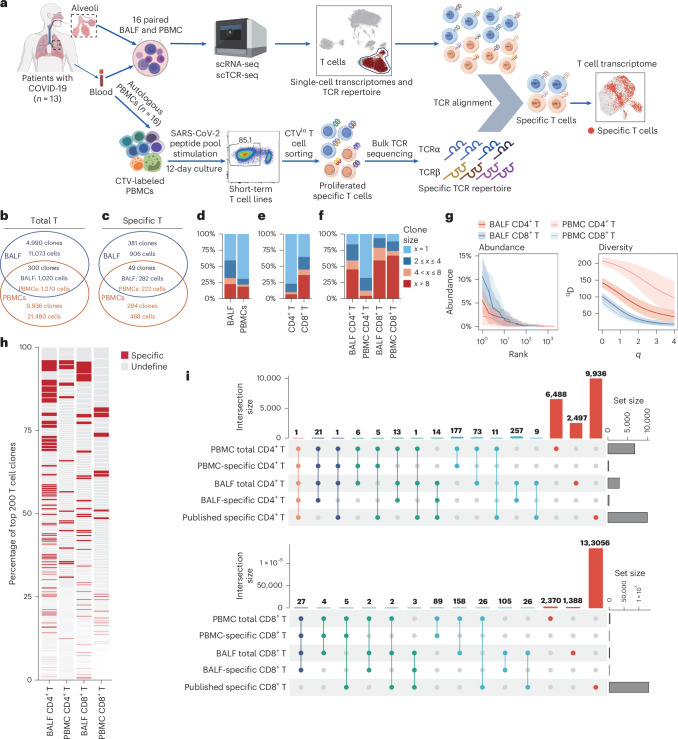
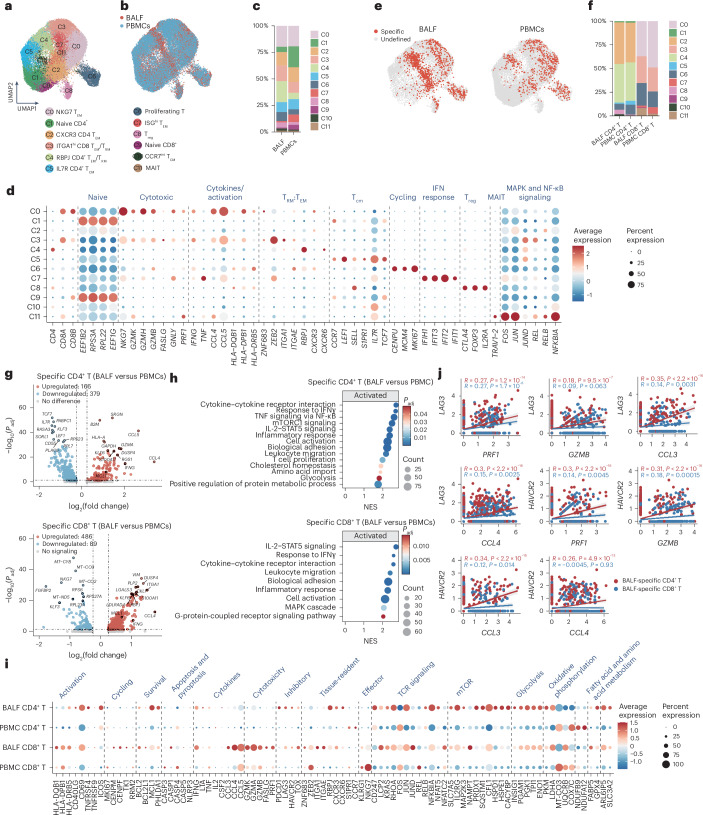
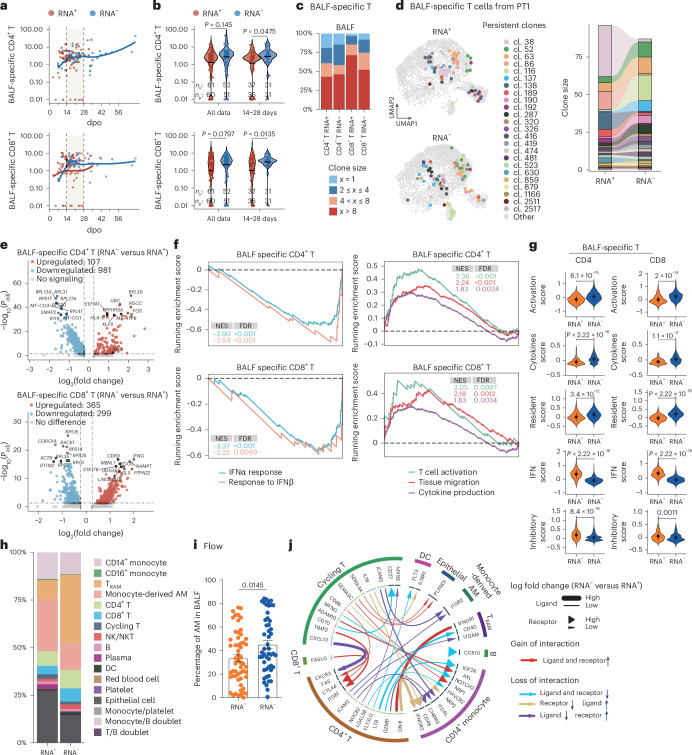
Mucosal antigen-specific T cells are pivotal for pathogen clearance and immune modulation in respiratory infections. Dysregulated T cell responses exacerbate coronavirus disease 2019 severity, marked by cytokine storms and respiratory failure. Despite extensive description in peripheral blood, the characteristics of severe acute respiratory syndrome coronavirus 2 (SARS-CoV-2)-specific T cells in the lungs remain elusive. Here we conducted integrated single-cell profiling of SARS-CoV-2-specific T cells in 122 bronchoalveolar lavage fluid (BALF) and 280 blood samples from 159 patients, including 27 paired BALF and blood samples from 24 patients. SARS-CoV-2-specific T cells were robustly elicited in BALF irrespective of prior vaccination, correlating with diminished viral loads, lessened systemic inflammation and improved respiratory function. SARS-CoV-2-specific T cells in BALF exhibited profound activation, along with proliferative and multi-cytokine-producing capabilities and a glycolysis-driven metabolic signature, which were distinct from those observed in peripheral blood mononuclear cells. After viral clearance, these specific T cells maintained a polyfunctional tissue-resident memory phenotype, highlighting their critical roles in infection control and long-term protection.


Conflict of interest statement

Competing interests: The authors declare no competing interests.

Figures

Fig. 1
Fig. 1. Study design and patient cohort.
a, Schematic overview of patient demographics, sample details, and omics assays used in this study. The x axis represents the days after disease onset, while the y axis lists the patient IDs (PT1–PT159). Patient IDs are prominently displayed in the central column. Comorbidities depicted include hypertension, diabetes, chronic pulmonary diseases, cancer, coronary artery disease, stroke, history of organ transplantation, and chronic renal disease. b, Summary of patients who provided BALF and PBMC samples in this study. For additional details, see Extended Data Table 1. Source data
Fig. 2
Fig. 2. Robust specific T cell responses in the BALF of patients with COVID-19.
a, Representative flow plotting of specific CD4+ and CD8+ T cells expressing IFNγ and TNF upon SARS-CoV-2 peptide stimulation in paired samples from human alveoli (BALF) and blood (PBMCs) collected over three sequential days post symptom onset from patient PT1. b,c, Summary plots comparing the frequencies of IFNγ+CD4+ (b) and IFNγ+CD8+ T (c) cells between 18 paired BALF and PBMC samples from 15 patients. Each dot represents an individual sample. Statistical significance was assessed using a two-tailed Wilcoxon matched-pairs signed-rank test. d,e, Kinetics of antigen-specific T cell responses in BALF (d) and PBMCs (e) after symptom onset. The number of patients and samples (ns/np) is indicated in the top left corner. Analysis was performed using a linear mixed model fit by restricted maximum likelihood (REML) (βdpo, fixed effects estimate), with t-tests based on Satterthwaite’s method. f,g, Two-tailed Spearman correlation analysis of specific CD4+ (f) and CD8+ (g) T cell responses between 18 paired BALF and PBMC samples from 15 patients. h,i, Comparison of specific CD4+ (h) and CD8+ (i) T cell responses in BALF between mild and severe patients with NI and BI. Data are shown as mean ± s.e.m. The number of samples (ns) and patients (np) is indicated in each panel. Statistical analysis was conducted using two-way analysis of variance. j, Two-tailed Spearman correlation analysis between specific CD4+ and CD8+ T cell responses in 114 BALF samples from 111 patients. The shaded area represents the 95% confidence interval (CI). k,l, Spearman correlation analysis of specific CD4+ (k) and CD8+ (l) T cells in BALF with the indicated clinical parameters. The number of samples and patients for each analysis is indicated (ns/np). Two-tailed multiple comparisons were corrected using the Benjamini–Hochberg method. Spearman correlation coefficients (rs) and adjusted P values (Padj) are shown. The shaded area represents the 95% CI. Clinical parameters include COHb, TM, lymphocyte count (lym), neutrophil count (neu), NLR, PaO2:FiO2 ratio and CRP. Source data
Fig. 3
Fig. 3. Activated and polyfunctional phenotypes of specific T cells in the BALF of patients with COVID-19.
a, Summary plots comparing the mean fluorescence intensity (MFI) of IFNγ and TNF in the IFNγ+CD4+ and IFNγ+CD8+ T cells between 18 paired BALF and PBMC samples from 15 patients. A two-tailed Wilcoxon matched-pairs signed-rank test was used. b, Multi-cytokine expression of specific T cells was assessed using flow cytometry after SARS-CoV-2 peptide stimulation. Each 10 × 10 dot plot represents the coexpression of multiple cytokines in a representative sample, with the dots indicating 1% of cells and the colors reflecting cytokine profiles (legend below). Cumulative cytokine patterns from 18 paired BALF and PBMC samples of 15 patients are shown as pie charts, color-coded using the number of cytokines expressed: gray (IFNγ), orange (two cytokines), green (three cytokines), pink (four cytokines) and purple (five cytokines). Analysis was performed using a mixed model fit by REML, with Šídák’s multiple comparisons test. c, Polyfunctional specific T cells, producing more than one cytokine, were analyzed for their correlation with the sampling time points (dpo). Two-tailed Spearman correlation results are shown, with sample and patient numbers indicated (ns/np). d,e, TriMap projections of specific (IFNγ+) T cells in BALF (n = 10) and PBMC (n = 11) (d), grouped into nine clusters based on FlowSOM clustering (e). The analysis included ten paired BALF and PBMC samples, plus an additional PBMC sample, from eight patients. Cluster characteristics are displayed alongside the map, and cluster distributions and proportions are shown below (e, see also Extended Data Fig. 2a). f, TriMap projection showing the distribution of the indicated proteins. g, Heatmap of z-scores calculated per marker, based on the MFI of protein expression on specific CD4+ and CD8+ T cells in BALF (n = 10) and PBMC (n = 11) samples. h, Memory phenotypes of specific T cells in BALF (n = 23) and PBMCs (n = 22) were summarized based on CD45RA and CCR7 expression: TN cells (CD45RA+CCR7+), TCM cells (CD45RACCR7+), TEM cells (CD45RACCR7) and TEM cells re-expressing CD45RA, CD45RA+CCR7 (TEMRA). Data are presented as the mean ± s.e.m. GM-CSF, granulocyte-macrophage colony-stimulating factor. max., maximum; min., minimum. Source data
Fig. 4
Fig. 4. Clonality and diversity of the specific T cell repertoire in BALF and PBMCs.
a, Experimental workflow for single-cell analysis (Chromium 5′ scRNA-seq and scTCR-seq) and identification of SARS-CoV-2-specific T cells. Briefly, 16 paired BALF and PBMC samples from 13 patients were subjected to single-cell sequencing. The remaining cells from these PBMC samples were labeled with CTV and cultured ex vivo under stimulation with SARS-CoV-2 peptide pools; the proliferated short-term T cell lines (CTVlo population) were sorted for subsequent bulk TCR-seq, identifying specific TCRs. scTCR-seq sequences were then aligned with the bulk TCR sequences to identify antigen-specific T cells and obtain their single-cell transcriptomic profiles. A cell was defined as antigen-specific if both its TRAV and TRBV sequences matched those in the specific TCR repertoire. b,c, Venn diagrams illustrating the number of overlapping and unique TCR clones, along with the corresponding total T cell (b) and SARS-CoV-2-specific T cell (c) counts between BALF and PBMC. d,e, Comprehensive summary of T cell clonality based on tissue (BALF and PBMC) (d) and cell types (CD4+ and CD8+ T cells) (e). f, Summary of specific T cell clonality. g, Abundance and diversity of specific T cell repertoire in BALF and PBMCs. Comparison of the Hill diversity index (qD, y-axis) over varying diversity orders (q, x-axis) was shown. The shaded area represents the 95% CI. h, Distribution of specific T cell clones among the top 200 ranked T cell clones in the entire T cell repertoire from BALF and PBMCs. The red rectangles indicate specific T cell clones and the gray ones stand for undefined clones. i, Upset plots illustrating the TRBV clonotypes shared among virus-specific and total T cells identified from single-cell sequencing data in the BALF and PBMC samples, along with published SARS-CoV-2-specific TCR sequences. Colored dots connected by lines represent shared clonotypes. The horizontal bar graph shows the total number of TCR clonotypes for each cluster intersection, while the vertical bar graph indicates the number of clonotypes shared across overlapping clusters.
Fig. 5
Fig. 5. Transcriptional features of specific T cells in BALF and PBMCs.
a, Uniform manifold approximation and projection (UMAP) plot displaying the transcriptomic clusters of all T cells from the 16 paired BALF and PBMC samples from 13 patients. b, Distribution of clusters in BALF (red) and PBMCs (blue). c, Summary of cluster proportions on T cells in BALF and PBMCs. d, Average expression (color scale) and percentage of expressing cells (size scale) of selected genes across the indicated clusters of total T cells. e, Distribution of specific T cells (red dots) in BALF (left) and PBMCs (right). f, Summary of cluster proportions of specific T cells in BALF and PBMCs. g, Volcano plots showing differentially expressed genes (DEGs) in specific CD4+ and CD8+ T cells between BALF and PBMCs. The names of the indicated DEGs are shown. Horizontal black dashed line: Benjamini–Hochberg Padj = 0.05. h, Enriched immune pathways in specific T cells in BALF versus PBMCs were identified based on the normalized enrichment score (NES), with statistical significance defined as P < 0.05 after Benjamini–Hochberg correction. The count denotes the pathway size reflecting the number of genes detected in the expression dataset. i, Dot plots illustrating key genes in the indicated functional modules of specific T cells in BALF and PBMCs. j, Two-tailed Spearman correlation analysis between the indicated genes expressed in specific CD4+ (pink) and CD8+ (aqua) T cells in BALF.
Fig. 6
Fig. 6. Comparison of overlapping specific T cell clones in BALF and PBMCs.
a, Distribution of specific T cell clones (cl.) overlapping between BALF and PBMCs, mapped onto T cell clusters colored according to the indicated clones. b, Pie charts summarizing the cumulative cluster proportions of specific T cells covering the 49 overlapped T cell clones, with T cell clustering corresponding to Fig. 5a. c, Variation in clone size for each clone from BALF and PBMCs, with clones colored as in a. d, Comparison of expression levels of selected genes in the 49 overlapped T cell clones between BALF (red) and PBMCs (blue). Each dot represents one T cell clone, with consistent clones connected by a gray line. The box plots depict the median and IQRs, with the whiskers extending to 1.5× the IQR or maximum value (two-tailed pairwise Wilcoxon rank-sum tests with Benjamini–Hochberg correction).
Fig. 7
Fig. 7. Potently activated specific T cells contribute to viral clearance.
a,b, Kinetics (a) and summary (b) of specific T cells in BALF over the sampling time (dpo) during viral shedding (RNA+, red, ns/np: 61/60) and after viral clearance (RNA, blue, ns/np: 52/51). Data are presented as the mean ± s.e.m., with the number of samples (ns) and patients (np) indicated. Statistical comparisons were performed using a linear mixed-effects model fit by REML, with two-tailed t-tests based on Satterthwaite’s method. c, Clonality analysis of specific T cells in BALF at the RNA+ (n = 8) and RNA (n = 8) stages. d, Distribution (left) and clone size (right) of persistent specific T cell clones from RNA+ to RNA stages in the BALF samples. e, Volcano plot of DEGs in specific CD4+ and CD8+ T cells in BALF comparing the RNA+ and RNA stages. Horizontal black dashed line: Benjamini–Hochberg Padj = 0.05. f, GSEA analysis of specific CD4+ (top) and CD8+ (bottom) T cells in BALF comparing RNA+ (n = 8) versus RNA (n = 8) stages. g, Comparison of immune function-associated scoring modules between specific T cells during the RNA+ (n = 8) and RNA (n = 8) stages. The scoring methods are detailed in the Methods. Data are presented as the mean ± s.d.; a two-tailed Mann–Whitney U-test was used. h, Proportion of cell subclusters (clustered in Extended Data Fig. 3a) in BALF during the RNA+ and RNA stages. i, Proportion of the AM population in leukocytes (CD45+) in BALF samples between the RNA+ (n = 56) and RNA (n = 50) stages based on flow data. Each dot represents one sample. Data are shown as the mean ± s.e.m.; a two-tailed Mann–Whitney U-test was used. j, Circos plot depicting prioritized ligand–receptor interactions between T cells and other cell types in BALF. The outer ring shows the color-coded cell types, while the inner ring highlights the ligand–receptor pairs. The line and arrow widths are proportional to the log fold change between the RNA and RNA+ progression stages in ligands and receptors, respectively. Different colors and line types denote several types of interactions, as outlined in the legend. FDR, false discovery rate. Source data
Fig. 8
Fig. 8. Antigen-specific T cells in BALF exhibit a differentiation bias toward multifunctional TRM cells after viral clearance.
a, The proportion of indicated specific T cell subclusters (related to Fig. 5a) in BALF varied from viral shedding stage (RNA+, n = 8) to viral clearance (RNA, n = 8). b,c, Pseudotime trajectories for specific CD4+ (b) and CD8+ (c) T cells from 16 paired BALF and PBMC samples based on Monocle, showing three lineages on CD4+ and two lineages on CD8+ T cells. Cells are color-coded based on their phenotypes (related to a), with the arrows indicating the pseudotime trajectories. Each dot represents one cell. d,e, Trajectory inference analyses depicting the transition potential of specific CD4+ (d) and CD8+ (e) T cells from viral shedding stage (RNA+) to viral clearance (RNA) in BALF and PBMCs. f,g, Gene expression dynamics in specific CD4+ (f) and CD8+ (g) T cells along the pseudotime in BALF. Genes were clustered into eight and 12 gene sets based on specific expression profiles, respectively, with selected marker genes shown. h,i, Density plots reflecting the number of specific CD4+ (h) and CD8+ (i) T cells among the indicated T cell subclusters stratified according to RNA+ versus RNA in BALF. The x axis indicates pseudotime (related to f,g) and the y axis indicates probability density distribution of each T cell lineage at a different pseudotime. j, Distribution of specific T cells from BALF and PBMCs on TriMap according to RNA+ (n = 4, 5) and RNA (n = 6, 6) stages based on the flow cytometry dataset. k, Cumulative cluster proportions of specific T cells from BALF and PBMCs at the RNA+ (n = 4, 5) and RNA (n = 6, 6) stages were compared using pie charts. Each segment is color-coded to represent different functional clusters, as shown at the bottom (related to Fig. 3e). A two-tailed chi-squared test was used. l, Clusters that significantly increased in BALF from the RNA+ to the RNA stages are shown. Each dot represents one sample. Data are presented as the mean ± s.e.m.; a two-tailed Mann–Whitney U-test was used. Source data
Extended Data Fig. 1
Extended Data Fig. 1. Schematic overview of specific T cell analysis in BALF and PBMC samples from COVID-19 patients.
(a) Schematic overview illustrating the comprehensive analysis workflow of BALF and PBMC samples. The analysis includes flow cytometry, 10x single-cell RNA and TCR sequencing, and Smart-seq2 single-cell sequencing. (b) Flowcytometric gating strategy for identifying SARS-CoV-2-specific T cells in PBMC and BALF samples.
Extended Data Fig. 2
Extended Data Fig. 2. Highly activated T cells in the inflammatory airway environment.
(a) Heatmap displaying the expression of indicated proteins across 9 clusters mapped onto the specific T cell TriMap, derived from FlowSOM data related to Fig. 3. (b) Representative flow plots of cellular memory population of SARS-CoV-2-specific and total T cells according to CCR7 and CD45RA expression. (c) Summary of cellular memory population of total CD4+ and CD8+ T cells in PBMC (n = 22) and BALF (n = 23). Data are presented as mean ± SEM. (d) Wilcoxon matched-pairs comparison with signed rank test of indicated cytokine levels between 18 paired BALF supernatants and plasma samples. Source data
Extended Data Fig. 3
Extended Data Fig. 3. Transcriptional features of cells in BALF and PBMC.
(a) Overview of the cell clusters in the integrated single cell transcriptomes of 186451 cells derived from BALF and PBMC in COVID-19 patients. Proportion of cell clusters in BALF and PBMC were summarized. (b) Clusters were defined according to the cluster-specific gene expression patterns.
Extended Data Fig. 4
Extended Data Fig. 4. TCR repertoire features of T cells in BALF and PBMC.
(a) Flow plots showing the gating strategy for specific T cells sorting from proliferated short-term T cell lines. (b) Spearman correlation (two-tailed) between frequencies of specific T cells in the BALF detected by intracellular cytokine staining and defined in single cell transcriptome based on the TCR aligning to the proliferated T cells upon SARS-CoV-2 peptide stimulation. (c) TCR diversity and abundance of all the CD4+ and CD8+ T cells in PBMC and BALF. The shaded area represents 95% CI. (d) Specific T cell clone distribution on the top 100 T cell clones of the whole T cell repertoire in pairing BALF and PBMC samples from PT1 at three sequential time points. Rectangles in red represent specific T cell clones and grey ones stand for undefined ones. Source data
Extended Data Fig. 5
Extended Data Fig. 5. SMARTseq2 analysis of HLA-B40:01-N322-330 epitope (B40/N322 Pent+) specific CD8+ T cells in BALF and PBMC.
(a-b) Corplots showing spearman correlation of indicated functional gene modules among specific CD4+ (a) and CD8+ (b) T cells in BALF, related to Fig. 5. The colors of the ellipses indicate the values of correlation coefficient, and the ellipses have their eccentricity parametrically scales to the correlation values. (c) Flow plots showing B40/N322 Pent+CD8+ T cells in paired BALF and PBMC samples from patients carrying HLA-B40:01 subtype, which were sorted and then processed for single-cell sorting into 96-well plates following with sensitive full-length transcriptome sequencing. (d) Wilcoxon matched-pairs comparison of frequencies of B40/N322 Pent+CD8+ T cells between 4 paired BALF and PBMC samples. (e)Volcano plot of DEGs in B40/N322-specific CD8+ T cells comparing BALF versus PBMC by Smart-seq2. Horizontal black dashed line: Benjamini-Hochberg adjusted P value = 0.05. (f) GSEA analysis on B40/N322-specific CD8+ T cells comparing BALF versus PBMC. (g) Dot plots showing expression level of selected genes in B40/N322-specific CD8+ T cells from BALF and PBMC. Source data
Extended Data Fig. 6
Extended Data Fig. 6. Comparison of specific T cells and the pulmonary and peripheral environments during viral shedding (RNA+) and viral clearance (RNA−) stages.
(a) Distribution (left) and summary (right) of specific T cell clone size transitions from the viral shedding stage (RNA+) to the viral clearance (RNA-) stage among persistent clones in PBMC samples (n = 5, 6). (b) Volcano plots of DEGs in specific CD4+ and CD8+ T cells in PBMC samples comparing RNA+ versus RNA- stages. Horizontal black dashed line: Benjamini-Hochberg adjusted P value = 0.05. (c-f) Volcano plot displaying DEGs in specific CD4+ (c) and CD8+ (e) T cells from BALF samples collected from PT1 at RNA+ (16 days after onset) and RNA- (31 and 34 days after onset) stages. Names of indicated DEGs are shown. Comparison of immune function-associated scoring modules between specific CD4+ (d) and CD8+ (f) T cells at RNA+ and RNA- stages were shown. Details of the scoring methods are introduced in the Methods section. Data are presented as mean ± SD, Mann–Whitney U-test. (g) Dot plots summarizing cytokine concentrations in BALF supernatant samples by RNA+ (n = 8) and RNA- (n = 10) groups. Data are shown as mean ± SEM. (h) Density plots reflecting the number of T cells along the specific CD4+ and CD8+ T-cell lineages stratified by RNA+ and RNA- stages in BALF and PBMC. The x-axis indicates pseudotime and the y-axis indicates probability density distribution of each T-cell lineages at different pseudotime. (i) T cell memory phenotyping according to the CCR7 and CD45RA protein expression of total and specific T cells in PBMC (n = 5, 6) and BALF (n = 4, 6) at viral shedding (RNA+) and viral clearance (RNA-) stages, derived from flowcytometric data. Data are presented as mean ± SEM. (j) TriMap visualized undefined T cell distribution according to FlowSOM clusters. Proportions of indicated clusters in BALF (n = 4, 6) and PBMC (n = 5, 6) distribution at viral shedding (RNA+) and viral clearance (RNA-) stages were depicted by Pie charts. Chi-square test. Source data

References

    1. Roukens, A. H. E. et al. Prolonged activation of nasal immune cell populations and development of tissue-resident SARS-CoV-2-specific CD8+ T cell responses following COVID-19. Nat. Immunol.23, 23–32 (2022). - PubMed
    1. Wauters, E. et al. Discriminating mild from critical COVID-19 by innate and adaptive immune single-cell profiling of bronchoalveolar lavages. Cell Res.31, 272–290 (2021). - PMC - PubMed
    1. Grant, R. A. et al. Circuits between infected macrophages and T cells in SARS-CoV-2 pneumonia. Nature590, 635–641 (2021). - PMC - PubMed
    1. Weiskopf, D. et al. Phenotype and kinetics of SARS-CoV-2-specific T cells in COVID-19 patients with acute respiratory distress syndrome. Sci. Immunol.5, eabd2071 (2020). - PMC - PubMed
    1. Qiu, S. et al. Successful clearance of persistent SARS-CoV-2 asymptomatic infection following a single dose of Ad5-nCoV vaccine. Signal Transduct. Target. Ther.8, 123 (2023). - PMC - PubMed