. 2025 Apr;9(4):794-805.
doi: 10.1038/s41562-024-02080-7. Epub 2025 Jan 28.

Associations between common genetic variants and income provide insights about the socio-economic health gradient

Hyeokmoon Kweon  1 Casper A P Burik  1 Yuchen Ning  1 Rafael Ahlskog  2 Charley Xia  3 Erik Abner  4 Yanchun Bao  5 Laxmi Bhatta  6 Tariq O Faquih  7 Maud de Feijter  8 Paul Fisher  9 Andrea Gelemanović  10 Alexandros Giannelis  11 Jouke-Jan Hottenga  12 Bita Khalili  13   14 Yunsung Lee  15 Ruifang Li-Gao  7 Jaan Masso  16 Ronny Myhre  17 Teemu Palviainen  18 Cornelius A Rietveld  19   20 Alexander Teumer  21 Renske M Verweij  22 Emily A Willoughby  11 Esben Agerbo  23   24   25 Sven Bergmann  13   14 Dorret I Boomsma  12   26   27   28 Anders D Børglum  23   29   30 Ben M Brumpton  31   32   33 Neil Martin Davies  31   34   35 Tõnu Esko  4 Scott D Gordon  36 Georg Homuth  37 M Arfan Ikram  8 Magnus Johannesson  38 Jaakko Kaprio  18 Michael P Kidd  39   40 Zoltán Kutalik  13   41 Alex S F Kwong  42   43 James J Lee  11 Annemarie I Luik  8   44 Per Magnus  15 Pedro Marques-Vidal  45   46 Nicholas G Martin  35 Dennis O Mook-Kanamori  8   47 Preben Bo Mortensen  23   24   25 Sven Oskarsson  2 Emil M Pedersen  23   24   25 Ozren Polašek  10   48 Frits R Rosendaal  7 Melissa C Smart  9 Harold Snieder  49 Peter J van der Most  49 Peter Vollenweider  44   45 Henry Völzke  50 Gonneke Willemsen  12   51 Jonathan P Beauchamp  52 Thomas A DiPrete  53 Richard Karlsson Linnér  1   54 Qiongshi Lu  55 Tim T Morris  56 Aysu Okbay  1 K Paige Harden  57 Abdel Abdellaoui  58 W David Hill  59   60 Ronald de Vlaming  61 Daniel J Benjamin  62   63   64 Philipp D Koellinger  65   66
Affiliations

Associations between common genetic variants and income provide insights about the socio-economic health gradient

Hyeokmoon Kweon et al. Nat Hum Behav. 2025 Apr.

Abstract

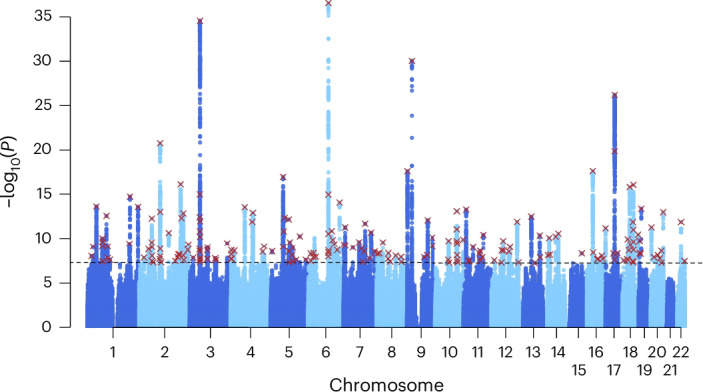
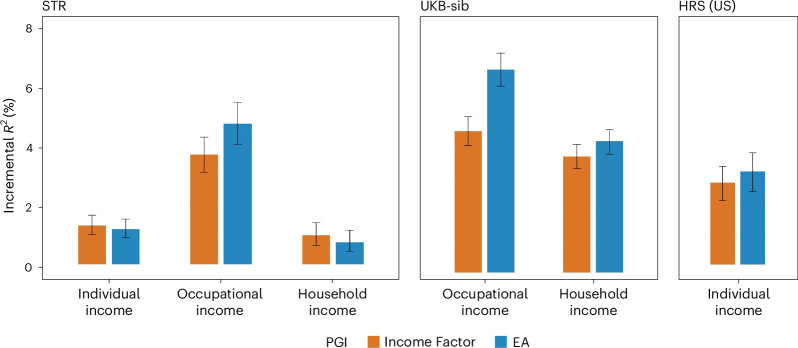
We conducted a genome-wide association study on income among individuals of European descent (N = 668,288) to investigate the relationship between socio-economic status and health disparities. We identified 162 genomic loci associated with a common genetic factor underlying various income measures, all with small effect sizes (the Income Factor). Our polygenic index captures 1-5% of income variance, with only one fourth due to direct genetic effects. A phenome-wide association study using this index showed reduced risks for diseases including hypertension, obesity, type 2 diabetes, depression, asthma and back pain. The Income Factor had a substantial genetic correlation (0.92, s.e. = 0.006) with educational attainment. Accounting for the genetic overlap of educational attainment with income revealed that the remaining genetic signal was linked to better mental health but reduced physical health and increased risky behaviours such as drinking and smoking. These findings highlight the complex genetic influences on income and health.


Conflict of interest statement

Competing interests: The authors declare no competing interests.

Figures

Fig. 1
Fig. 1. Genetic correlations between income measures.
LDSC estimates of pairwise genetic correlations between the four input income measures, the meta-analysed income (Income Factor) and EA. The diagonal elements report SNP heritabilities from LDSC. The standard errors are reported in parentheses. Some of the results were out-of-bound estimates (exceeding 1.2).
Fig. 2
Fig. 2. Multivariate GWAS of income.
Manhattan plot presenting the GWAS results for the Income Factor. Unadjusted two-sided Z-test. P values are plotted on the −log10 scale. The red crosses indicate the lead SNPs found from FUMA (r2 < 0.1). The horizontal dashed line indicates genome-wide significance (P < 5 × 10⁸).
Fig. 3
Fig. 3. Polygenic prediction of income measures.
Polygenic prediction results in the STR, the UKB-sib and the HRS with PGIs for Income Factor and EA. Prior to fitting the regressions, each phenotype was residualized for demographic covariates (sex, a third-degree polynomial of age and interactions with sex) within each wave, and the mean of the residuals was obtained across the waves for each individual (only a single wave for the UKB-sib). Incremental R2 is the difference between the R2 from regressing the residualized outcome on the PGI and the controls (20 genetic PCs and genotyping batch indicators) and the R2 from a regression only on the controls. Only individuals of European ancestry were included, and one sibling from each family was randomly chosen: N = 24,946 (individual), 19,245 (occupational) and 15,655 (household) for the STR; 15,556 (occupational) and 18,303 (household) for the UKB-sib; and 6,171 (individual) for the HRS. The error bars indicate 95% CIs obtained by bootstrapping the sample 1,000 times.
Fig. 4
Fig. 4. Genetic correlation estimates with health outcomes.
Genetic correlation estimates of Income Factor, NonEA-Income and EA with health outcomes. Point estimates were obtained from LDSC and are displayed as dots. The whiskers show 95% CIs. The black asterisks indicate statistical significance of NonEA-Income at the FDR of 5%. The red asterisks indicate that the estimate is also significantly different from the estimate for EA at the FDR of 5%. The standard error for the difference was computed from jackknife estimates. Detailed results for all traits, including the sample size for each of the traits, is presented in Supplementary Table 23. ADHD, attention deficit hyperactivity disorder.
Fig. 5
Fig. 5. Phenome-wide association study of the Income Factor PGI (without parental PGI controls) in electronic health records for the UKB-sib sample.
The genetic association of Income Factor PGI with 115 diseases from 15 categories without controlling for parental PGIs. The yellow boxes, with arrows pointing to the observations and −log10(P) values reported after the phenotypes, highlight diseases that are strongly associated with the Income Factor PGI (−log10(P) > 10). The P values were obtained via unadjusted two-sided Z-tests. The black and red dashed lines represent the threshold for statistical significance at P < 0.05. GERD, gastroesophageal reflux disease.
Extended Data Fig. 1
Extended Data Fig. 1. Venn diagram of loci across phenotypes.
The diagram shows how genome-wide significant loci and genes mapped to the 86 independent loci are distributed across the four income phenotypes. (a.) The 86 genome- wide significant loci and their overlap across the four income phenotypes is shown (b.) Gene-based statistics were derived using MAGMA for genes whose physical boundaries overlapped with a genome-wide significant loci from the four income phenotypes.
Extended Data Fig. 2
Extended Data Fig. 2. Cross-cohort genetic correlations of income stratified by sex and country.
LDSC estimates for cross-cohort genetic correlations of income (a.) between countries and (b.) between male (M) and female (F). The diagonal elements report SNP heritabilities. The standard errors are reported in parentheses. Some of the results were out-of-bound estimates (exceeding 1).
Extended Data Fig. 3
Extended Data Fig. 3. Polygenic overlap of income with EA and GWAS-by-subtraction.
(a.) Venn diagram presenting MiXeR results on unique and shared polygenic components for Income Factor (orange) and EA (blue). The estimated numbers of unique and shared variants are represented in thousands and illustrated by the areas of the circles: 0.45 and 2,260 unique variants for income and EA, respectively, and 11,153 shared variants. rg is the global genetic correlation while rs is the correlation within the shared variants. The standard errors are reported in the parentheses. (b.) The GWAS-by-subtraction model of non-EA income describes the genetic effect of income for SNP j βjINC as the sum of two components: 1) αβjEA: the indirect effect that reflects the genetic association of EA and 2) δj: the direct effect of SNPs on income reflects the genetic effect of income after statistically removing its genetic covariance with EA. Note that the diagram only depicts a statistical meditation for interpretation and is not meant to imply any directionality or causal ordering of SNPs to phenotypes. (c.) Manhattan plot showing the NonEA genetic associations of the Income Factor (NonEA-Income, corresponding to δj from b.). Unadjusted two-sided Z-test. p-values are plotted on the −log10 scale.
Extended Data Fig. 4
Extended Data Fig. 4. Polygenic prediction of income with additional controls.
The figure reports polygenic prediction results in the UKB siblings with the Income Factor PGI and additional controls (EA or the PGI for EA). Before fitting the regressions, each phenotype was residualised for demographic covariates (a third-degree polynomial for age, year of observation, and interactions with sex). The incremental R2 is calculated as the difference between the R2 from regressing the residualised outcome on both the Income Factor PGI and the controls and the R2 from regressing only on the controls. The baseline controls include 20 genetic PCs and genotyping batch indicators. Only individuals of European ancestry were included, and one sibling from each family was randomly chosen. The error bars indicate 95% confidence intervals around the incremental R2 obtained by bootstrapping the sample 1,000 times.
Extended Data Fig. 5
Extended Data Fig. 5. Phenome-wide association study of the Income Factor PGI in electronic health records for the UKB sibling sample.
The figure presents results from a phenome-wide association study using in-patient electronic health records from the UKB sibling sample, focusing on 115 diseases with sex-specific prevalence of at least 1%. Case-control status was determined using the phecode v1.2 scheme, which maps the UKB's ICD-9/10 records. The case-control status was regressed on the Income Factor PGI, both with and without controlling for parental PGI. Additional covariates included birth year, its squared term, their interactions with sex, genotype batch dummies, and 20 genetic principal components (PCs). Standard errors were clustered by family. The sign of the coefficient estimates was reversed to reflect a decrease in the probability of having the disease. Results were plotted only for diseases significantly associated with Income Factor PGI at a 5% FDR, with parental PGI controlled for. Dots represent point estimates of the incremental R2 for Income Factor PGI on each disease, while error bars show unadjusted 95% confidence intervals.
Extended Data Fig. 6
Extended Data Fig. 6. Biological annotation.
(a.) The Venn diagram illustrates the overlap of genes implicated in the Income Factor using four methods: positional mapping, eQTL mapping, chromatin interaction mapping, and MAGMA gene-based analysis. (b.) The figures show the results of tissue-specific enrichment analysis using LDSC-SEG (left) and MAGMA gene-property analysis (right). Each circle represents a tissue or cell type from the GTEx or Franke lab gene expression datasets, with larger circles indicating statistical significance at a 5% false discovery rate. Full results are available in Supplementary Table 26.
Extended Data Fig. 7
Extended Data Fig. 7. Vene diagram of genes associated with the Income Factor, household income, and educational attainment.
(a.) Gene-based statistics for household income and educational attainment were sourced from Hill et al.. and Lee et al.. respectively. A Bonferroni correction was applied for each trait to determine statistical significance. (b.) Vene diagram of gene sets associated with the Income Factor, household income and educational attainment based on FUMA GENE2FUNC analyses and a test of overrepresentation at FDR <0.05. See Supplementary Tables 35–37 for further details.

References

    1. Ridley, M., Rao, G., Schilbach, F. & Patel, V. Poverty, depression, and anxiety: causal evidence and mechanisms. Science370, eaay0214 (2020). - PubMed
    1. Braveman, P. A., Cubbin, C., Egerter, S., Williams, D. R. & Pamuk, E. Socioeconomic disparities in health in the United States: what the patterns tell us. Am. J. Public Health100, S186–S196 (2010). - PMC - PubMed
    1. Stevenson, B. & Wolfers, J. Subjective well-being and income: is there any evidence of satiation? Am. Econ. Rev.103, 598–604 (2013).
    1. Wilkinson, R. G. & Marmot, M. Social Determinants of Health: The Solid Facts (World Health Organization, 2003).
    1. Stringhini, S. et al. Socioeconomic status and the 25 × 25 risk factors as determinants of premature mortality: a multicohort study and meta-analysis of 1.7 million men and women. Lancet389, 1229–1237 (2017). - PMC - PubMed

LinkOut - more resources