. 2025 Jan 29;82(1):64.
doi: 10.1007/s00018-024-05563-y.

NFAT5 exacerbates β-cell ferroptosis by suppressing the transcription of PRDX2 in obese type 2 diabetes mellitus

Affiliations

NFAT5 exacerbates β-cell ferroptosis by suppressing the transcription of PRDX2 in obese type 2 diabetes mellitus

Gaopeng Guan et al. Cell Mol Life Sci. .

Abstract

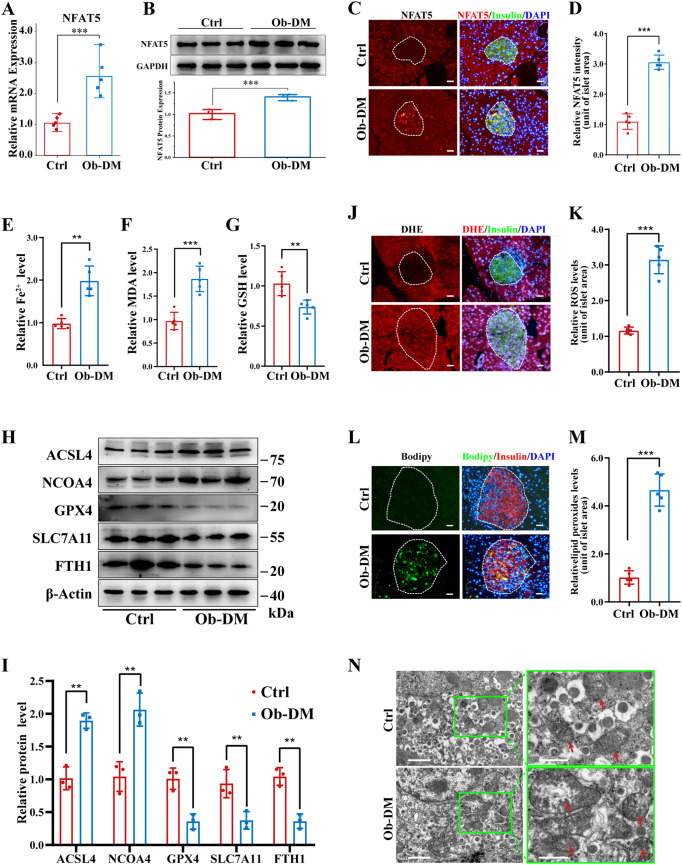
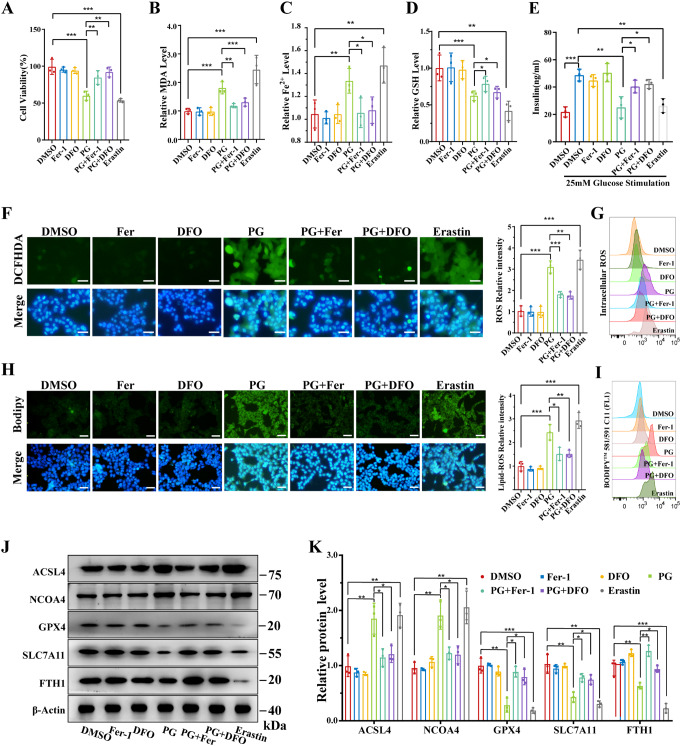
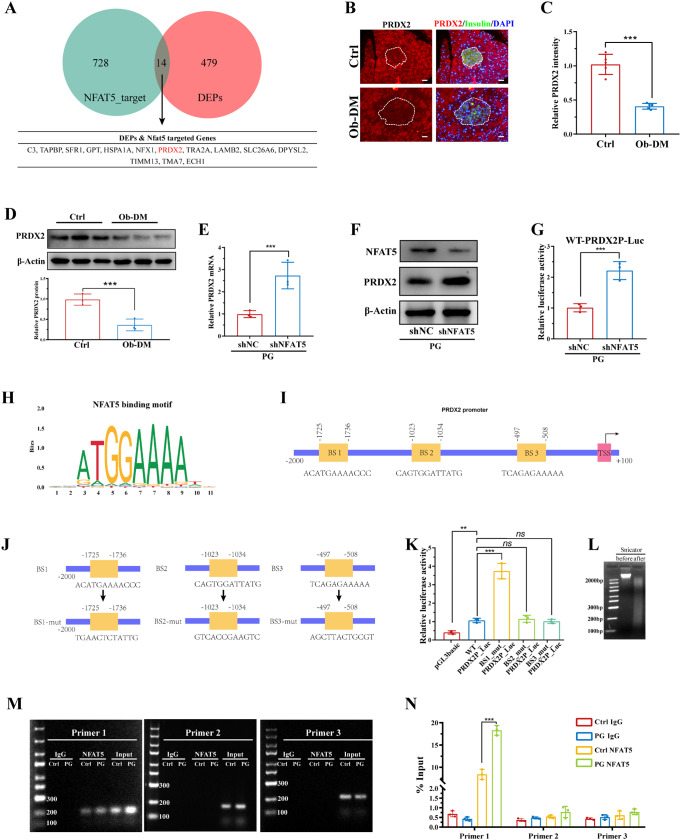
Pancreatic β-cell damage is a critical pathological mechanism in the progression of obese type 2 diabetes mellitus (T2DM). However, the exact underlying mechanism remains unclear. We established an obese T2DM mouse model via high-fat diet feeding. The protein expression profiles of pancreatic tissues from normal and obese T2DM mice were analyzed, revealing that nuclear factor of activated T cells 5 (NFAT5) and ferroptosis are potential mediators and mechanisms of β-cell damage in obese T2DM mice. In vitro, high glucose and palmitate treatment resulted in increased NFAT5 expression and nuclear translocation in MIN6 cells. Inhibition of NFAT5 expression by shRNA significantly reduced ferroptosis and improved the reduction in insulin secretion in palmitic acid and high glucose (PG)-treated MIN6 cells. Luciferase reporter and chromatin immunoprecipitation (ChIP) assays confirmed the ability of NFAT5 to bind to the peroxiredoxin 2 (PRDX2) promoter, leading to the downregulation of PRDX2 transcription. Subsequent rescue experiments confirmed that NFAT5 is involved in PG-induced ferroptosis in MIN6 cells by inhibiting the expression of PRDX2. Finally, we demonstrated that the use of the AAV8-RIP2-miR30-shNFAT5 vector to specifically inhibit the expression of NFAT5 in β-cells significantly diminishes ferroptosis in obese T2DM mice, thereby increasing insulin secretion and improving abnormal glucose tolerance. These findings collectively highlight the therapeutic potential of targeting NFAT5 in β cells to counteract obesity-induced T2DM.

Keywords: Ferroptosis; Nuclear factor of activated T cells 5; Pancreatic β-cells; Peroxiredoxin-2; Type 2 diabetes mellitus.


Conflict of interest statement

Declarations. Ethics approval and consent to participate: The Institutional Animal Care Committee of Central South University approved all the experimental procedures (ethics number CSU-2022-0001-0040). Consent for publication: All the authors agree to publication. Competing interests: The authors declare that they have no conflicts of interest.

Figures

Fig. 1
Fig. 1
NFAT5 and ferroptosis may be related to obese T2DM-related pancreatic β-cell damage. (A) Monitoring of body weight per mouse throughout the experiment. (B, C) IPGTTs and IPITTs were performed on Ctrl group mice and Ob-DM group mice for 24 weeks. (D) Heatmap depicting the top 50 differentially expressed proteins. (E) Volcano plot illustrating differential protein expression. (F) KEGG pathway enrichment analysis results are represented in a bubble diagram. (G-I) Pearson correlation analysis examining the relationship between NFAT5 expression and the expression of ACSL4, GPX4, and FTH1 on the basis of proteomic sequencing data. All the results are presented as the mean ± standard deviation (SD). Significance levels are denoted as follows: *p < 0.05, **p < 0.01, ***p < 0.001
Fig. 2
Fig. 2
NFAT5 and ferroptosis in β-cells from obese T2DM. (A-B) NFAT5 expression in the pancreas was evaluated via qPCR and Western blot analysis. (C) Insulin (green) and NFAT5 (red) were stained via double immunofluorescence, and the cell nuclei (blue) in the pancreatic tissue were stained blue with DAPI. (D) Quantification of NFAT5 levels within islets normalized to the unit area of the islet. (E-G) Levels of Fe2+, MDA, and GSH in pancreatic tissue. (H) WB was performed to analyze the protein levels of ACSL4, NCOA4, SLC7A11, GPX4, and FTH1 in pancreatic tissue. (I) Quantitative analysis of WB gray values. (J) Insulin immunofluorescence (green) and adjacent slices stained with DHE (red) in pancreatic tissue. (K) Measurement of ROS levels in islets standardized to the islet area. (L) Insulin immunofluorescence (red) and BODIPY C11 staining of adjacent slices (green). DAPI was used to stain the cell nuclei (blue) in the pancreatic tissue. (M) Quantification of lipid peroxide levels within islets normalized to the unit area of the islet. (N) Transmission electron microscopy (TEM) image showing β-cells. All the results are presented as the mean ± SD. Significance levels are denoted as follows: *p < 0.05, **p < 0.01, ***p < 0.001. (C, J, L) Scale bars are 100 μm. (N) From left to right: 5 μm, and 2 μm
Fig. 3
Fig. 3
Ferroptosis is involved in the PG-induced functional impairment of MIN6 cells. Min6 cells were exposed to 200 µM/25 mM PG for 48 h after being pretreated with 5 µM Fer-1, 10 µM DFO, or 5 µM erastin for 6 h, after which cell viability was measured via a CCK8 assay (A). DMSO served as a solvent control. The levels of MDA (B), Fe2+ (C), and GSH (D) were measured in Min6 cells treated with PG and pretreated with Fer-1, DFO, or erastin. To estimate the secretion ability of MIN6 cells under different treatment, GSIS was performed with or without 25mM glucose stimulation (E). Intracellular ROS can be detected through DCFHDA staining, which involves fluorescence imaging (F), and flow cytometry (G). Assessment of lipid peroxides through BODIPY C11 fluorescence imaging (H) and flow cytometry analysis (I). WB analysis was performed to assess the protein expression of ACSL4, NCOA4, GPX4, SLC7A11, and FTH1 in Min6 cells under various conditions (J), and band intensities were quantified with ImageJ (K). All the results are presented as the mean ± SD. Significance levels are denoted as follows: *p < 0.05, **p < 0.01, ***p < 0.001. (F) Scale bars are 30 μm and (H) 50 μm
Fig. 4
Fig. 4
NFAT5 is a key regulator of ferroptosis in PG-treated cells. NFAT5 expression was analyzed in Min6 cells exposed to 200 mM/25 mM PG for 12, 24, 48, or 72 h. (A) Nuclear and cytoplasmic proteins were isolated and subjected to WB, with β-actin and lamin B1 serving as loading controls for the cytoplasmic and nuclear fractions, respectively. (B) Detection of total NFAT5 protein expression by WB, with β-actin serving as a loading control. (C) Quantification of NFAT5 mRNA expression. (D) Immunofluorescence was used to observe the presence and levels of NFAT5 in Min6 cells exposed to 200 mM/25 mM PG for 12, 24, 48, or 72 h. (E) Insulin secretion was evaluated through GSIS tests in MIN6 cells exposed to PG after transfection with shNC or shNFAT5 plasmids. (F) Detection of cell viability. (G-I) The following evaluations involved measuring the concentrations of MDA, GSH, and Fe2+. (J-L) ROS levels were evaluated via DCFHDA staining through fluorescence imaging (J), measurement of ROS levels (K), or flow cytometry analysis (L). Lipid peroxides were detected via BODIPY C11 staining, fluorescence imaging (M), measurement of lipid peroxide levels (N), or flow cytometry analysis (O). The protein levels of NFAT5, ACSL4, and GPX4 were measured via WB, and the band intensities were quantified via ImageJ (P, Q). All the results are presented as the mean ± SD. Significance levels are denoted as follows: ns = nonsignificant difference, *p < 0.05, **p < 0.01, ***p < 0.001. (D, J) Scale bars are 30 μm and (M) 50 μm, respectively
Fig. 5
Fig. 5
NFAT5-mediated transcriptional regulation of PRDX2. (A) NFAT5 target genes can be predicted via a Venn diagram, which involves integrating our proteomic data with predicted targets from http://bioinfo.life.hust.edu.cn/hTFtarget#!/. Intersection analysis revealed 14 genes of interest. (B) Insulin and PRDX2 were detected via dual immunofluorescence staining, and DAPI was used to counterstain the nuclei. (C) Quantitative assessment of islet PRDX2 levels normalized to islet area (fluorescence intensity per unit of islet area). (D) WB was performed to analyze the protein expression of PRDX2. (E, F) The levels of PRDX2 mRNA and protein were assessed via qPCR and WB analysis after PG-treated MIN6 cells were transfected with shNC or shNFAT5 plasmids. (G) Luciferase reporter assays were performed to assess PRDX2 promoter activity after transfecting PG-treated MIN6 cells with shNC or shNFAT5 plasmids. (H) The NFAT5 binding motif sequence logo was retrieved from the JASPAR database. (I) JASPAR predicted three possible NFAT5 binding sites in the PRDX2 promoter region. (J) Mutations were introduced into the predicted NFAT5 binding sites to generate mutant promoters. (K) Luciferase reporter assays were conducted to assess the functionality of altered PRDX2 promoters in MIN6 cells treated with PG. (L) Chromatin immunoprecipitation (ChIP) experiments were conducted in MIN6 cell lysates before and after sonication, followed by agarose gel electrophoresis. (M) Common PCR was conducted after the ChIP experiment, which utilized three sets of primers to explore possible NFAT5 binding sites in the PRDX2 promoter region. (N) Quantitative analysis of the amount of DNA pulled down via qPCR. All the results are presented as the mean ± SD. Significance levels are denoted as follows: *p < 0.05, **p < 0.01, ***p < 0.001. Scale bars are 100 μm
Fig. 6
Fig. 6
Silencing of PRDX2 eliminates the defensive impact of NFAT5 knockdown in Min6 cells treated with PG. PG treatment was administered to Min6 cells following transfection with shNFAT5 plasmids either individually or in conjunction with shNFAT5 and shPRDX2 plasmids. (A, B) Western blotting was conducted to assess the protein expression of PRDX2, NFAT5, ACSL4, and GPX4, and band intensities were quantified with ImageJ. (C) GSIS assays were conducted to assess insulin secretion in MIN6 cells subjected to different treatments. (D-G) The following evaluations involved measuring cell viability and the concentrations of MDA, GSH, and Fe2+ under various treatment conditions. Intracellular ROS were detected via DCFHDA staining, followed by fluorescence imaging (H), measurement of ROS levels (I), or flow cytometry (J). Lipid peroxide levels were assessed via BODIPY C11 staining (K, L) and flow cytometry (M). All the results are presented as the mean ± SD. Significance levels are denoted as follows: *p < 0.05, **p < 0.01, ***p < 0.001. (H) Scale bars are 30 μm and (K) 50 μm
Fig. 7
Fig. 7
Effect of specific knockdown of NFAT5 in pancreatic β-cells from ob/ob mice. RIP2-shNC: AAV8-RIP2-miR30-shNC; RIP2-shNFAT5: AAV8-RIP2-miR30-shNFAT5. (A) Intraperitoneal injection of the RIP2-shNC or RIP2-shNFAT5 vector in ob/ob mice. After 4 weeks, insulin levels were measured in fasted and 2-hour refed mice. (B) Blood glucose levels after the IPGTT. (C) Blood glucose levels after the IPITT. (D-F) Insulin was marked green by immunofluorescence staining. NFAT5, PRDX2, or glucagon was marked in red respectively. NFAT5, PRDX2, or glucagon intensity was measured per islet area. (G) The protein levels of NFAT5, PRDX2, GPX4, and ACSL4 in the pancreas of these mice were measured via WB. (H) Quantitative analysis of WB gray values. (I-K) MDA, Fe2+ and GSH levels in pancreatic tissue were measured. (L) Insulin immunofluorescence (green) and adjacent slices stained with DHE (red) in pancreatic tissue. The measurement of ROS levels in islets was standardized to the islet area. (M) Insulin immunofluorescence (red) and BODIPY C11 staining of adjacent slices (green). The lipid peroxide levels within the islets were quantified and normalized to the unit area of the islet. (N) Representative TEM images of pancreatic β-cells. All the results are presented as the mean ± SD. Significance levels are denoted as follows: *p < 0.05, **p < 0.01, ***p < 0.001. (D-F, L, and M) Scale bars are 100 μm. (N) From left to right: 5 μm, and 2 μm, respectively
Fig. 8
Fig. 8
Schematic illustration of the mechanism by which NFAT5 is involved in ferroptosis via the suppression of the transcription of PRDX2 in β-cells in obese T2DM

References

    1. Chooi YC, Ding C, Magkos F (2019) The epidemiology of obesity. Metabolism 92:6–10 - PubMed
    1. Fujieda T (2024) Medical Management vs bariatric surgery in type 2 diabetes. JAMA 332(1):76 - PubMed
    1. Kahn SE, Hull RL, Utzschneider KM (2006) Mechanisms linking obesity to insulin resistance and type 2 diabetes. Nature 444(7121):840–846 - PubMed
    1. Prasad MK, Mohandas S, Ramkumar KM (2023) Dysfunctions, molecular mechanisms, and therapeutic strategies of pancreatic β-cells in diabetes. Apoptosis 28(7–8):958–976 - PubMed
    1. Miao R, Fang X, Zhang Y, Wei J, Zhang Y, Tian J (2023) Iron metabolism and ferroptosis in type 2 diabetes mellitus and complications: mechanisms and therapeutic opportunities. Cell Death Dis 14(3):186 - PMC - PubMed

MeSH terms