. 2025 Jun;47(3):4751-4762.
doi: 10.1007/s11357-025-01540-w. Epub 2025 Jan 29.

Whole-body networks: a holistic approach for studying aging

Affiliations

Whole-body networks: a holistic approach for studying aging

Orestis Stylianou et al. Geroscience. 2025 Jun.

Erratum in

Abstract

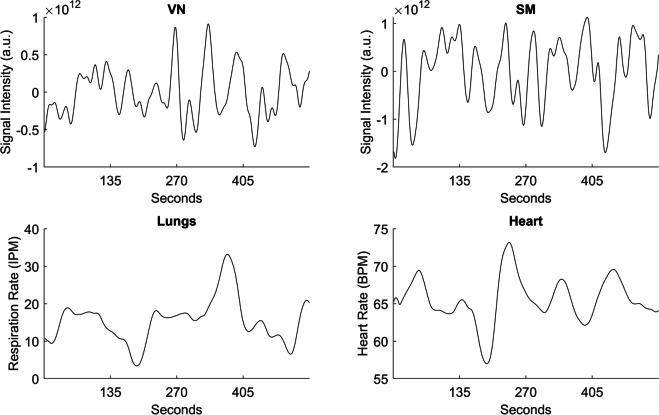
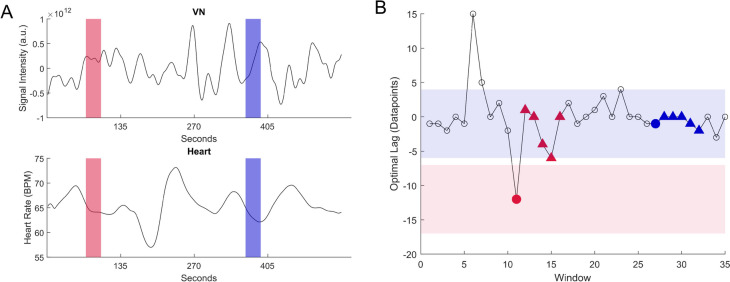
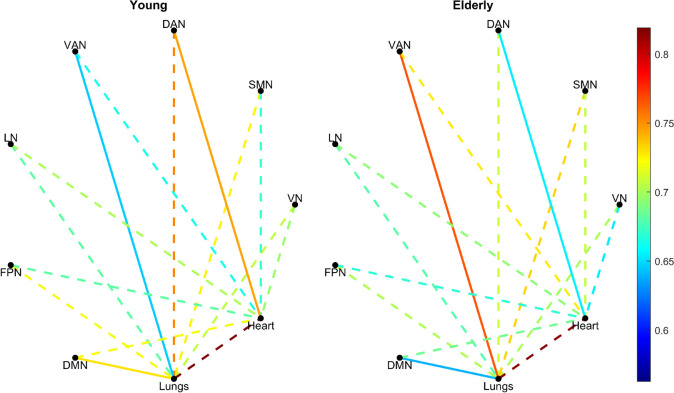
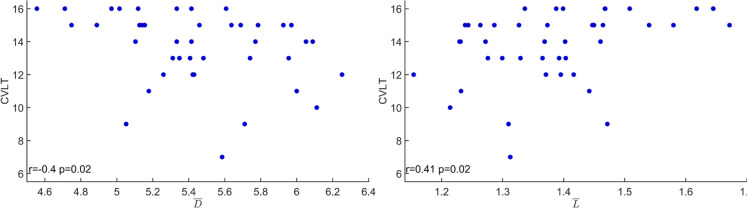
Aging is a multi-organ disease, yet the traditional approach has been to study each organ in isolation. Such organ-specific studies have provided invaluable information regarding its pathomechanisms. However, an overall picture of the whole-body network (WBN) during aging is still incomplete. In this study, we analyzed the functional magnetic resonance imaging blood-oxygen level-dependent, respiratory rate and heart rate time series of a young and an elderly group during eyes-open resting-state. We constructed WBNs by exploring the time-lagged coupling between the different organs. First, we showed that our analytical pipeline could identify regional differences in the networks of both cohorts, allowing us to proceed with the remaining analyses. The comparison of the WBNs revealed a complex relationship where some connections were stronger and some weaker in the elderly. Finally, the interconnectivity and segregation of the WBNs were negatively correlated with the short-term memory and verbal learning of the young participants. This study: i) validated our methodology, ii) identified differences in the WBNs of the two groups and iii) showed correlations of WBNs with behavioral measures. In conclusion, the concept of WBN shows great potential for the understanding of aging and age-related diseases.

Keywords: Aging; Network physiology; Time-delayed stability; Whole-body networks.


Conflict of interest statement

Declarations. Ethical approval and consent to participate: The Ethics Committee of the Brandenburg Medical School approved this study in accordance with Sect. 15 of the Brandenburg State Medical Association’s professional code of conduct. Consent for publication: Not applicable. Conflict of interests: The authors declare no competing interests.

Figures

Fig. 1
Fig. 1
Example of the signals used in this study. The top signals correspond to fMRI-BOLD activity from the visual (VN) and sensorimotor (SMN) network. The bottom signals correspond to respiration (Lungs) and heart (Heart) rate. a.u.: arbitrary unit, IPM: inspirations per minute, BPM: beats per minute
Fig. 2
Fig. 2
Demonstration of time delay stability (TDS). We started with the signals of visual network (VN) and heart rate (Heart), where we estimated the TDS in two different pairs of windows (red and blue) [Panel A]. In both sets of windows, we removed linear trends and normalized the time series. Then we estimated the optimal lag (where the absolute cross-correlation is maximized) and plotted it [Panel B]. The optimal lag for each window can be seen as a circle. We used the following five segments (50% overlap) (triangles in Panel B) to determine if a connection is stable. A connection is stable if four out of the five triangles are within the shaded areas. The shaded areas range from (optimal lag – 5 datapoints) to (optimal lag + 5 datapoints). The 5 datapoints cutoff corresponds to 7 s of lag in the time domain (7 s × sampling rate ≈ 5 datapoints). In this example, we see that the connection is stable only for the blue segment. a.u.: arbitrary unit, BPM: beats per minute
Fig. 3
Fig. 3
Regional variability of the constructed whole-body network. The red boxes correspond to connections that were significantly different in the elderly population. The blue boxes correspond to connections that were significantly different in the young population. White boxes represent non-significant differences. DMN: Default Mode Network, FPN: Frontoparietal Network, LN: Limbic Network, VAN: Ventral Attention Network, DAN: Dorsal Attention Network, SMN: Sensorimotor Network, VN: Visual Network
Fig. 4
Fig. 4
Comparison of young and elderly whole-body networks. The average time-delay stability value of the connections of the whole-body networks of the young (left) and elderly (right) is shown. Solid lines correspond to connections that were statistically different between the two populations. Dashed lines correspond to connections that were not statistically different between the two populations. DMN: Default Mode Network, FPN: Frontoparietal Network, LN: Limbic Network, VAN: Ventral Attention Network, DAN: Dorsal Attention Network, SMN: Sensorimotor Network, VN: Visual Network
Fig. 5
Fig. 5
Violin plots of the California Verbal Learning Task (CVLT) scores in the young and elderly population. The instructor read 16 words. The participant had to recall as many words as possible from this list. This was repeated four more times, using the same list of 16 words. The scores indicate the number of correct recalls the subjects had in the final (i.e. the fifth) trial
Fig. 6
Fig. 6
Correlations between network metrics (mean node degree/D¯ and mean path length/L¯) and California Verbal Learning Task (CVLT) scores in the young population

References

    1. Bulterijs S, Hull RS, Björk VCE, Roy AG. It is time to classify biological aging as a disease. Front Genet. 2015;6. 10.3389/fgene.2015.00205. - PMC - PubMed
    1. Zhavoronkov A, Bhullar B. Classifying aging as a disease in the context of ICD-11. Front Genet. 2015;6. 10.3389/fgene.2015.00326. - PMC - PubMed
    1. Cohen AA, et al. A complex systems approach to aging biology. Nat Aging. 2022;2(7):580–91. 10.1038/s43587-022-00252-6. - PMC - PubMed
    1. Cohen AA. Complex systems dynamics in aging: new evidence, continuing questions. Biogerontology. 2016;17(1):205–20. 10.1007/s10522-015-9584-x. - PMC - PubMed
    1. Belsky DW, et al. Quantification of biological aging in young adults. Proc Natl Acad Sci. 2015;112(30):E4104–10. 10.1073/pnas.1506264112. - PMC - PubMed

LinkOut - more resources