. 2025 Feb;15(2):e70206.
doi: 10.1002/ctm2.70206.

Oestrogen suppresses the adipogenesis of fibro/adipogenic progenitors through reactivating the METTL3-ESR1-mediated loop in post-menopausal females

Affiliations

Oestrogen suppresses the adipogenesis of fibro/adipogenic progenitors through reactivating the METTL3-ESR1-mediated loop in post-menopausal females

Hao Zhou et al. Clin Transl Med. 2025 Feb.

Abstract

Background: Post-menopausal women experience more severe muscular fatty infiltration, though the mechanisms remain unclear. The decline in estrogen levels is considered as a critical physiological alteration during post-menopause. Fibro/adipogenic progenitors (FAPs) are identified as major contributors to muscular fatty infiltration. This study aimed to investigate the detailed mechanism underlying the excessive muscular fatty infiltration in postmenopausal females.

Methods: Supraspinatus muscle samples were collected from female patients with or without menopause, and from mice with or without ovariectomy (OVX), to evaluate muscular fatty infiltration and isolated FAPs. The expressions of (estrogen receptor 1) ESR1, methyltransferase-like 3 (METTL3), and adipogenesis ability in FAPs from post-menopausal women and OVX mice were investigated. RNA sequencing (RNA-Seq) was performed to explore the gene expression profiles and potential mechanisms in FAPs from Pdgfrα-CreERT2; Esr1 knockout (Esr1 KO) mice and Esr1 flox/flox (Esr1 f/f) mice. The interplay of the METTL3-ESR1 mediated loop and its role in regulating adipogenesis in FAPs were investigated using dual luciferase reporter assays, chromatin immunoprecipitation (ChIP), and protein and RNA stability assays. The effects of estrogen supplementation on muscular fatty infiltration and locomotor function in OVX mice were evaluated by immunofluorescent staining and functional analysis.

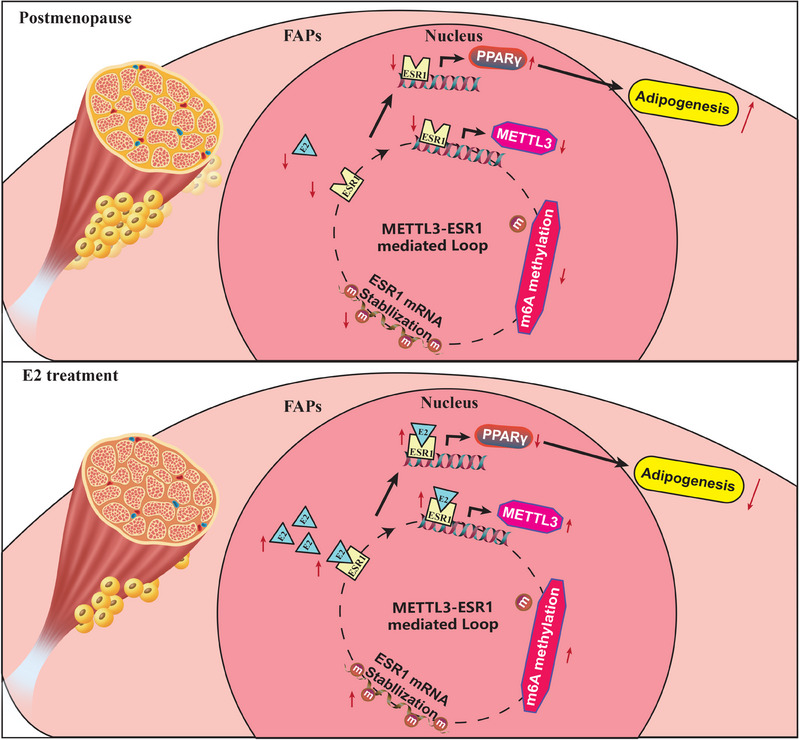
Results: Decreased expression of ESR1/METTL3 and increased adipogenesis ability in FAPs was found in post-menopausal female. METTL3-mediated m6A methylation promoted ESR1 mRNA stability at the post-transcriptional level in FAPs. METTL3-mediated m6A modification promoted ESR1 expression by stabilizing ESR1 mRNA, while ESR1 acted as a transcription factor that enhanced METTL3 transcription in turn. ESR1 also suppressed the transcription of the adipogenic transcription factor peroxisome proliferator-activated receptor gamma (PPARγ), thereby inhibiting adipogenesis in FAPs. Reactivation of the METTL3-ESR1 mediated loop by estrogen alleviated excessive adipogenesis in FAPs from post-menopausal women, and it also reduced muscular fatty infiltration, and improved locomotor function in OVX mice.

Conclusion: Excessive muscular fatty infiltration in post-menopausal women arose from the disruption of the METTL3-ESR1 mediated loop of FAPs due to estrogen deficiency. Reactivation of the METTL3-ESR1 mediated loop by estrogen may serve as a novel intervention to inhibit excessive adipogenesis of post-menopausal female FAPs, thereby ameliorating muscular fatty infiltration and improving locomotor function in post-menopausal females.

Key points: Oestrogen insufficiency disrupted the METTL3ESR1 loop in post-menopausal FAPs, causing excessive muscular fatty infiltration. METTL3-mediated m6A modification stabilized ESR1 mRNA and enhanced ESR1 expression, while increased ESR1 further promoted METTL3 transcription. ESR1 inhibited the transcription of adipogenic factor PPARγ, ameliorating adipogenesis in FAPs. Reactivating the METTL3ESR1 loop via oestrogen in FAPs reduced muscular fatty infiltration and improved locomotor function.

Keywords: ESR1; METTL3; adipogenesis; fibro/adipogenic progenitors (FAPs); m6A methylation; muscular fatty infiltration.


Conflict of interest statement

The authors declare no conflicts of interest.

Figures

FIGURE 1
FIGURE 1
Decreased expression of oestrogen receptor 1 (ESR1)/methyltransferase‐like 3 (METTL3) and increased adipogenesis ability in fibro/adipogenic progenitors (FAPs) was found in post‐menopausal female. (A) Bubble chart of GO analysis of up‐regulated and down‐regulated genes in FAPs from sham mouse (Control) and FAPs from ovariectomy (OVX) mouse. Key GO enrichment terms were highlighted with red frames. (B) Heat map of differentially expressed genes associated with the GO term of ESR1 signalling in FAPs from sham mouse (Control) and FAPs from OVX mouse. (C) Heat map of differentially expressed genes associated with the GO term of RNA methylation in FAPs from sham mouse (Control) and FAPs from OVX mouse. (D) Relative mRNA expression of Esr1 and N6‐methyladenosine (m6A) methyltransferases in FAPs from sham mouse (Control) and FAPs from OVX mouse (n = 3 mice/group). (E, F) Protein levels and quantitative assessment of ESR1, METTL3 and GAPDH of FAPs from sham mouse (Control) and FAPs from OVX mouse (n = 3 mice/group). (G) Relative mRNA expression of ESR1 in FAPs from peri‐menopausal females (Peri) and FAPs from post‐menopausal females (Post) (n = 8 patients/group). (H, I) Protein levels and quantitative assessment of ESR1, METTL3 and GAPDH in FAPs from peri‐menopausal females (Peri) and FAPs from post‐menopausal females (Post) (n = 3 patients/group). (J, K) Oil Red O staining and quantitative assessment of lipid accumulation in FAPs from peri‐menopausal females (Peri) and FAPs from post‐menopausal females (Post) after adipogenic differentiation for 10 days (n = 5 per condition). Red indicated Oil Red O, blue indicated DAPI and the merged images were shown. Scale bar, 50 µm. (L) Relative mRNA expression of adipogenic and lipogenic genes in FAPs from peri‐menopausal females (Peri) and FAPs from post‐menopausal females (Post) after adipogenic differentiation for 10 days (n = 3 per condition). Data were shown as mean ± standard deviation (SD), ns indicated no significant differences, * indicated p < .05, ** indicated p < .01, *** indicated p < .001, **** indicated p < .0001.
FIGURE 2
FIGURE 2
Methyltransferase‐like 3 (METTL3)‐mediated N6‐methyladenosine (m6A) methylation promoted oestrogen receptor 1 (ESR1) mRNA stability at the post‐transcriptional level in fibro/adipogenic progenitors (FAPs). (A) Scheme of the generation of FAPs specific Mettl3 flox/flox (Mettl3 f/f) mouse and FAPs‐specific Mettl3 knockout (Mettl3 KO) mouse. (B) Relative mRNA expression of Mettl3 in FAPs from Mettl3 f/f mice and Mettl3 KO mice (n = 3 mice/group). (C) Relative mRNA expression of Esr1 in FAPs from Pdgfrα‐CreERT2; Mettl3 flox/flox with no tamoxifen (TAM) treatment (Mettl3 f/f), Pdgfrα‐non‐CreERT2; Mettl3 flox/flox with TAM treatment (non‐CreERT2‐floxed + TAM), Pdgfrα‐non‐CreERT2; Mettl3 +/+ with TAM treatment (CreERT2‐non‐floxed + TAM) and Pdgfrα‐CreERT2; Mettl3 flox/flox with TAM treatment (Mettl3 KO) (n = 3 mice/group). (D, E) Protein expression and quantitative assessment of METTL3, ESR1 and GAPDH in freshly isolated FAPs from Mettl3 f/f mice and Mettl3 KO mice (n = 3 mice/group). (F) The potential m6A modification sites on Esr1 mRNA predicted by JASPAR. The Esr1 mRNA sequence was divided into five segments based on these predicted m6A methylation sites. (G) MeRIP‐qPCR analysis of the five segments of Esr1 between the anti‐IgG (IgG) group and anti‐m6A (IP) group in FAPs from Mettl3 f/f mice and Mettl3 KO mice (n = 3 per condition). (H) Schematic representation of Vector, Esr1 wild type (Esr1‐WT) and Esr1 mutant (Esr1‐Mut) luciferase reporter constructs. (I) Luciferase activity in FAPs from Mettl3 f/f mice and Mettl3 KO mice 48 h post‐transfection (n = 3 per condition). (J) Relative mRNA expression of Esr1 in FAPs from Mettl3 f/f mice and Mettl3 KO mice after transfection with pcDNA‐Esr1‐WT or pcDNA‐Esr1‐Mut for 48 h (n = 3 per condition). (K) RNA stability assay of Esr1 mRNA. Actinomycin D (Act‐D) was used in FAPs from Mettl3 f/f mice and Mettl3 KO mice, and ESR1 mRNA expression in FAPs from Mettl3 f/f mice and Mettl3 KO mice was analysed at indicated times (n = 3 per condition). (L, M) Protein stability assay of ESR1. Cycloheximide (CHX) was first used in FAPs from Mettl3 f/f mice and Mettl3 KO mice, and ESR1 protein expression was analysed at indicated times (n = 3 per condition). Data were shown as mean ± standard deviation (SD), ns indicated no significant differences, * indicated p < .05, ** indicated p < .01, *** indicated p < .001, **** indicated p < .0001.
FIGURE 3
FIGURE 3
Oestrogen receptor 1 (ESR1) could suppress adipogenesis ability of fibro/adipogenic progenitors (FAPs). (A, B) Oil Red O staining and quantitative assessment of lipid droplets formation in human FAPs following 10 days of adipogenic differentiation with treatment by dimethyl sulfoxide (DMSO), oestrogen (E2), ESR1 agonist propyl pyrazole triol (PPT) or ESR1 inhibitor MPP (MPP), respectively (n = 5 per condition). Red indicated Oil Red O, blue indicated DAPI and the merged images were shown. Scale bar, 50 µm. (C) Relative mRNA expression of adipogenic genes in human FAPs following 10 days of adipogenic differentiation with treatment by DMSO, oestrogen (E2), ESR1 agonist PPT (PPT) or ESR1 inhibitor MPP (MPP), respectively (n = 3 per condition). (D) Scheme of the generation of FAPs‐specific Esr1 flox/flox (Esr1 f/f) mouse and Esr1 knockout (Esr1 KO) mouse. (E) Relative mRNA expression of Esr1 and Mettl3 between FAPs from Esr1 f/f mice and Esr1 KO mice (n = 3 mice/group). (F, G) Protein levels and quantitative assessment of ESR1, methyltransferase‐like 3 (METTL3) and GAPDH between FAPs from Esr1 f/f mice and Esr1 KO mice (n = 3 mice/group). (H, I) Immunofluorescence staining of PLIN1 and quantitative assessment of lipid droplets in the supraspinatus muscles between Esr1 f/f mice and Esr1 KO mice (n = 4 mice/group). Red indicated PLIN1, blue indicated DAPI and the merged images were shown. Scale bar, 200 µm. (J) Quantification measurement of triglycerides in the supraspinatus muscle of Esr1 f/f mice and Esr1 KO mice (n = 5 mice/group). (K, L) Oil Red O staining and quantitative assessment of lipid droplets formation in FAPs from Esr1 f/f mice and Esr1 KO mice following 10 days of adipogenic differentiation (n = 5 per condition). Red indicated Oil Red O, blue indicated DAPI and the merged images were shown. Scale bar, 50 µm. (M) Relative mRNA expression of adipogenic and lipogenic genes between FAPs from Esr1 f/f mice and Esr1 KO mice following 10 days of adipogenic differentiation (n = 3 per condition). Data were shown as mean ± standard deviation (SD), * indicated p < .05, ** indicated p < .01, *** indicated p < .001, **** indicated p < .0001.
FIGURE 4
FIGURE 4
Oestrogen receptor 1 (ESR1) suppressed adipogenic differentiation of fibro/adipogenic progenitors (FAPs) by inhibiting transcription of peroxisome proliferator‐activated receptor gamma (PPARγ). (A) Bubble chart of GO analysis of up‐regulated and down‐regulated genes in FAPs from Esr1 knockout (KO) mouse when compared with those from Esr1 f/f mouse. Key GO terms were highlighted with red frames. (B) KEGG analysis of up‐regulated genes in FAPs from Esr1 KO mouse compared to those from Esr1 f/f mice. Key KEGG terms were highlighted with a red frame. (C) The sequence logo of potential ESR1 binding sites on the PPARγ promoter was predicted using JASPAR. (D) Scheme of construction of wild type (WT) and mutant pGL3‐PPARγ promoter reporter plasmids. (E, F) Protein levels and quantitative assessment of ESR1 and GAPDH after transfection with ESR1 overexpression (ESR1 OE) and vector (Vector) plasmids (n = 3 per condition). (G) Quantitative assessment of luciferase activity after transfection with WT and mutant (Mut) pGL3‐PPARγ promoter reporter plasmids in female FAPs transfected with ESR1 overexpression plasmid (n = 3 per condition). (H) Chromatin immunoprecipitation (ChIP)‐qPCR analysis for ESR1 binding to the PPARγ promoter in female FAPs under incubation with IgG or anti‐ESR1 antibodies (n = 3 per condition). Data were shown as mean ± standard deviation (SD), ns indicated no significant differences, * indicated p < .05, *** indicated p < .001, **** indicated p < .0001.
FIGURE 5
FIGURE 5
Oestrogen receptor 1 (ESR1) enhanced expression of methyltransferase‐like 3 (METTL3) in turn by serving as a transcription factor in fibro/adipogenic progenitors (FAPs). (A, B) Dot blot and quantitative assessment of relative N6‐methyladenosine (m6A) methylation levels in FAPs from peri‐menopausal (Peri) and post‐menopausal patients (Post; n = 3 patients/group). (C, D) Dot blot and quantitative assessment of relative m6A methylation levels in FAPs from sham mouse (Control) and FAPs from ovariectomy (OVX) mouse (n = 3 mice/group). (E) The sequence logo of potential ESR1 binding sites on the METTL3 promoter was predicted using JASPAR. (F) Scheme of wild type (WT) and mutant (Mut) pGL3‐METTL3 promoter reporter plasmids. (G, H) Protein levels and quantitative assessment of ESR1 and GAPDH in female FAPs transfected with vector (Vector) and ESR1 overexpression (ESR1 OE) plasmids (n = 3 per condition). (I) Relative luciferase activity after transfection of WT and mutant (Mut) pGL3‐METTL3 promoter reporter plasmids in female FAPs transfected with ESR1 overexpression plasmid (n = 3 per condition). (J) Chromatin immunoprecipitation (ChIP)‐qPCR for ESR1 binding to the METTL3 promoter in female FAPs under incubation with IgG or anti‐ESR1 antibodies (n = 3 per condition). Data were shown as mean ± standard deviation (SD), ns indicated no significant differences, * indicated p < .05, *** indicated p < .001.
FIGURE 6
FIGURE 6
E2 reactivated methyltransferase‐like 3 (METTL3)–oestrogen receptor 1 (ESR1)‐mediated loop in female post‐menopausal fibro/adipogenic progenitors (FAPs). (A) Chromatin immunoprecipitation (ChIP)‐qPCR for ESR1 binding to the peroxisome proliferator‐activated receptor gamma (PPARγ) promoter in female FAPs incubated with IgG or anti‐ESR1 antibodies following 3‐day treatments with either DMSO (Control) or oestrogen (E2) (n = 3 per condition). (B) ChIP‐qPCR for ESR1 binding to the METTL3 promoter in female FAPs incubated with IgG or anti‐ESR1 antibodies following 3‐day treatments with either DMSO (Control) or oestrogen (E2) (n = 3 per condition). (C, D) The protein levels of ESR1 and METTL3 in female post‐menopausal FAPs treated with DMSO (Control) or oestrogen (E2) (n = 3 per condition). (E, F) Oil Red O staining and quantitative assessment of female post‐menopausal FAPs treated with DMSO (Control) or oestrogen (E2) following 10 days of adipogenic differentiation (n = 5 per condition). Red indicated Oil Red O, blue indicated DAPI and the merged images were shown. Scale bar, 50 µm. (g) The mRNA expression of adipogenic and lipogenic genes in female post‐menopausal FAPs treated with DMSO (Control) or oestrogen (E2) following 10 days of adipogenic differentiation (n = 3 per condition). Data were shown as mean ± standard deviation (SD), * indicated p < .05, ** indicated p < .01, *** indicated p < .001, **** indicated p < .0001.
FIGURE 7
FIGURE 7
E2 treatment reduced fatty infiltration and improved locomotor function in ovariectomy (OVX) mice through activating the methyltransferase‐like 3 (METTL3)–oestrogen receptor 1 (ESR1)‐mediated loop. (A) Schematic diagram of the in vivo analysis of fatty infiltration, proteins level and locomotor function in OVX mice. OVX mice receiving daily subcutaneous injections of sesame oil were defined as the control group (Control), while OVX mice receiving sesame oil containing 17‐β‐estradiol‐3‐benzoate via subcutaneous injections were defined as the E2 group (E2). (B–D) Gait analysis including stride length and paw area of OVX mice from the control group and E2 group (n = 5 mice/group). (E, F) Treadmill tests of the control group (Control) and E2 group (E2) (n = 5 mice/group). (G, H) Immunofluorescence staining and quantitative assessment of fatty infiltration in the control group (Control) and E2 group (E2) (n = 5 mice/group). Red indicated PLIN1, blue indicated DAPI and the merged images were shown. Scale bar, 200 µm. (I) Quantification measurement of triglycerides in the supraspinatus muscles of the control group (Control) and E2 group (E2) (n = 5 mice/group). (J) MeRIP‐qPCR analysis of Esr1 between the anti‐IgG (IgG) group and anti‐N6‐methyladenosine (m6A) (IP) group in fibro/adipogenic progenitors (FAPs) of the control group (Control) and E2 group (E2) (n = 3 mice/group). (K, L) Protein levels and quantitative assessment of METTL3, ESR1, peroxisome proliferator‐activated receptor gamma (PPARγ) and GAPDH in the control group (Control) and E2 group (E2) (n = 3 mice/group). Data were shown as mean ± standard deviation (SD), * indicated p < .05, ** indicated p < .01, *** indicated p < .001, **** indicated p < .0001.
FIGURE 8
FIGURE 8
Schematic diagram of current study. Decreased expression of oestrogen receptor 1 (ESR1)/methyltransferase‐like 3 (METTL3) and increased adipogenesis ability in fibro/adipogenic progenitors (FAPs) was found in post‐menopausal female. METTL3‐mediated N6‐methyladenosine (m6A) methylation promoted ESR1 mRNA stability at the post‐transcriptional level in FAPs. METTL3‐mediated m6A modification promoted ESR1 expression by stabilising ESR1 mRNA, while ESR1 acted as a transcription factor that enhanced METTL3 transcription in turn. ESR1 also suppressed the transcription of the adipogenic transcription factor peroxisome proliferator‐activated receptor gamma (PPARγ), thereby inhibiting adipogenesis in FAPs. Reactivation of the METTL3–ESR1‐mediated loop by oestrogen alleviated excessive adipogenesis in FAPs from post‐menopausal women, and it also reduced muscular fatty infiltration, and improved locomotor function in ovariectomy (OVX) mice.

References

    1. Flores‐Opazo M, Kopinke D, Helmbacher F, et al. Fibro‐adipogenic progenitors in physiological adipogenesis and intermuscular adipose tissue remodeling. Mol Aspects Med. 2024;97:101277. - PMC - PubMed
    1. Jensen AR, Taylor AJ, Sanchez‐Sotelo J. Factors influencing the reparability and healing rates of rotator cuff tears. Curr Rev Musculoskelet Med. 2020;13(5):572‐583. - PMC - PubMed
    1. Vitale JA, Messina C, Albano D, et al. Appendicular muscle mass, thigh intermuscular fat infiltration, and risk of fall in postmenopausal osteoporotic elder women. Gerontology. 2021;67(4):415‐424. - PubMed
    1. Valencia AP, Lai JK, Iyer SR, et al. Fatty infiltration is a prognostic marker of muscle function after rotator cuff tear. Am J Sports Med. 2018;46(9):2161‐2169. - PMC - PubMed
    1. Yuri T, Nankaku M, Kawano T, et al. Evaluating the contribution of fat infiltration in anterior gluteus minimus muscle to walking ability in female with unilateral hip osteoarthritis and candidates for total hip arthroplasty. Clin Biomech (Bristol, Avon). 2023;103:105909. - PubMed

LinkOut - more resources