. 2025 Jan 28;13(1):5.
doi: 10.1186/s40170-025-00374-6.

Steatohepatitis-induced vascular niche alterations promote melanoma metastasis

Affiliations

Steatohepatitis-induced vascular niche alterations promote melanoma metastasis

Johannes Hoffmann et al. Cancer Metab. .

Abstract

Background: In malignant melanoma, liver metastases significantly reduce survival, even despite highly effective new therapies. Given the increase in metabolic liver diseases such as metabolic dysfunction-associated steatotic liver disease (MASLD) and metabolic dysfunction-associated steatohepatitis (MASH), this study investigated the impact of liver sinusoidal endothelial cell (LSEC)-specific alterations in MASLD/MASH on hepatic melanoma metastasis.

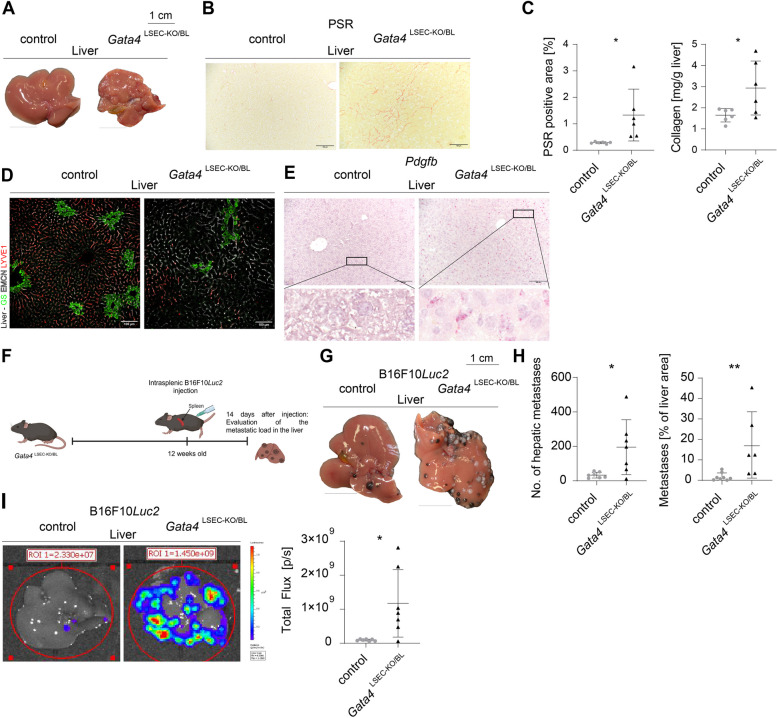
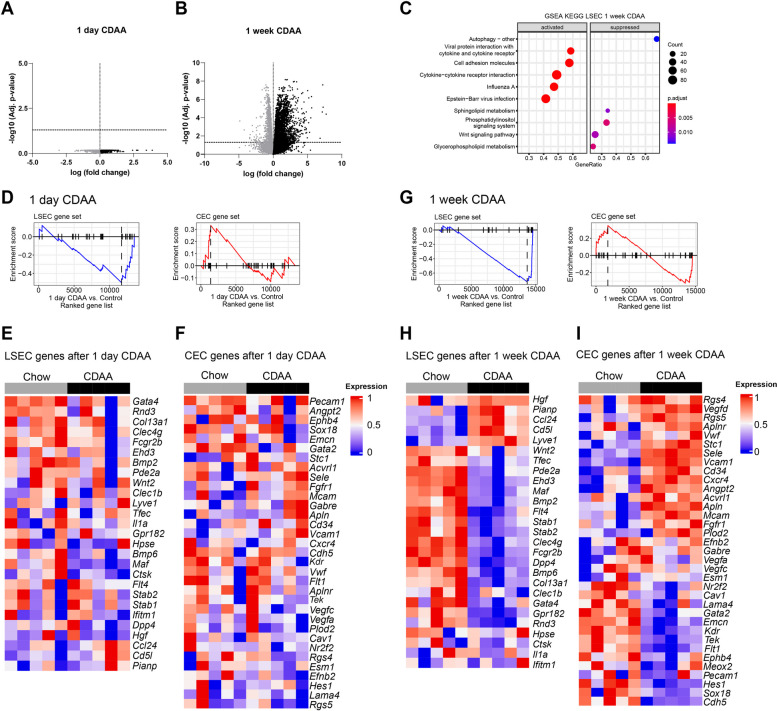
Methods: Mice were fed a choline-deficient L-amino acid-defined (CDAA) diet for ten weeks to induce MASH-associated liver fibrosis, or a CDAA diet or a high fat diet (HFD) for shorter periods of time to induce early steatosis-associated alterations. Liver metastasis formation was assessed using melanoma cell lines B16F10Luc2 and Wt31. LSEC-specific GATA4 knockout mice (Gata4LSEC-KO/BL) developing MASH-like liver fibrosis without steatosis via a pathogenic angiocrine switch were included to compare the impact of liver fibrosis versus hepatic steatosis on hepatic melanoma metastasis. Bulk RNA-Seq of isolated LSECs from CDAA-fed and control mice was performed. Levels of adhesion molecules (VCAM1, ICAM1, E-selectin) were monitored, and ICAM1 and VCAM1 antibody therapy was employed.

Results: Feeding a CDAA diet, in contrast to a HFD, led to increased metastasis before the development of liver fibrosis. Gata4LSEC-KO/BL mice characterized by vascular changes ensuing perisinusoidal liver fibrosis without steatosis also exhibited increased metastasis. Early molecular alterations in the hepatic vascular niche, rather than fibrosis or steatosis, correlated with metastasis, as shown by LSEC dedifferentiation and upregulation of endothelial adhesion molecules. The metastatic process in CDAA-fed mice was also dependent on the respective melanoma cell lines used and on the route of their metastatic spread. ICAM1 inhibition, but not VCAM1 inhibition reduced melanoma cell retention.

Conclusion: We discovered that the hepatic vascular niche acts as a delicate sensor to even short-term nutritional alterations during the development of MASLD/MASH. The dynamic adaptations to the metabolic challenges of developing MASLD/MASH caused an early shift from the normal hepatic vascular niche to a pre-metastatic vascular niche that promoted hepatic melanoma metastasis in the context of cell-autonomous and acquired melanoma cell features. Altogether, our findings provide a potential avenue for angiotargeted therapies to prevent hepatic melanoma metastasis.

Keywords: Cutaneous malignant melanoma; Early vascular alterations; Hepatic metastasis; Liver sinusoidal endothelial cells; Metabolic dysfunction-associated steatohepatitis.


Conflict of interest statement

Declarations. Ethics approval and consent to participate: All animals received humane care in compliance with the Guide for the Care and Use of Laboratory Animals published by the National Academy of Sciences and the animal ethics committee of Baden Wuerttemberg (Regierungspraesidium Karlsruhe) approved all animal experiments. Consent for publication: Not applicable. Competing interests: The authors declare no competing interests.

Figures

Fig. 1
Fig. 1
Enhanced B16F10Luc2 and Wt31 melanoma metastasis formation after 10 weeks of CDAA diet. A Setup for metastasis formation in CDAA diet-induced MASH model after intrasplenic injection of B16F10Luc2 cells and assessment of metastatic burden 14 days later. B Macroscopic images of representative B16F10Luc2 metastatic livers of chow and CDAA groups (scale bars = 1 cm). C Counted hepatic metastasis (8 vs. 8, p = 0.0321, unpaired t-test); quantified metastatic percentage of whole liver area (5 vs. 7, p = 0.0130, unpaired t-test) and BLI measurement (photons/sec) (7 vs. 7, p = 0.0239, Mann–Whitney U test). D Total body weights (8 vs. 8, n.s., unpaired t-test), liver weights (8 vs. 8, p = 0.0193, unpaired t-test) and liver-to-body ratios (8 vs. 8, p = 0.0079, Mann–Whitney U test). E Setup for metastasis formation in CDAA diet-induced MASH model after intravenous injection (i.v.) of Wt31 cells and assessment of metastatic burden 19 days later. F Macroscopic images of representative Wt31 metastatic livers of chow and CDAA groups (scale bar = 1 cm). G Counted hepatic metastasis (6 vs. 5, p = 0.0045, Mann–Whitney U test), quantified metastatic percentage of whole liver area (6 vs. 5, p = 0.0027, unpaired t-test). H Total body weights (6 vs. 5, n.s., unpaired t-test), liver weights (6 vs. 5, p < 0.0001, unpaired t-test) and liver-to-body ratios (6 vs. 5, p = 0.0034, unpaired t-test)
Fig. 2
Fig. 2
Endothelial Gata4 deficiency causes hepatopathy and B16F10Luc2 melanoma cells produce more hepatic metastasis in Gata4LSEC−KO/BL. A Macroscopic liver phenotype (scale bars = 1 cm). B Picrosirius Red (PSR) staining (scale bars = 100 µm). C Quantification of PSR positive area (6 vs. 6, p = 0.047, unpaired t-test) and hydroxyprolin assay in mg collagen/gram liver tissue (6 vs. 6, p = 0.0377, unpaired t-test). D Immunofluorescence staining of glutamine synthetase (GS), Endomucin (EMCN) and Lymphatic vessel endothelial hyaluronan receptor 1 (LYVE1) (scale bars = 100 µm). E In situ hybridization of Pdgfb in mouse liver (scale bars = 100 µm). F Setup for B16F10Luc2 metastasis formation in Gata4LSEC−KO/BL mice. Metastatic burden was assessed 14 days after intrasplenic B16F10Luc2 injection. G Macroscopic images of representative B16F10Luc2 metastatic livers (scale bars = 1 cm). H Counted hepatic metastasis (8 vs. 7, p = 0.0357, unpaired t-test); quantified metastatic percentage of whole liver area (8 vs. 6, p = 0.0080, Mann–Whitney U test). I Left panel: ex vivo BLI of livers 14 days after cell injection. Scale: Min: 6 × 106 (p/sec/cm2/sr); Max: 1.1 × 108 (p/sec/cm.2/sr). Livers were set as regions of interest and BLI signals were displayed. Right panel: measured BLI signal 14 days post injection (8 vs. 7, p = 0.0279, unpaired t-test)
Fig. 3
Fig. 3
B16F10Luc2 melanoma cells produce more hepatic metastasis after shorter CDAA feeding periods. A Setup for B16F10Luc2 metastasis formation after shorter feeding periods of 1 day, 1, 2 and 4 weeks of CDAA diet. Metastatic burden was assessed 14 days after intrasplenic B16F10Luc2 injection and discontinuation of CDAA diet. B Macroscopic images of representative B16F10Luc2 metastatic livers of chow and CDAA groups (scale bars = 1 cm). C Counted hepatic metastasis (1 day, 7 vs. 8, n.s., Mann–Whitney U test; 1 week, 7 vs. 7, p = 0.0004, unpaired t-test; 2 weeks, 7 vs. 8, p = 0.009, unpaired t-test; 4 weeks, 8 vs. 7, p = 0.0002, unpaired t-test). D Quantified metastatic percentage of whole liver area (1 day, 7 vs. 8, n.s., Mann–Whitney U test; 1 week, 7 vs. 8, p = 0.0001, unpaired t-test; 2 weeks, 7 vs. 8, p = 0.0152, Mann–Whitney U test; 4 weeks, 7 vs. 6, p = 0.0012, Mann–Whitney U test). E Measured BLI signal 14 days post injection (1 day, 7 vs. 8, p = 0.0205, Mann–Whitney U test; 1 week, 8 vs. 7, p = 0.0225, unpaired t-test; 2 weeks, 7 vs. 8, p = 0.0294, unpaired t-test; 4 weeks, 8 vs. 7, p = 0.0004, unpaired t-test)
Fig. 4
Fig. 4
No differences in Wt31 hepatic metastasis formation metastasis after shorter CDAA feeding periods. A Setup for Wt31 metastasis formation after shorter feeding periods of 1 day, 1, 2 and 4 weeks of CDAA diet. Metastatic burden was assessed 19 days after intravenous Wt31 injection and discontinuation of CDAA diet. B Macroscopic images of representative Wt31 metastatic livers of chow and CDAA groups (scale bars = 1 cm). C Counted hepatic metastasis (1 day, 4 vs. 5, n.s., unpaired t-test; 1 week, 4 vs. 5, n.s., Mann–Whitney U test; 2 weeks, 5 vs. 8, n.s., unpaired t-test; 4 weeks, 5 vs. 5, n.s., unpaired t-test). D Quantified metastatic percentage of whole liver area (1 day, 5 vs. 6, n.s. unpaired t-test; 1 week, 4 vs. 5, n.s., Mann–Whitney U test; 2 weeks, 7 vs. 8, n.s., Mann–Whitney U test; 4 weeks, 5 vs. 5, n.s., unpaired t-test)
Fig. 5
Fig. 5
Enhanced metastasis formation is not observed after shorter high fat diet feeding periods. A Setup for B16F10Luc2 metastasis formation after HFD feeding periods of 2 and 4 weeks. Metastatic burden was assessed 14 days after intrasplenic B16F10Luc2 injection and discontinuation of HFD. B Macroscopic images of representative B16F10Luc2 metastatic livers of chow and HFD groups (scale bars = 1 cm). C Counted hepatic metastasis (2 weeks, 5 vs. 6, p = 0.0303, unpaired t-test; 4 weeks, 8 vs. 7, n.s., Mann–Whitney U test); quantified metastatic percentage of whole liver area (2 weeks, 5 vs. 6, n.s., Mann–Whitney U test; 4 weeks, 8 vs. 7, n.s., Mann–Whitney U test). D Measured BLI signal 14 days post injection (2 weeks, 5 vs. 6, n.s., Mann–Whitney U test; 4 weeks, 8 vs. 7, n.s., Mann–Whitney U test). E Body weights, liver weights, and liver-to-body ratios (2 weeks, 5 vs. 6, n.s., unpaired t-test; 4 weeks, 8 vs. 7, n.s., unpaired t-test, 4 weeks liver weight: Mann–Whitney U test)
Fig. 6
Fig. 6
Transcriptomic analyses of isolated LSEC after 1 day and 1 week of CDAA diet (n = 5). A Volcano plot of all genes regulated after 1 day CDAA. Horizontal dashed line: significant cut off (-log(0.05)), vertical dotted line: log(fold change) = 0. Black dots are positive regulated genes, grey dots are negative regulated genes. B Volcano plot of all genes regulated after 1 week CDAA. Horizontal dashed line: significant cut off (-log(0.05)), vertical dotted line: log(fold change) = 0. Black dots are positively regulated genes, grey dots are negatively regulated genes. C GSEA KEGG pathway alterations analyzed using MSigDB hallmark gene sets in isolated LSEC after 1 week of CDAA diet. (D-I) LSEC and CEC associated genes are listed in Supplemental Table 1. D Enrichment plots of LSEC-associated (Normalized enrichment score (NES): −1,7; p.adjust: 0.026) and CEC-associated (NES: 1,2; p.adjust: 0.196) genes in isolated LSEC after 1 day of CDAA diet. E Graphical representation of the LSEC gene in a heat map after 1 day CDAA diet. The colour value indicates the expression level. Gene names are shown in italics. F Graphical representation of the CEC gene in a heat map after 1 day CDAA diet. The colour value indicates the expression level. Gene names are shown in italics. G Enrichment plots of LSEC-associated (Normalized enrichment score (NES): −2,4; p.adjust: 4,27 × 10–07) and CEC-associated (NES: 1,12; p.adjust:0,282) genes in isolated LSEC after 1 week of CDAA diet. H Graphical representation of the LSEC gene in a heat map after 1 week CDAA diet. The colour value indicates the expression level. Gene names are shown in italics. I Graphical representation of the CEC gene in a heat map after 1 week CDAA diet. The colour value indicates the expression level. Gene names are shown in italics
Fig. 7
Fig. 7
Endothelial cell adhesion molecules are upregulated during early phases of CDAA diet. A Heatmap of significantly 13 down- and 27 up-regulated genes in isolated LSEC after one week of CDAA diet (see Supplemental Table 2). B-E Immunofluorescence (IF) staining and fluorescence in situ hybridisation (FISH) (left side) and quantification (right side) of adhesion molecules and LSEC marker in mouse livers after 1 week of CDAA diet, n = 4, scale bars = 100 µm. B IF staining of ICAM1 (p = 0.0184, unpaired t-test), LYVE1 and EMCN (p = 0.0307, unpaired t-test). C IF staining of VCAM1 (p = 0.034, unpaired t-test) and LYVE1 (p = 0.003, unpaired t-test). D FISH staining of Cdh5 (n.s., unpaired t-test) and Sele (p = 0.0273, unpaired t-test). E IF staining of PODXL (n.s., unpaired t-test) and Stab2 (p = 0.0103, unpaired t-test)
Fig. 8
Fig. 8
B16F10Luc2 melanoma cells display a stronger intrahepatic retention after CDAA diet. A Setup for B16F10Luc2 cell retention assay after 1 day, 1, 2 and 10 weeks of CDAA diet. B Ex vivo BLI of livers 90 min after cell injection. Scale: Min: 7 × 104 (p/sec/cm2/sr); Max: 8 × 106 (p/sec/cm2/sr). Livers were set as ROI and BLI signals were displayed. C Quantification of BLI signals in livers (1 day, 8 vs. 8, p = 0.0094, unpaired t-test; 1 week, 8 vs. 8, p = 0.0012, unpaired t-test; 2 weeks, 8 vs. 8, p = 0.0027, unpaired t-test; 10 weeks, 7 vs. 6, p = 0.0461, unpaired t-test). D Ex vivo BLI quantification and images of livers 90 min after cell injection and 24 h after anti-VCAM1 antibody therapy. Scale: Min: 7 × 104 (p/sec/cm2/sr); Max: 1 × 106 (p/sec/cm2/sr). Livers were set as ROI and BLI signals were displayed (7 vs. 7, p = 0.2836, unpaired t-test). E Ex vivo BLI quantification and images of livers 90 min after cell injection and 24 h after anti-ICAM1 antibody therapy. Scale: Min: 7 × 104 (p/sec/cm2/sr); Max: 1 × 106 (p/sec/cm2/sr). Livers were set as ROI and BLI signals were displayed (7 vs. 7, p = 0.0258, unpaired t-test). F Representative scanning electron micrographs of liver sinusoids from chow and 1 day (n = 3) and 1 week (n = 5) CDAA-fed mice. Dashed lines show sinusoidal vessel wall contour in Chow and CDAA groups. Scale bars = 1 or 2 µm

References

    1. Garbe C, Peris K, Hauschild A, Saiag P, Middleton M, Spatz A, et al. Diagnosis and treatment of melanoma. European consensus-based interdisciplinary guideline--Update 2012. Eur J Cancer. 2012;48:2375–90. - PubMed
    1. Sandru A, Voinea S, Panaitescu E, Blidaru A. Survival rates of patients with metastatic malignant melanoma. J Med Life. 2014;7:572–6. - PMC - PubMed
    1. Belhocine TZ, Scott AM, Even-Sapir E, Urbain JL, Essner R. Role of nuclear medicine in the management of cutaneous malignant melanoma. J Nucl Med. 2006;47:957–67. - PubMed
    1. Patel JK, Didolkar MS, Pickren JW, Moore RH. Metastatic pattern of malignant melanoma. A study of 216 autopsy cases. Am J Surg. 1978;135:807–10. - PubMed
    1. Tumeh PC, Hellmann MD, Hamid O, Tsai KK, Loo KL, Gubens MA, et al. Liver Metastasis and Treatment Outcome with Anti-PD-1 Monoclonal Antibody in Patients with Melanoma and NSCLC. Cancer Immunol Res. 2017;5:417–24. - PMC - PubMed