. 2025 Jan 29;44(1):29.
doi: 10.1186/s13046-024-03271-w.

E. Coli cytotoxic necrotizing factor-1 promotes colorectal carcinogenesis by causing oxidative stress, DNA damage and intestinal permeability alteration

Affiliations

E. Coli cytotoxic necrotizing factor-1 promotes colorectal carcinogenesis by causing oxidative stress, DNA damage and intestinal permeability alteration

Michela Tozzi et al. J Exp Clin Cancer Res. .

Abstract

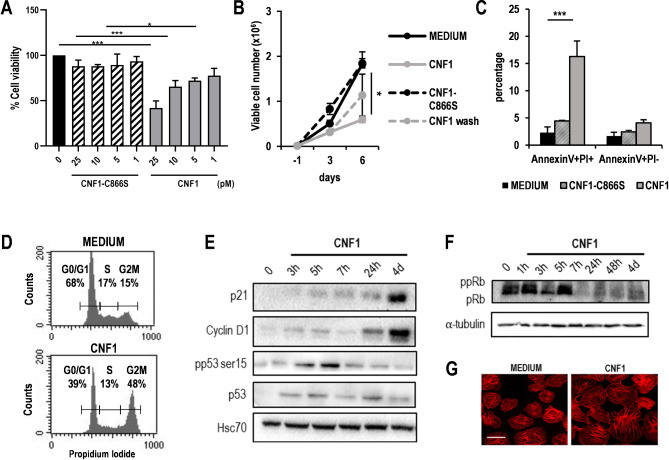
Background: Bacterial toxins are emerging as promising hallmarks of colorectal cancer (CRC) pathogenesis. In particular, Cytotoxic Necrotizing Factor 1 (CNF1) from E. coli deserves special consideration due to the significantly higher prevalence of this toxin gene in CRC patients with respect to healthy subjects, and to the numerous tumor-promoting effects that have been ascribed to the toxin in vitro. Despite this evidence, a definitive causal link between CNF1 and CRC was missing. Here we investigated whether CNF1 plays an active role in CRC onset by analyzing pro-carcinogenic key effects specifically induced by the toxin in vitro and in vivo.

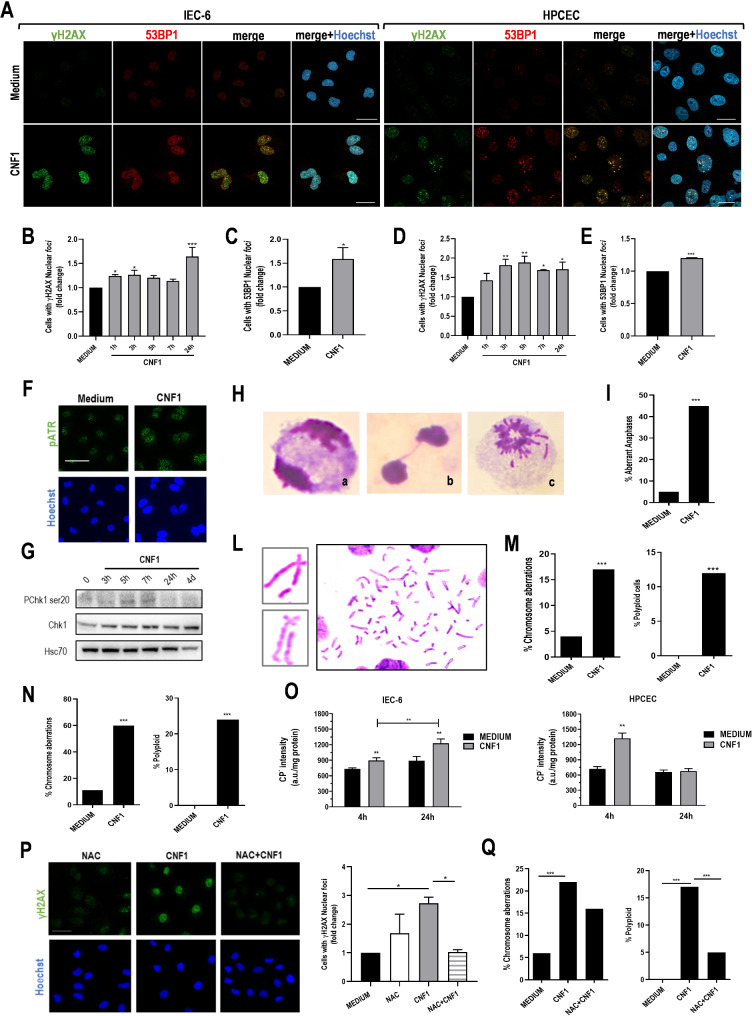
Methods: Viability assays, confocal microscopy of γH2AX and 53BP1 molecules and cytogenetic analysis were carried out to assess CNF1-induced genotoxicity on non-neoplastic intestinal epithelial cells. Caco-2 monolayers and 3D Caco-2 spheroids were used to evaluate permeability alterations specifically induced by CNF1, either in the presence or in the absence of inflammation. In vivo, an inflammatory bowel disease (IBD) model was exploited to evaluate the carcinogenic potential of CNF1. Immunohistochemistry and immunofluorescence stainings of formalin-fixed paraffin-embedded (FFPE) colon tissue were carried out as well as fecal microbiota composition analysis by 16 S rRNA gene sequencing.

Results: CNF1 induces the release of reactive oxidizing species and chromosomal instability in non-neoplastic intestinal epithelial cells. In addition, CNF1 modifies intestinal permeability by directly altering tight junctions' distribution in 2D Caco-2 monolayers, and by hindering the differentiation of 3D Caco-2 spheroids with an irregular arrangement of these junctions. In vivo, repeated intrarectal administration of CNF1 induces the formation of dysplastic aberrant crypt foci (ACF), and produces the formation of colorectal adenomas in an IBD model. These effects are accompanied by the increased neutrophilic infiltration in colonic tissue, by a mixed pro-inflammatory and anti-inflammatory cytokine milieu, and by the pro-tumoral modulation of the fecal microbiota.

Conclusions: Taken together, our results support the hypothesis that the CNF1 toxin from E. coli plays an active role in colorectal carcinogenesis. Altogether, these findings not only add new knowledge to the contribution of bacterial toxins to CRC, but also pave the way to the implementation of current screening programs and preventive strategies.

Keywords: 3D Caco-2 spheroids; CNF1; Colorectal cancer; DNA damage; Escherichia coli; Genotoxicity; Immune infiltrates; Inflammation; Intestinal permeability; Oxidative stress.


Conflict of interest statement

Declarations. Ethics approval: This study was carried out according to the European Guidelines for the Care and the Use for Laboratory Animals (authorization n° 787/21-PR). Consent for publication: Not applicable. Competing interests: The authors declare no competing interests.

Figures

Fig. 1
Fig. 1
CNF1 affects epithelial cell growth. (A) MTT assay of IEC-6 cells after 6 days of culture in the presence of scalar concentrations of CNF1 or CNF1-C866S. One representative experiment out of two is shown. (*p < 0.05; ***p < 0.001). (B) Trypan blue exclusion count of IEC-6 after 3 and 6 days of culture in the presence of the indicated concentrations of CNF1 or CNF1-C866S (N = 3). One representative experiment out of three is shown. (*p < 0.05 vs. CNF1-C866S and PBS). (C) Percentage of Annexin V and/or PI-positive cells after 6 days of culture in the presence of CNF1 or CNF1-C866S (25 ρM) (N = 3). One representative experiment out of three is shown. (***p < 0.001 vs. CNF1-C866S and PBS). (D) Histogram plot of the cell cycle distribution of untreated IEC-6 cells or IEC-6 cells exposed to 25 ρM CNF1 for 24 h. One representative experiment out of three is shown. (E) Western blot analysis of p21, Cyclin D1, p53 and phosphorylated p53 (pp53), in cell lysates from untreated and CNF1-treated IEC-6 cells at different time-points from treatment. One representative experiment out of two is shown. (F) Western blot analysis of the hypophosphorylated (pRB) and hyperphosphorylated (ppRB) forms of RB in cell lysates from untreated and CNF1-treated IEC-6 cells for the indicated times. (G) Representative fluorescence micrographs of F-actin staining in untreated and CNF1-treated IEC-6 24 h after treatment. Scale bar, 10 μm
Fig. 2
Fig. 2
CNF1 induces oxidative stress and genetic instability in intestinal epithelial cells. (A) Representative CLSM micrographs of IEC-6 and HPCEC cells stained with anti-γH2AX (green) and anti-53BP1 (red) antibodies. Nuclei were counterstained with Hoechst (blue). Scale bars, 10 μm. (B) Bar plot showing fold change of γH2AX-positive nuclei and (C) bar plot showing fold change of 53BP1-positive nuclei in IEC-6 cells at different time points following exposure to CNF1. (D) Bar plot showing fold change of γH2AX-positive nuclei and (E) bar plot showing 53BP1-positive HPCEC nuclei at different time points following exposure to CNF1. One hundred nuclei at each experimental point were counted. (*p < 0.05; **p < 0.01; ***p < 0.001). (F) Representative fluorescence micrographs of IEC-6 cells stained with anti-pATR (green). Nuclei were counterstained with Hoechst (blue). Scale bars, 10 μm. (G) Western blot analysis of Chk1 and its phosphorylated form at the indicated time points. (H) Representative micrographs of Giemsa-stained IEC-6 nuclei showing: (a) normal anaphase; (b) bridge and (c) circular nucleus. (I) Bar plot showing the percentage of aberrant anaphases in untreated and in CNF1-treated IEC-6. One hundred nuclei for each experimental condition were analysed (***p < 0.001). (L) Representative micrographs and (M) bar plot showing the percentage of chromosome aberrations and polyploid cells in nuclei metaphases of IEC-6 cells treated with CNF1 as compared to untreated cells. (N) Bar plot showing the percentage of chromosome aberrations and polyploid cells after further 48 h of culture in the absence of CNF1 toxin. Two hundred metaphases were counted for each experimental condition (***p < 0.001). (O) Bar plots showing ROS concentration measured by EPR spectroscopy in IEC-6 and HPCEC cells exposed to 25 ρM CNF1 or to medium as control. (P) Representative fluorescence micrographs and bar plot showing the relative γH2AX amount in IEC-6 cells pre-treated with the anti-oxidant NAC (10 M) before CNF1 exposure. Nuclei are stained with Hoechst (blue). Scale bar: 10 μm. (*p < 0.05). (Q) Percentage of chromosome aberrations and polyploid cells of IEC-6 cells pre-treated with the anti-oxidant NAC before CNF1 exposure. Two hundred metaphases were counted for each experimental condition (***p < 0.001)
Fig. 3
Fig. 3
CNF1 impairs gut barrier integrity. (A) Changes of Trans-Epithelial Electrical Resistance (TEER) in Caco-2 monolayers cultured for 21 days on 3 μm pore size inserts and exposed for the indicated times to CNF1 or CNF1-C866S (25 pM) or a conditioned medium (CM) from activated THP-1 cells or CM + CNF1. Data are expressed as percent TEER changes compared to the TEER value registered before treatment (day 0). N = 4. (*p < 0.05). (B) Mean fluorescence intensity (MFI) of ZO-1 expression in differentiated Caco-2 monolayers 24 h after the indicated treatments. N = 4. (***p < 0.001). (C) Representative micrographs from CLSM examinations (3D reconstruction images). Cell monolayers were stained with anti ZO-1 (green) and phalloidin (red) to visualize actin proteins. Nuclei are stained with DAPI (blue). Separate channels and merged images are shown. On the right, orthogonal projections of transverse ZX axis of the same image are reported. Scale bars, 20 μm. Images from one representative experiment out of three are shown
Fig. 4
Fig. 4
CNF1 alters 3D Caco-2 spheroids formation and disrupts cellular junctions. (A) Representative images from CLSM examinations (central optical sections and 3D reconstruction images). 3D Caco-2 spheroids were stained with anti-ZO-1 (green) and phalloidin (red) to visualize actin proteins. Nuclei are stained with DAPI (blue). Separate channels and merged images are shown. In the insert of control spheroids a higher magnification of ZO-1 distribution is shown. 3D reconstructions of the entire spheroids are reported on the right. Scale bars, 50 μm. Representative examples of 3 independent experiments are shown. (B) Representative scanning electron microscopy micrographs of Caco-2 spheroids grown in control medium, or in presence of CNF1 and CNF1-C866S toxins, showing their 3D overall spatial architecture comprehensive of the surface features. (C) Representative transmission electron microscopy micrographs of Caco-2 spheroids cultured in control medium, or in presence of CNF1 and CNF1-C866S toxins showing their internal ultrastrucural organization (TJ = tight junction; AJ = adherens junction; * Intercellular spaces)
Fig. 5
Fig. 5
Morphological analysis of colon tissue after three cycles of treatment. (A) Representative high-resolution colonoscopy images from the indicated treatment groups. Arrows indicate tumor lesions and mucosal thickening. (B) Boxplot depicting the disease score generated at colonoscopy. Center lines show the medians; box limits indicate the 25th and 75th percentiles; whiskers represent Min and Max values. (ns = non significant; *p < 0.05; **p < 0.01; ***p < 0.001). (C) H&E staining of FFPE colon sections: (a-c) Normal colonic tissue; (b-d) Higher magnification of pictures a-c; (e) Hyperplastic colonic mucosa thrown up in multifocal folds; (f) Higher magnification of picture (e) with evidence of mucosal thickening (arrows) and inflammatory infiltrates in the lamina propria (asterisk); (g) Hyperplastic mucosa and (h) higher magnification of the same sample; (i, k) focal intestinal crypt ectasia and moderate mixed inflammation within the lamina propria (asterisk) and the submucosa (arrowhead); (j) focal adenoma growing within and partially obliterating the intestinal lumen. (l) higher magnification of picture (j) showing focal new formed crypt ectasia (arrow), inflammation in the submucosa and lamina propria (asterisk) and multifocal crypt abscesses (arrowhead)
Fig. 6
Fig. 6
Colorectal tumorigenesis in DSS–treated mice after six cycles of i.r. CNF1 administration. (A) Representative high-resolution colonoscopy images from the indicated treatment groups (black square, PBS; grey square, CNF1; orange square, DSS; red square, CNF1+DSS). Arrow indicates a macroscopic tumor lesion. (B) Boxplot depicting the number of dysplastic aberrant crypt foci (ACF) in colon sections from the indicated treatment groups (N = 12 per group). Center lines show the medians; box limits indicate the 25th and 75th percentiles; whiskers represent Min and Max values. (*p < 0.05; ***p < 0.001). (C) Representative micrographs of H&E stained colonic sections: (a) Normal colon; (b) diffuse mild-to-moderate hyperplasia of mucosa; (c) diffuse moderate hyperplasia of the mucosa that is thrown up in folds (arrows). The lamina propria shows mild lymphoplasmacytic inflammation (LP); (d) adenoma with low grade atypia and a presence of ulceration (U) and diffuse mixed lymphoplasmacytic, histiocytic, neutrophilic (LPHN) inflammation. (D) Barplot indicating the distribution of the histopathological features of the colon tissue among the different treatment groups (N = 8 per group). (E) Representative micrographs of 53BP1 nuclear expression in colonic sections from the indicated treatment groups. (F) Boxplot depicting 53BP1 staining score. Center lines show the medians; box limits indicate the 25th and 75th percentiles; whiskers represent Min and Max values. (**p < 0.01; ***p < 0.001). (G) Barplots indicating gene expression by real-time PCR of the indicated cytokines in colon tissue. Data are expressed as mean ± SEM. (*p < 0.05; ** p < 0.01; ***p <0.001).   (H) Representative micrographs of double stained CD11b+ (light blue) and Ly6G+ (green) cells (i.e. neutrophils) in colonic sections from the indicated treatment groups analyzed by multiplex IF imaging. (I) Boxplot showing the density of neutrophils (CD11b + Ly6G+) in stroma and epithelium compartments of colon tissue from the indicated treatment groups (N = 7 per group). Center lines show the medians; box limits indicate the 25th and 75th percentiles; whiskers represent Min and Max values. (*p <0.05)
Fig. 7
Fig. 7
CNF1-induced modification of gut microbiota. Stacked barplots showing the mean relative abundance of gut bacterial phyla (A), families (B), genera (C) and species (D) 3 and 6 months after treatment. The “Others” category includes unknown bacteria and all other microbes whose mean relative abundance is less than 0.1% at phylum and family level, and 0.5% at genus and species level, respectively

References

    1. Bray F, Laversanne M, Sung H, Ferlay J, Siegel R, Soerjomataram I, Ahmedin J. Global Cancer statistics 2022: GLOBOCAN estimates of incidence and Mortality Worldwide for 36 cancers in 185 countries. CA. Cancer J Clin. 2024;74:229–63. 10.3322/CAAC.21834 - PubMed
    1. Gong Y, Liu Y, Wang T, Li Z, Gao L, Chen H, Shu Y, Li Y, Xu H, Zhou Z, et al. Age-Associated Proteomic signatures and potential clinically actionable targets of Colorectal Cancer. Mol Cell Proteom. 2021;20:100115. 10.1016/J.MCPRO.2021.100115 - PMC - PubMed
    1. Done JZ, Fang SH, Young-Onset. Colorectal Cancer: a review. World J Gastrointest Oncol. 2021;13:856–66. 10.4251/WJGO.V13.I8.856 - PMC - PubMed
    1. Wong SH, Yu J. Gut microbiota in Colorectal Cancer: mechanisms of action and clinical applications. Nat Rev Gastroenterol Hepatol. 2019;16:690–704. 10.1038/s41575-019-0209-8 - PubMed
    1. Wong CC, Yu J. Gut microbiota in Colorectal Cancer Development and Therapy. Nat Rev Clin Oncol. 2023;20:429–52. 10.1038/S41571-023-00766-X - PubMed

Substances

LinkOut - more resources