. 2025 Jan 28;44(1):28.
doi: 10.1186/s13046-024-03247-w.

Allogeneic DNT cell therapy synergizes with T cells to promote anti-leukemic activities while suppressing GvHD

Affiliations

Allogeneic DNT cell therapy synergizes with T cells to promote anti-leukemic activities while suppressing GvHD

Jongbok Lee et al. J Exp Clin Cancer Res. .

Abstract

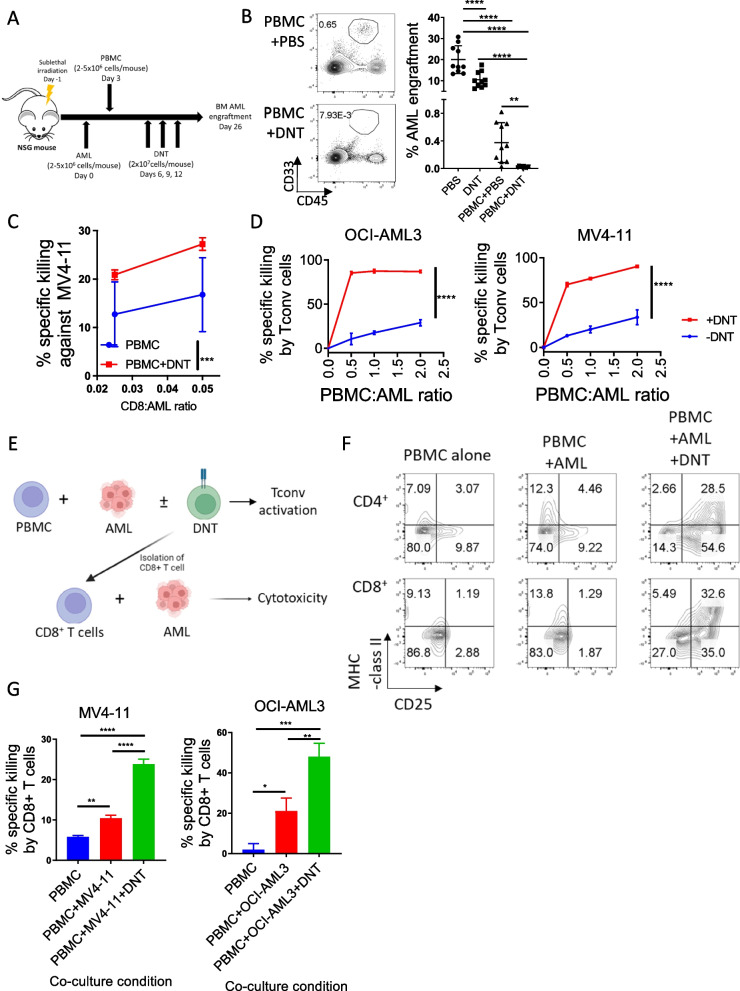
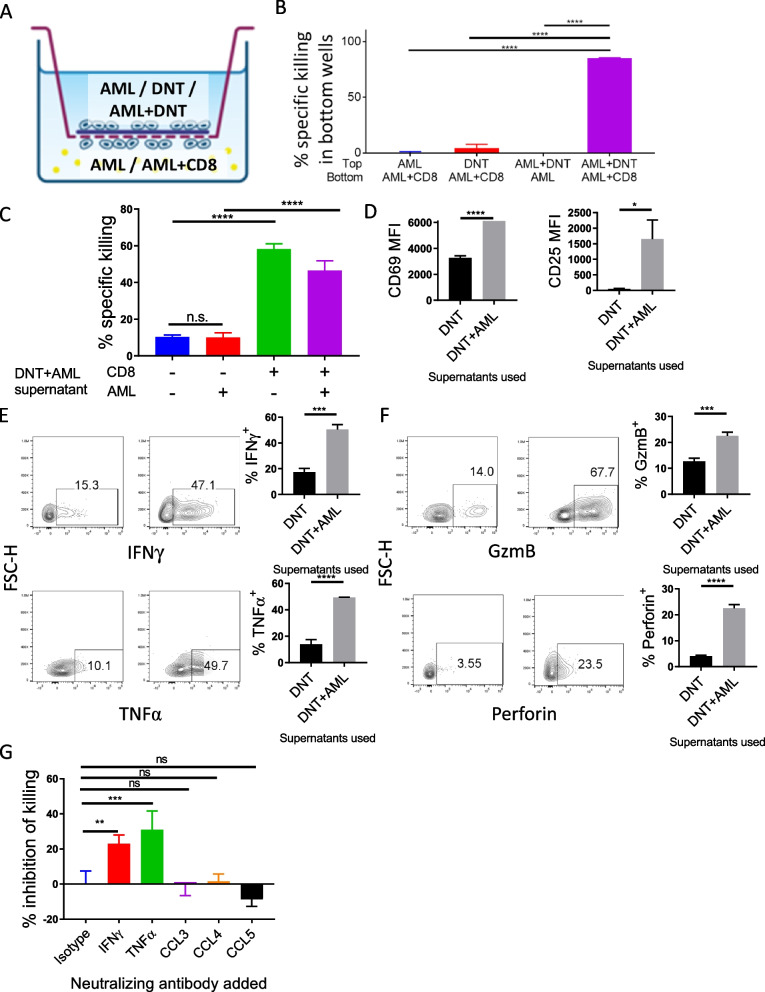
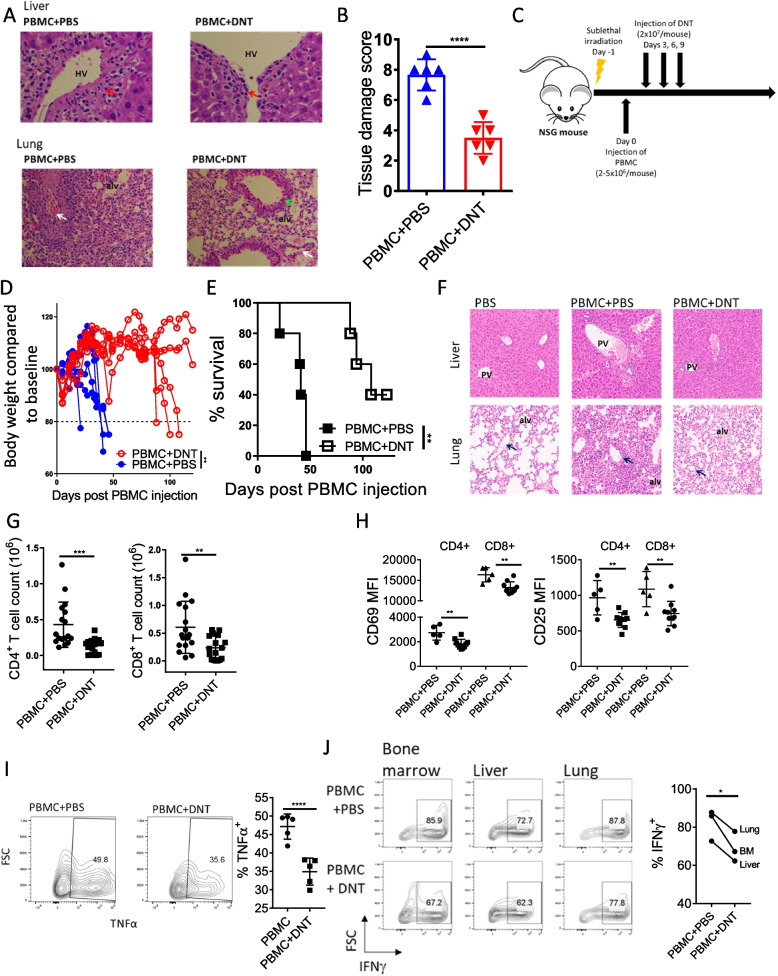
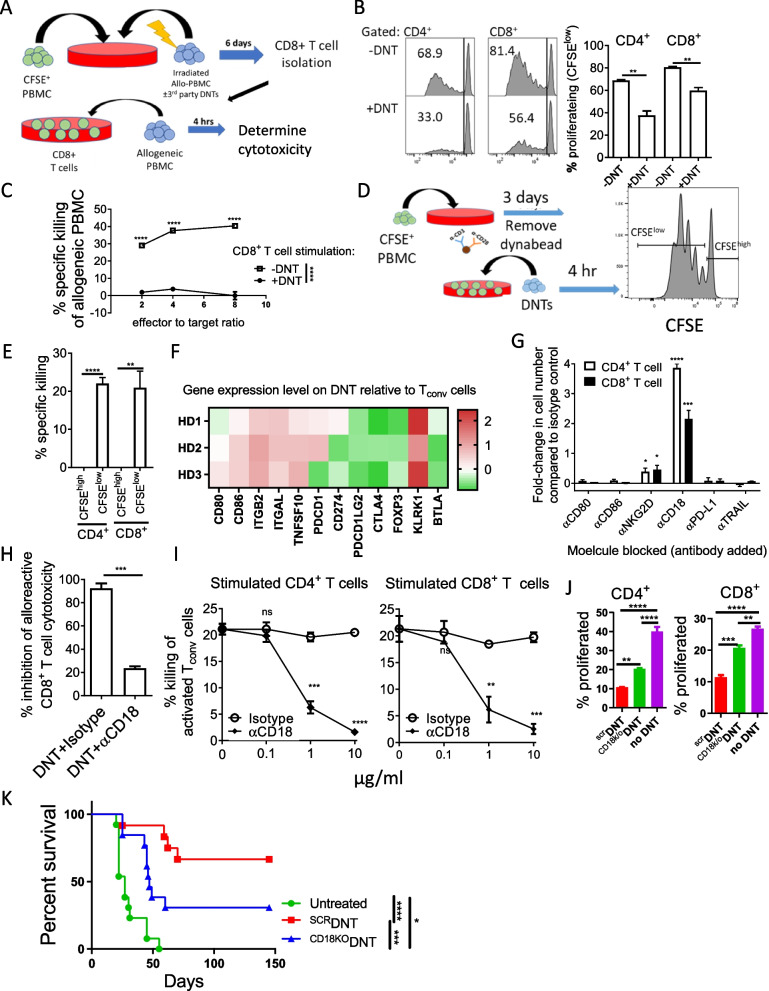
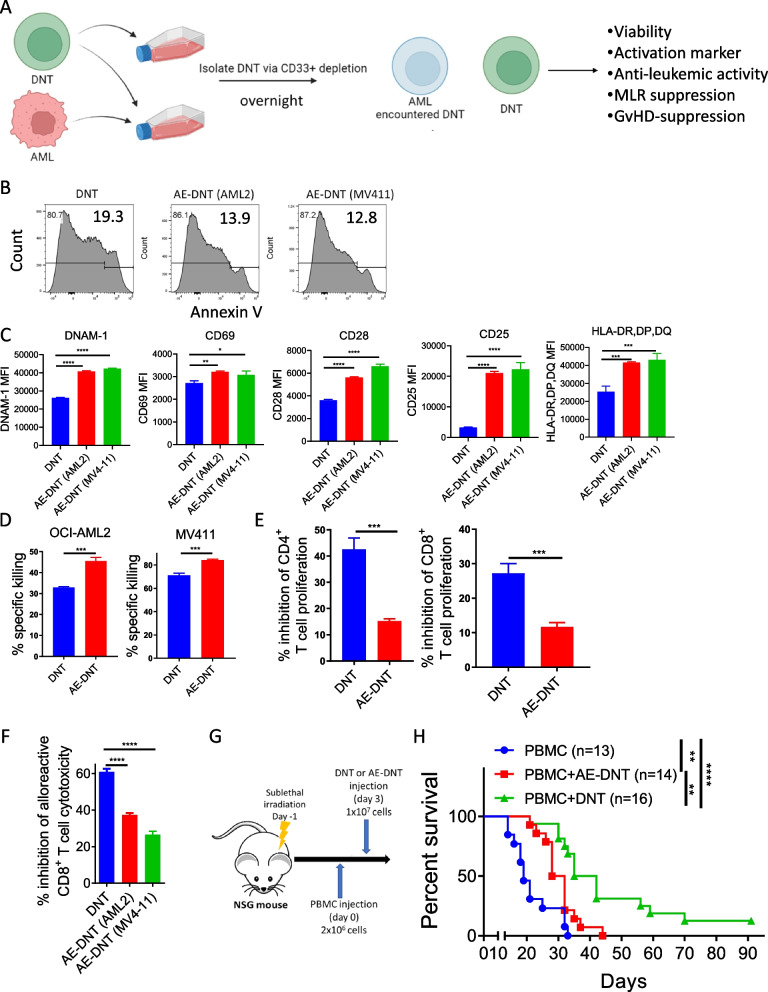
Allogeneic hematopoietic stem cell transplantation (allo-HSCT) is a second-line treatment with curative potential for leukemia patients. However, the prognosis of allo-HSCT patients with disease relapse or graft-versus-host disease (GvHD) is poor. CD4+ or CD8+ conventional T (Tconv) cells are critically involved in mediating anti-leukemic immune responses to prevent relapse and detrimental GvHD. Hence, treatment for one increases the risk of the other. Thus, therapeutic strategies that can address relapse and GvHD are considered the Holy Grail of allo-HSCT. CD3+CD4-CD8- double-negative T cells (DNTs) are unconventional mature T cells with potent anti-leukemia effects with "off-the-shelf" potential. A phase I clinical trial demonstrated the feasibility, safety, and potential efficacy of allogeneic DNT therapy for patients with relapsing acute myeloid leukemia (AML) post-allo-HSCT. Here, we studied the impact of DNTs on the anti-leukemic and GvHD-inducing activities of Tconv cells. DNTs synergized with Tconv cells to mediate superior anti-leukemic activity. Mechanistically, DNTs released soluble factors which activated and evoked potent anti-leukemic activities of Tconv cells. In contrast, DNTs suppressed GvHD-inducing activities of Tconv cells in a CD18-dependent manner by mediating cytotoxicity against proliferative Tconv cells. The seemingly opposite immunological activities of DNTs were dictated by the presence or absence of AML cells. Collectively, these results support the potential of DNTs as an adjuvant to allo-HSCT to address both disease relapse and GvHD.

Keywords: Allogeneic hematopoietic stem cell transplantation; Donor lymphocyte infusion; Double negative T cell; Graft-versus-host disease; Graft-versus-leukemia.


Conflict of interest statement

Declarations. Consent for publication: All of the authors concur with the submission of this manuscript. Competing interests: L.Z. has financial interests (e.g., holdings/shares) in WYZE Biotech Co Ltd and previously received research funding and consulting fee/honorarium from the Company. L.Z., J.B.L and H.K. are inventors of several patents related to DNT cell technology, and L.Z. received license fees. The remaining authors declare no conflict of interest.

Figures

Fig. 1
Fig. 1
DNTs promote anti-leukemic activity of Tconv cells. A, B Schematic of xenograft model used to assess the effect of DNTs on GVL (A). Sublethally-irradiated NSG mice were systemically administered with human AML cell line, MV4-11, followed by treatment with PBS or human PBMC 3 days post-leukemic cell infusion. Subsequently, mice were treated with ex vivo expanded DNTs or PBS on days 6, 9, and 12 post-leukemia infusion, and bone marrow AML engraftment was determined 26 days post-AML infusion. Flow plots show the representative bone marrow engraftment of human CD45+ CD33+ MV4-11 cells in mice treated with PBS, DNTs, PBMC + PBS or PBMC + DNT. Dot plots show the AML bone marrow engraftment with each dot representing an individual mouse and horizontal bar representing the mean. The results are a summary of 2 independent experiments with n = 10 for each group. One-way ANOVA test was used for statistical analysis (B). Horizontal bar represents the mean of BM AML engraftment level normalized to PBS control group, each symbol represents individual mouse, and error bars represent SEM. C The anti-leukemic activity of CD8+ T cells isolated from PBMC + PBS and PBMC + DNT group were compared in an ex vivo killing assay against the initial AML cells, MV4-11, used for engraftment. The cells were incubated at the indicated CD8+ T cell-to-MV4-11 cell ratio for 4-h. The result shown is representative of 3 independent experiments done using T cells from 3 different donors. The symbols represent the mean and the error bars represent SD. D AML cell lines, OCI-AML3 (left) and MV4-11 (right), were cultured with PBMC-derived Tconv cells at the indicated ratio in the presence or absence of DNTs at 0.2:1 DNT:AML ratio. AML cells alone or AML cells with DNTs at 0.2:1 ratio were used as controls to account for baseline AML cell death. After an overnight incubation, the percent specific killing of AML cells by Tconv cells in the presence or absence DNTs were determined by flow cytometry. The experiments were done in triplicates and the results shown are representative of two independent experiments for each AML cell line. EG Schematic diagram of in vitro experiments assessing the impact of DNTs on the anti-leukemic activity of CD8+ T cells E. Expression of activation markers CD25 and MHC-class II on CD4+ and CD8+ T cells measured by flow cytometry are shown. The result shown is representative of two independent experiments done using two PBMC-DNT pairs F. PBMCs were cultured alone or with MV4-11 cells or MV4-11 cells + DNTs for 3 days. Subsequently, CD8+ T cells were isolated and used as effector cells against MV4-11 cells in subsequent 4-h in vitro cytotoxicity assays at 1-to-1 CD8+ T cell-to-MV4-11 cell ratio. % specific killing of MV4-11 cells by CD8+ T cells from each group are shown. The experiments were done in triplicates, and the result shown is representative of three independent experiments conducted using three PBMC-DNT pairs. One-way ANOVA test was used for statistical analysis G. *p < 0.05; **p < 0.01; ***p < 0.001; ****p < 0.0001
Fig. 2
Fig. 2
DNTs promote the anti-leukemic activities of Tconv cells through releasing soluble factors. A and B Schematic diagram of transwell assays conducted to assess the role of soluble factors in DNT-induced anti-leukemic activity of CD8+ T cells (A). AML (MV4-11), DNTs, or AML + DNTs were seeded in the top wells and AML or AML + CD8+ T cells were seeded in the bottom wells, separated by a permeable membrane. % specific killing of AML cells in the bottom wells were determined by flow cytometry. Experiments were conducted in triplicates and the result shown is representative of two independent experiments. One-way ANOVA test was used for statistical analysis. ****p < 0.0001. C CD8+ T cells, MV4-11 cells, or both were treated with supernatants taken from DNT + MV4-11 co-culture (DNT+AMLsupernatant). Subsequently, the cells were cocultured at 1:1 effector-to-target ratio for 4-h. % specific killing of AML cells by CD8+ T cells are shown. Experiments were conducted in triplicates and the result shown is representative of three independent experiments. One-way ANOVA test was used for statistical analysis. ****p < 0.0001. D-F CD8+ T cells treated with DNT+AMLsupernatant or DNTsupernatant for 1 day were cultured with MV4-11 cells. Subsequently, the expression of activation markers, CD69 and CD25 (D), inflammatory cytokines, IFNγ and TNFα (E), and effector molecules, granzyme B (gzmB) and perforin (F), by CD8+ T cells were determined by flow cytometry. Flow plots show the representative result. The bar graphs show the average MFI (C) or % expressed (D and E) from three separate experiments ± SEM. Student’s t-test was used for statistical analysis. G CD8+ T cells cultured with MV4-11 cells in DNT+AMLsupernatant in the presence of blocking antibodies against IFNγ, TNFα, CCL3, CCL4, or CCL5 or an isotype control. Subsequently, % inhibition of CD8+ T cell mediated killing against MV4-11 cells was determined by flow cytometry. The experiments were done in triplicates and the result shown is representative of three independent experiments. One-way ANOVA test was used for statistical analysis. **p < 0.01; ***p < 0.001
Fig. 3
Fig. 3
DNTs attenuate GvHD caused by Tconv cells. A and B NSG mice inoculated with AML cell line MV4-11 were treated with PBMCs + PBS or PBMCs + DNT. On day 26 post-AML injection, liver and lung tissues were formalin-fixed and stained with H&E, as illustrated by the schematic diagram. Representative H&E-stained slides of the liver (400 × magnification) and lung (200 × magnification) from each group are shown. Red arrows indicate the sites of perivenular inflammation, white arrows indicate the vessels, and green arrows indicate bronchioles. HV – hepatic vein; alv – alveoli (A). Liver and lung H&E stained slides from PBMC + PBS and PBMC + DNT-treated groups were blindly scored by a pathologist for the degree of tissue damage. Each dot represents a sample, and horizontal bars represent the mean ± SD. Student’s t-test was used for statistical analysis (B). Data shown are representative of 2 independent experiments. ****p < 0.0001. C-F Schematic diagram of the PDX model used to determine the GvHD-suppressive activity of DNTs in vivo. Sub-lethally irradiated NSG mice were intravenously injected with 2–5 × 106 human PBMC followed by treatment with ex vivo expanded allogeneic DNTs or PBS on days 3, 6, and 9 post-PBMC infusion (C). Mouse body weight was measured twice a week until the end of the study on day 120, and each line represents an individual mouse % body weight change (D), and mice survival (E) was monitored. Two-way ANOVA test (D) and log-rank test (E) were used for statistical analysis. On day 28, liver (top) and lung (bottom) tissues were stained with hematoxylin and eosin (H&E) (50 × magnification). Blue arrows indicate the vessels. PV – portal vein; alv – alveoli (F). The data shown are representative from each treatment group (PBS, PBMC + PBS, and PBMC + DNT; n = 5 per group) and are representative of 3 independent experiments using T cells from 3 different donors. G and H Total number (G) and the expression of activation markers (H), CD69 and CD25, on CD4+ or CD8+ T cells obtained from the liver of leukemia-engrafted mice treated with PBMC + PBS or PBMC + DNT DNT (n = 17 for each group for counts; n = 5–10 for CD69 and CD25 expression). Each dot represents one mouse, horizontal bars represent the mean, and error bars represent ± SD. The result shown is representative of 2 independent experiments. Student’s t-tests was used for statistical analysis. **p < 0.01; ***p < 0.001. I Intracellular expression of TNFα on CD8+ T cells obtained from the bone marrow of leukemia-engrafted mice treated with PBMC + PBS or PBMC + DNT. Contour flow plots show the representative expression from each treatment group. Each dot represents one mouse, horizontal bars represent the mean, and error bars represent ± SD. The results shown are representative of 3 biological replicates from 2 independent experiments. Student’s t-tests were used for statistical analysis. ****p < 0.0001. J BM, liver, and lung tissues from each group were pooled (n = 5 per group), and Tconv cells were harvested, and ex vivo stimulated with αCD3/CD28 activation beads for 4 h. Subsequently, intracellular expression of IFNγ on the harvested Tconv cells was determined. Each paired dot represents the Tconv cells from lung, BM, or liver. The results shown is representative of 2 biological replicates. Student’s t-tests was used for statistical analysis. *p < 0.05
Fig. 4
Fig. 4
DNTs suppress GvHD in an CD18 dependent manner. A-C Schematic diagram of mixed-lymphocyte reaction (MLR) assay conducted to assess the impact of DNTs on the alloreactivity of Tconv cells (A). CFSE-labelled PBMCs were stimulated with irradiated allo-PBMCs with or without DNTs for 6 days. Proliferation of Tconv cells was determined by CFSE dilution (B). After stimulation, CD8+ T cells were isolated and used as effector cells against the same allogeneic PBMCs initially used for stimulation. Percent killing of allogeneic CD4+ and CD8+ T cells by CD8+ T cells stimulated in the presence (●) or absence (□) of DNTs at varying effector to target ratio is shown (C). The result shown is representative of five independent experiments using 5 different T cell-PBMC pairs. Two-way ANOVA test was used for statistical analysis. **p < 0.01. D and E In vitro cytotoxicity of DNTs against proliferating and non-proliferating Tconv cells. CFSE-labeled PBMCs were stimulated with αCD3/αCD28 activation beads for 3 days. After removal of the beads, stimulated Tconv cells were co-cultured with DNTs for 4 h at 4:1 DNT:Tconv ratio (D). The bar graph shows the percent specific killing mediated by DNTs against proliferating (CFSEhigh) and non-proliferating (CFSElow) CD4+ or CD8+ T cells (E). The result is representative of 3 independent experiments done using T cells from 3 different donors. Student’s t-tests was used for statistical analysis. Error bars represent ± SD. **p < 0.01; ****p < 0.0001. F RNAseq to determine the expression levels of genes involved in regulation of immune cell activation on ex vivo expanded DNTs relative to Tconv cells expanded in parallel from the same donors (n = 3). G CFSE-labeled (1 µM) Tconv cells were stimulated with αCD3/CD28 activation beads in the presence or absence of DNTs. Antibodies against molecules indicated or corresponding isotype control (10 µg/ml) at 4:1 DNT:Tconv cell ratio were added for 5 days. Numbers of CD4+ (empty bar) and CD8+ (filled bar) T cells at the end of the suppression assays in the presence of various blocking antibody relative to their isotype control were determined. The result shown is mean of 3 independent experiments for each molecule done using T cells from 2–3 different donors. Student’s t-tests were used for statistical analysis. *p < 0.05; **p < 0.01; ***p < 0.001; ****p < 0.0001. H MLR assays were set up as described in Fig. 4A in the presence of blocking antibody against CD18 (10µg/ml) or corresponding isotype control. The percentage inhibition of alloreactive CD8+ T cell activity by DNTs is shown. Student’s t-test was used for statistical analysis. ***p < 0.001. I In vitro killing assays were conducted using DNTs against activated PBMCs, as described in Fig. 4D, with increasing concentrations of CD18 blocking antibody (filled) or isotype control (empty). % specific killing against CD4+ T cells (left) and CD8+ T cells (right) are shown. The results shown are representative of 3 independent experiments using T cells from 2 different donors. One-way ANOVA test was used for statistical analysis. **p < 0.01; ***p < 0.001; ****p < 0.0001. J In vitro suppression assays were conducted using CD18KODNTs or scrDNT against Tconv cells stimulated with irradiated allogeneic PBMC at 4:1 DNT to PBMC ratio. % proliferated CD4+ (left) and CD8+ (right) T cells are shown. The results shown are representative of 2 independent experiments using T cells from 2 different donors. **p < 0.01; ***p < 0.001; ****p < 0.0001. K Sub-lethally irradiated NSG mice were intravenously injected with 2 × 106 human PBMC followed by treatment with PBS (n = 13), 1.5 × 107 scrDNT (n = 12), or 107 1.5 × CD18KODNTs (n = 13) on days 3 and 6 post-PBMC infusion, and the mice survival was monitored. Log-rank test was used for statistical analysis. The results are pooled from 2 independent experiments using T cells from 2 different donors. *p < 0.05; ***p < 0.001; ****p < 0.0001
Fig. 5
Fig. 5
DNTs show reduced immunosuppressive activities in the presence of AML cells. A-F Schematic diagram of the experiments done to compare the anti-leukemic and immunosuppressive activities of DNTs and AE-DNTs (A). DNTs were cultured alone or with AML cell lines, MV4-11 or OCI-AML2, overnight. Subsequently, the viability (B), activation markers, DNAM-1, CD69, CD28, CD25, and HLA-DR,DP,DQ, (C) of DNT and AE-DNTs, their ability to mediate cytotoxicity against AML cells (D), to inhibit proliferation of Tconv cells against irradiated allo-PBMC (E), or suppress the alloreactivity of CD8+ T cells (F) were compared. Each experiment was done in triplicates, and the results shown are representative of three independent experiments. One-way ANOVA (C and F) or Student’s t-tests (D and E) were used for statistical analysis. *p < 0.05; **p < 0.01; ***p < 0.001; ****p < 0.0001. G and H Schematic diagram of GvHD-xenograft model used to assess the GvHD-suppressive activity of AE-DNTs (G). Sublethally irradiated NSG mice were infused with 2 × 106 PBMCs alone (n = 15) or with 107 DNT (n = 15) or AE-DNTs (n = 16). Mice survival was monitored. The graph shown is pooled result from three independent experiments. Log-rank test was used for statistical analysis. **p < 0.01; ****p < 0.0001

References

    1. Dohner H, Weisdorf DJ, Bloomfield CD. Acute myeloid leukemia. N Engl J Med. 2015;373:1136–52. 10.1056/NEJMra1406184. - PubMed
    1. Ho VT. The history and future of T-cell depletion as graft-versus-host disease prophylaxis for allogeneic hematopoietic stem cell transplantation. Blood. 2001;98:3192–204. 10.1182/blood.V98.12.3192. - PubMed
    1. Choi SW, Reddy P. Current and emerging strategies for the prevention of graft-versus-host disease. Nat Rev Clin Oncol. 2014;11:536–47. 10.1038/nrclinonc.2014.102. - PMC - PubMed
    1. Horowitz MM, Gale RP, Sondel PM, Goldman JM, Kersey J, Kolb HJ, Rimm AA, Ringden O, Rozman C, Speck B, et al. Graft-versus-leukemia reactions after bone marrow transplantation. Blood. 1990;75:555–62. - PubMed
    1. Rautenberg C, Germing U, Haas R, Kobbe G, Schroeder T. Relapse of acute myeloid leukemia after allogeneic stem cell transplantation: prevention, detection, and treatment. Int J Mol Sci. 2019;20:228. 10.3390/ijms20010228. - PMC - PubMed

MeSH terms

LinkOut - more resources