. 2025 May;104(5):561-571.
doi: 10.1177/00220345241304756. Epub 2025 Jan 28.

Molecular Profiling of Odontoclasts during Physiological Tooth Replacement

Affiliations

Molecular Profiling of Odontoclasts during Physiological Tooth Replacement

J I Henriquez et al. J Dent Res. 2025 May.

Erratum in

Abstract

The odontoclast is a rarely studied cell type that is overly active in many dental pathologies, leading to tooth loss. It is difficult to find diphyodont mammals in which either physiological or pathological root resorption can be studied. Here we use the adult leopard gecko, which has repeated cycles of physiological tooth resorption and shedding. RNA-seq was carried out to compare gene expression profiles of functional teeth to developing teeth. Genes more highly expressed in bell-stage developing teeth were related to morphogenesis (PTHLH, SFRP2, SHH, EDAR). Some genes expressed in osteoclasts (ACP5, CTSK, CSF1R) were relatively more abundant in functional teeth compared with developing teeth. There was, however, no differential expression of RANKL (TNFSF11) in the 2 tooth types. In addition, functional teeth expressed proteolysis genes not found in osteoclasts (ADAMTS2, 3, 4, 14; CTSA, CTSH, CTSS). We used tartrate acid resistant phosphatase and cathepsin K (CTSK) staining to identify odontoclasts in and around the gecko dentition. There were 3 populations of CTSK cells: (1) large, functional multinucleated odontoclasts in the crown of the tooth with a ruffled border inside resorption pits; (2) smaller, precursor cells in the pulp with fewer nuclei; and (3) flattened external precursor cells next to the root and bone of attachment. We found a positive relationship between developing teeth and the population of CTSK+ cells on the root surface. We tested a candidate signal that may be involved in CTSK+ cell presence. An antagonist of CSF1R was delivered to developing teeth in vivo, which resulted in a significant decrease in CTSK and CSF1R compared with DMSO controls. Thus, the CSF1 signaling pathway is upstream of CTSK in teeth. This is the first work to detail the molecular characteristics of odontoclasts during physiological tooth shedding and to demonstrate that in vivo, local drug delivery is possible in the gecko model.

Keywords: RNA-seq; cathepsin K; gecko; polyphyodonty; reptile; root resorption.


Conflict of interest statement

Declaration of Conflicting InterestsThe authors declared no potential conflicts of interest with respect to the research, authorship, and/or publication of this article.

Figures

Figure 1.
Figure 1.
Differential expression analysis of gecko functional and developing teeth. (A) Schematic of the removal of adult gecko maxillary functional and developing teeth for RNA sequencing. Multinucleated, clastic cells are in the pulp of functional teeth. (B, B′) Hematoxylin and eosin staining of extracted developing teeth. (C, C′) Proliferating cell nuclear antigen and Hoechst staining of near-adjacent sections. (D, D′) Pan-keratin staining shows epithelium surrounding, and the apical end of the crown is included. (E) Hierarchical cluster of functional and developing teeth samples based on Spearman correlation. Animals used in RNA-seq experiments include LGA, B, C. (F) Principal component analysis of samples. (G) Volcano plot of differential expression comparing developing to functional teeth determined by the hisat-Deseq2 pipeline. Red spots and negative values indicate genes more highly expressed in functional teeth; blue spots and positive values indicate genes more highly expressed in developing teeth. (H) Validation with quantitative reverse transcription polymerase chain reaction of genes differentially expressed in RNA-seq data. Unpaired t test. Error bars = mean ±95% confidence interval. ab, aboral; cl, cervical loops; la, labial; li, lingual; mes, mesenchyme; o, oral; pu, pulpal. Scale bar in B, C, and D = 500 µm. Scale bar for B′, C′, and D′ = 100 µm.
Figure 2.
Figure 2.
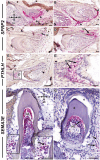
SFRP2, PTHLH, and SEMA3E expression in gecko teeth. Frontal sections of gecko jaws hybridized to RNAscope probes where the signal is chromogenically detected (pink) and sections are counterstained with hematoxylin. (A) SFRP2 expression around a tooth cap stage. (B) SFRP2 expression around a bell-stage tooth bud. (C) SFRP2 expression around the tip of the successional lamina. (D) SFRP2 surrounding the successional lamina. (E, E′) PTHLH expression in the stellate reticulum of a late bell-stage tooth. (F) SEMA3E expression in a sagittal section of a functional tooth with strong signal in the polarized odontoblasts synthesizing dentin. (F′) expression of SEMA3E in the interdental connective tissue. (G) A similar pattern is seen in a developing tooth with a strong signal in functional odontoblasts near the dentinoenamel junction. Expression in the connective tissue next to the tooth (arrows). Scale bars in A, B, C, D, E = 20 µm. Bar in E = 100 µm. Bars in F, G = 50 µm. ab, aboral; d, dentin; e, enamel space; li, lingual; la, labial; o, oral; od, odontoblast; sl, successional lamina.
Figure 3.
Figure 3.
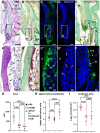
Histology and morphometry of clastic cells in the adult gecko dentition. Frontal sections of maxillary gecko teeth. (A–D′) Serial sections. (E, F) Sections from a different tooth family. (A, A′) The odontoblasts at the periphery of the pulp are replaced by odontoclasts that are in resorption pits (arrows). (B, B′) Odontoclasts express tartrate acid resistant phosphatase (TRAP), as do cells in the center of the pulp. (C, C′) Odontoclasts are positive for cathepsin K (CTSK) and are multinucleated in a split-channel view (white arrows, D, D′). (E, E′) TRAP+ cells that are flat are located apical to the functional teeth, between the developing tooth and bone. (F) Adjacent section to E showing that the flattened cells are CTSK+ (white arrows). (G) Average area of CTSK+ cells in 3 locations show the largest cells are in the resorption pits. (H) Higher values of aspect ratio indicate the cell is elongated. (I) Log10 of the number of nuclei per square micron in CTSK+ cells showed the cells inside resorption pits had significantly greater numbers of nuclei. P values determined with 1-way analysis of variance and Tukey’s post hoc test. Error bars = mean ± 95% confidence interval. Points on graph represent means of 3 teeth for 3 animals. Each tooth had a minimum of 3 cells analyzed in each of the three locations. See Appendix Table 8 for details. ab, aboral; boa, bone of attachment; d, dentin; la, labial; li, lingual; o, oral; oc, odontoclast. Scale bars in A, B = 200 µm. Scale bars in A′, B′ = 50 µm. Scale bars in C, D, E = 100 µm. Scale bars in C′, D′, F = 20 µm. Scale bar in E′ is 10 µm.
Figure 4.
Figure 4.
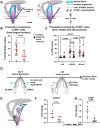
Effect of tooth removal and in vivo drug treatment on CTSK+ cells. (A) Measurement scheme for the distance along the bone surface occupied by CTSK+ cells. The total distance between the oral, crest of the bone, and the perpendicular palatine process divided into thirds. The distance occupied by CTSK+ cells was normalized to the length. (B) When measuring the percentage of the total surface occupied by CTSK there was no significant difference (unpaired t test). (C) In controls, the middle and aboral thirds had significantly more distance covered by CTSK than the oral third did. In regions with selective tooth removal, there was a significant decrease in the number of CTSK+ surface in the middle and aboral thirds but no change in the oral third. Two-way analysis of variance and the Benjamini, Krieger, and Yekutieli false discovery rate was used for multiple comparisons. (D) Schematic of experimental design in which BLZ945-soaked beads (20 mg/mL) were placed on one side and DMSO beads were placed on the contralateral side followed by tooth removals at 24 h. (E) Schematic showing the location of beads relative to developing teeth. (F, G) Quantitative reverse transcription polymerase chain reaction result showing significantly less CSF1R and CTSK expression after BLZ945 treatment (unpaired t test). ab, aboral; la, labial; li, lingual; mid, middle; o, oral. Error bars in B, C, F, and G are the ±95% confidence interval.

References

    1. Alyahya L, Myers GL. 2021. Denosumab use as a predictor variable for external cervical resorption: a case-control study. J Endod. 47(3):366–373. - PubMed
    1. Bertin TJC, Thivichon-Prince B, LeBlanc ARH, Caldwell MW, Viriot L. 2018. Current perspectives on tooth implantation, attachment, and replacement in amniota. Front Physiol. 9:1630. - PMC - PubMed
    1. Bjerklin K, Al-Najjar M, Karestedt H, Andren A. 2008. Agenesis of mandibular second premolars with retained primary molars: a longitudinal radiographic study of 99 subjects from 12 years of age to adulthood. Eur J Orthod. 30(3):254–261. - PubMed
    1. Brink KS, Henriquez JI, Grieco TM, Martin Del Campo JR, Fu K, Richman JM. 2021. Tooth removal in the leopard gecko and the de novo formation of replacement teeth. Front Physiol. 12:576816. - PMC - PubMed
    1. Brink KS, Wu P, Chuong CM, Richman JM. 2020. The effects of premature tooth extraction and damage on replacement timing in the green iguana. Integr Comp Biol. 60(3):581–593. - PMC - PubMed

Substances