

Changes in CD4+CD25HIGH T cells and TGFβ1 levels in different stages of adult-onset type 1 diabetes
- PMID: 39876913
- PMCID: PMC11771973
- DOI: 10.5937/jomb0-49868
Changes in CD4+CD25HIGH T cells and TGFβ1 levels in different stages of adult-onset type 1 diabetes
Abstract
Background: Previous studies suggested an important role of impairments in T cell subsets in different stages during type 1 diabetes (T1D) development, while data regarding CD25high T cells and transforming growth factor b1 (TGFβ1), both T regulatory associated, remains controversial. We analyzed the level of (a) CD25high T cells (b) TGFβ1 in 17 first-degree relatives of patients with T1D in stage 1 (FDRs1) (GADA+, IA-2+); 34 FDRs in stage 0 (FDRs0) (GADA, IA-2); 24 recent-onset T1D in insulin-requiring state (IRS); 10 patients in clinical remission (CR); 18 healthy, unrelated controls (CTR).
Methods: T cell subsets were characterized by two-color immunofluorescence staining and flow cytometry; TGFβ1 was determined by ELISA, GADA, and IA-2 by RIA.
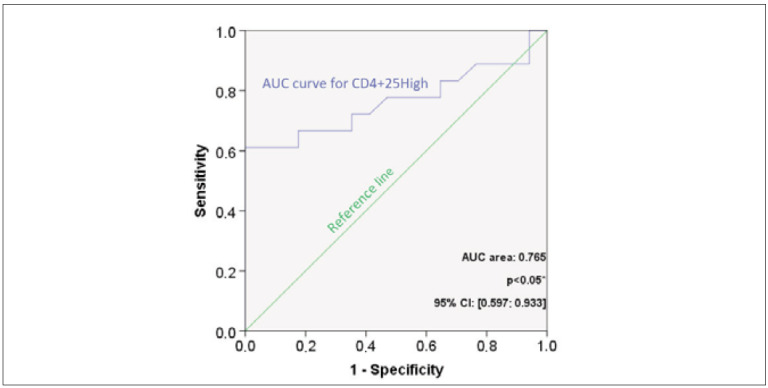
Results: The percentage of CD25high T cells in FDRs1 was lower than controls, FDRs0, IRS, and CR (p<0.001). Additionally, the cut-off value for CD25high = 1.19%, with a probability of 0.667, for having a higher risk for T1D. TGFβ1 concentration in FDRs1, FDRs0, IRS, and CR, was lower than controls (p<0.001). IRS has a higher TGFβ1 concentration than CR (p<0.001).
Conclusions: Stage 1, a higher risk for T1D, is characterized by decreases in CD25high T cells and TGFβ1, partially reflecting impaired T regulatory response, implying that changes of this T cells subset might be a risk marker for T1D. FDRs, irrespective of risk for T1D and T1D patients irrespective of state, had depletion of TGFβ1, suggesting the association of TGFβ1 could have potential with familiar risk and manifestation of T1D. Furthermore, the result suggested that the clinical course of overt T1D might be modulated on the TGFβ1 level.
Uvod: Prethodne studije su pokazale važnu ulogu poremećaja nivoa T ćelijskih subsetova u različitim stadijumima razvoja tipa 1 dijabetesa (T1D), dok su podaci vezani za CD25high T ćelije i transformišući faktor rasta b1 (transforming growth factor-TGFb1), koji parcijalno reflektuju T regulatorni odgovor, i dalje kontroverzni. Analizirali smo nivo (a) CD25high T ćelija (b) TGFb1 kod 17 prvih rođaka pacijenata sa T1D u stadijumu 1 (first-degree relatives of patients with T1D - FDRs1) sa povećanim rizikom za T1D, (GADA+, IA-2+); 34 FDRs u stadijumu 0 (FDRs0) (GADA, IA-2); 24 pacijenta sa novootkrivenim T1D u insulin-zavisnom stanju (insulin requiring state-IRS); 10 pacijenata u kliničkoj remisiji (CR); 18 zdravih kontrola (CTR).
Metode: Procenat CD4+CD25high T ćelija je analiziran metodom dvobojne imunofluorescencije i protočne citometrije, TGFb1 ELISA, GADA i IA-2 RIA metodom.
Rezultati: Procenat CD25high T ćelija u FDRs1 je niži u poređenju sa kontrolama, FDRs0, IRS i CR (p<0,001). Procenat CD25high T ćelija od 1,19%, sa verovatnoćom 0,667, prediktuje povećan rizik za T1D. Koncentracija TGFb1 u FDRs1, FDRs0, i oba stanja u T1D, IRS i CR, je niža u poređenju sa kontrolama (p<0,001).
Zaključak: Stadijum 1, povišen rizik za ispoljavanje T1D, karakterišu smanjenja u procentu CD25high T ćelija i koncentraciji TGFb1, delimično reflektujući oštećen imunoregulatorni odgovor, što bi mogao biti marker rizika za T1D. FDRs sa i bez rizika za T1D i pacijenti sa T1D bez obzira na stanje, su imali snižen TGFb1, što bi moglo da sugeriše potencijalnu udruženost TGFb1 sa familijarnim rizikom i ispoljavanjem T1D. Takođe, rezultati sugerišu da bi klinički tok T1D mogao biti potencijalno moduliran na nivou TGFb1.
Keywords: CD4+CD25high T cells; TGFb; first-degree relatives of patients with type 1 diabetes; type 1 diabetes.
2024 Tanja Miličić, Aleksandra Jotić, Ivanka Marković, Dušan Popadić, Katarina Lalić, Veljko Uskoković, Ljiljana Lukić, Marija Maćešić, Jelena Stanarčić, Milica Stoiljković, Mina Milovančević, Đurđa Rafailović, Aleksandra Božović, Nina Radisavljević, Nebojša M. Lalić, published by CEON/CEES.
Conflict of interest statement
All the authors declare that they have no conflict of interest in this work.Conflict of Interest: The authors stated that they have no conflicts of interest regarding the publication of this article.
Figures


References
-
- Zhang Y, Feng Z P, Naselli G, Bell F, Wettenhall J, Auyeung P, et al MicroRNAs in CD4(+) T cell subsets are markers of disease risk and T cell dysfunction in individuals at risk for type 1 diabetes. J Autoimmun. 2016;68:52–61. - PubMed
-
- Oling V, Marttila J, Knip M, Simell O, Ilonen O. Circulating CD4+CD25+high regulatory T cells and natural killer T cells in children with newly diagnosed type 1 diabetes or with diabetes-associated autoantibodies. Ann N Y Acad Sci. 2007;1107:363–72. - PubMed
LinkOut - more resources
Full Text Sources
Research Materials